Ticket to Work for Adults with Psychiatric Disabilities:
Important Variables and Policy Implications
By
Emily Gifford Holmes
A Master’s Paper submitted to the faculty of the University of North Carolina at Chapel Hill in partial fulfillment of the requirements for the degree of Master of Public Health in
the Public Health Leadership Program. Chapel Hill
2011
and First Reader
Date
Second Reader
Abstract
The Ticket to Work-Work Incentives Improvement Act was designed to help adults
receiving Social Security disability return to work and stop receiving benefits. Little data are
available to tell us how successful this program has been in reaching these aims, and no data at
all inform us about how this program has affected adults with psychiatric disabilities. I
interviewed Ticket to Work administrators in seven states with high levels of program enrollment
to learn more about variables that affect the success of the program. The interviews confirm
that only some states are collecting outcomes data for adults with psychiatric disabilities.
Mental health and vocational rehabilitation collaboration was a common theme for these
policymakers, as was the importance of benefits counseling. Improving vocational rehabilitation
and mental health coordination and creating stronger links between the Ticket to Work (TTW)
and Work Incentives Planning and Assistance (WIPA) programs are potential interventions that
Acknowledgements
I would like to thank my readers, Dr. Tolleson-Rinehart and Dr. Sheitman, for their
generous guidance and expertise; without them, this project would not have been possible. In
addition, I would like to express my appreciation to the interviewees who took the time to take
part in my study. I would like to thank Robin Reed, MD, for all of the support that she has
offered this year and, in particular, her willingness to direct me to great mental health resources.
Table of Contents
Abstract………...ii
Acknowledgements………iii
Table of Contents………...iv
List of Tables and Figures………...v
Introduction………..6
Methods………8
Results………10
Discussion………..15
Conclusion……….18
Tables and Figures………...19
Appendix 1: Further Background on the Ticket to Work Program………...20
Appendix 2: Systematic Review of Supported Employment………...31
Appendix 3: Methods Appendix………..66
List of Tables
Table 1. Ticket to Work Implementation by Phase………..19
Table 2. Rate of Any Competitive Employment………...43
Table 3. Days to First Job………44
Table 4. Total Hours Worked in Competitive Employment………44
Table 5. Total Wages Earned in Competitive Employment………...45
Table 6. Total Weeks Worked………45
Table 7. Job Tenure (average weeks per job)……….46
Table 8. Summary of Studies……….47
It is an unfortunate irony that health insurance and disability benefits, when given to
disabled adults, virtually guarantee that they will never rejoin the ranks of the employed. This is
particularly true for adults with psychiatric disabilities, who have an exceedingly high
unemployment rate, by any standard, of 85%.1, 2 This rate cannot fully be explained by a lack of motivation, as 55% of unemployed adults with severe mental illness express a desire to
obtain competitive employment making typical wages in an integrated workplace.3 Furthermore, these adults and their family members cite employment as their greatest unmet need.4, 5
Employment is associated with an increased quality of life in this population, and for this reason should be a high priority for mental health providers.6, 7
Research demonstrates that, with appropriate supports, adults with severe mental illness
are capable of working in competitive jobs (see Appendix 2). Despite the evidence from these
studies, adults with psychiatric disorders make up the fastest-growing group of Social Security
disability beneficiaries, with 34% of Social Security Disability Insurance (SSDI) and 27% of
Supplemental Security Income (SSI) recipients qualifying on the basis of mental illness.8 These
benefits serve as tremendous disincentives for people who are interested in returning to work.
Adults receiving benefits are significantly less likely to seek employment.9, 10 Furthermore, less
than 1% of these beneficiaries leave the disability rolls each year.11, 12 If these beneficiaries
obtain employment they do so at the risk of losing benefits, including health insurance which
they value more highly than cash benefits.13-17
In response to these disincentives and increased advocacy from disability rights groups
Congress passed PL 106-170, also known as the Ticket to Work-Work Incentives Improvement
Act (or Ticket Act) in 1999. The Ticket Act is based upon four principles: to help individuals with
encourage states to adopt Medicaid “buy-in” programs that allow individuals with disabilities to
qualify for Medicaid despite having higher income levels than the current standards; to allow
beneficiaries to maintain Medicare benefits while employed; and to establish vocational
rehabilitation programs that will prepare disabled beneficiaries for the workforce.18 Ultimately,
the goal of Ticket to Work is to graduate Social Security beneficiaries from public assistance.
The act is named after the ticket that disabled beneficiaries receive in the mail from the
Social Security Administration, which serves to educate those beneficiaries of their option to
enroll in Ticket to Work. The ticket, which is really just a symbolic tool, can be exchanged for
services from a participating Employment Network (EN) including vocational rehabilitation and
placement services. Ticket holders are able to locate local ENs using an online database and
ENs have access to lists of qualified ticket-holders in their region who are not currently using the
services of another EN. In turn, the federal government reimburses the EN’s for each
beneficiary that returns to work.18
In addition to the employment services that are offered to beneficiaries, the Ticket to
Work Act also provided for state demonstration projects to create Medicaid buy-ins for disabled workers. These programs allow disabled individuals whose incomes exceed the limits for
Medicaid coverage to pay a premium, often on a sliding scale, to enroll in Medicaid. In addition, beneficiaries are assured that they will not be reevaluated for disability status while they are in
the process of transitioning to work.18
As part of the Ticket Act, the Social Security Administration is required to deliver periodic evaluations on program implementation to Congress.19 Thus far, these reports have focused
primarily on the rates of disability beneficiary enrollment and the role of the various vocational
rehabilitation programs. They have not investigated the outcomes for particular subgroups,
The purpose of this study is to evaluate the Ticket to Work program’s ability to help
adults with psychiatric disabilities obtain employment. The study consists of interviews with
knowledgeable state Ticket to Work administrators to assess whether these agencies are
measuring vocational outcomes for this population, and if so, if the results demonstrate that the
program has been effective. In addition, this study aims, through interviews with stakeholders
and a review of the literature, to determine which factors more strongly predict the success of
the Ticket to Work program.
Methods
In this study, I triangulated methods in order to better understand the influence of Ticket
to Work in employment outcomes adults with psychiatric disabilities. First, I performed a
systematic review of the literature to gain a better understanding of the best practices, as
determined by the mental health services research community, for helping adults with severe
mental illness obtain employment (see Appendix 2). In addition, I performed in depth,
structured interviews with Ticket to Work administrators in various states in order to obtain their
insights on how the program is faring in terms of meeting its goals.
Selecting Representative States
To date, the Social Security Administration has not released any reports on outcomes
from the Ticket to Work program. However, in their most recent report, the SSA provided the
rates of enrollment per 100,000 Ticket-eligible beneficiaries, stratified by state. I used these
data to target states that have higher rates of enrollment, with the assumption that these states
Work program was implemented in three phases. The first phase comprised 13 states and
began in February of 2002. Phase 2 began in November of 2002 with 20 additional states and
the District of Columbia. The remaining 17 states and the U.S. territories implemented the
program in November of 2003 (see Table 1). A few phase 3 states had higher enrollment than
some of the phase 1 states, even though those phase 1 states had a 21-month head start. For
this reason, I selected the highest enrolling states from each Phase, instead of the states with
the highest enrollment to adjust for the variable of time.
I contacted state VR agencies in 12 states to try to identify a Ticket to Work
administrator in each state. I then sent an e-mail invitation to participate in my study to the
administrator for each of the 11 states. If I did not receive a response after two weeks, I sent a
follow-up e-mail. Seven administrators responded, representing seven different states
In the end, seven states that were among the states with high enrollment rates, and also
offered good regional representation and considerable variance in state political culture
orientation to the provision of social services were represented: Deleware, Missouri, New York,
South Dakota, Utah, Vermont, and Virginia
The In-Depth Interview
After receiving a ruling from the IRB that my research was exempt from further review, I
invited Ticket to Work administrators from each of the representative states to participate in my study. Seven administrators chose to participate, and I interviewed them over the telephone
were recorded with a digital voice recorder. I then transcribed each of the interviews and coded
them, looking for common themes among the respondents (see Appendix 3).
Results
Goals
When I asked about the goals of the Ticket to Work program, the administrators all
agreed that one of the goals of the program is to help Ticket-holders return to work.
Additionally, two of the seven respondents noted that helping beneficiaries get off of benefits is
a goal, and two other respondents mentioned the recovery of revenue for the states as a goal.
Measuring Outcomes
I asked each administrator whether his or her state keeps data on Ticket to Work
outcomes for enrollees with psychiatric disabilities; only three of the seven states keep such
records specific to this population of beneficiaries.
Individual Placement and Support and Ticket to Work
Four of the seven administrators were familiar with Individual Placement and Support,
the form of supported employment that has the most evidence for improving employment outcomes in adults with psychiatric disabilities (see Appendix 2). Those who were familiar with
IPS all agreed that the Ticket to Work program should encourage greater implementation of
The Mental Health System and Ticket to Work
As a whole, the administrators had mixed opinions about the mental health (MH)
system’s influence on Ticket to Work outcomes. Three of the seven stressed that the MH
system is a barrier to helping adults with psychiatric disabilities return to work.
These barriers are both cultural and structural, according to these respondents. The
administrator from South Dakota said, “mental health centers aren’t really supportive of the
people working.” The administrator from Delaware noted that psychiatrists often encourage
individuals with psychiatric disabilities to quit working immediately when they become sick
instead of encouraging the patient to use available resources, such as sick leave and FMLA, to
work through their illness.
The respondents emphasized barriers that the mental health system places before
individuals that keep them from working successfully. The Missouri administrator cited
regulations that limit access to transportation, and the respondent from Delaware lamented the
Medicaid payment system, saying
One of my trips into a mental health facility several years ago…they had a thermometer like the United Way thermometer and were congratulating the case managers that brought in the most Medicaid money. Well, how do you get more Medicaid money? You provide more services to people. Services that include not teaching them independent living but teaching them dependent living. Taking people to grocery stores. Doing people’s banking…all of those kinds of
stuff…taking them out on recreational trips. Stuff the van with 12 individuals with mental illness and take them to the mall. That’s how you get Medicaid money, and when somebody gets a job then they are not as available for all of these activities than somebody [who] doesn’t have a job.
Despite these barriers, the administrators noted that collaboration with the mental health
system is necessary to provide the best outcomes for this population of beneficiaries. The
services and MH case management, saying that success rates are lower when MH services are
not actively involved in the process.
The respondent from Vermont described the collaborative system in place in his state:
Many of them [community mental health agencies] in our state are very, very small, and most of them have chosen not to become ENs, just because they don’t want to deal with it. They don’t want to deal with the administration; they don’t have the capacity to deal with the administration. But they…are providing vocational services, to a lot of people on SSI and SSDI. So we basically partnered with them whereby…if it’s a consumer that we are both serving…We split the payments, fifty-fifty…
In New York, the Office of Vocational Rehabilitation is in the process of collaborating
with the Office of Mental Health to pilot IPS in a few areas of the state in hopes of expanding
throughout the state in the future.
Financial Incentives to Participate
Of the respondents, five noted the importance of the financial incentives in improving
Ticket to Work participation among agencies that provide employment services. The
administrators emphasized that these funds are helpful in continuing to provide services for
clients.
The respondent from Delaware noted, “I have managed to encourage one of our mental health facilities to become an EN, and that has been pretty prosperous because they’re now
getting paid for follow-along services.” Virginia has gone a step further and provides benchmark retention payments to organizations that it partners with:
because any time state VR closes a case successfully Phase 1 payments are off the table, so as an incentive for other agencies to work with Ticket holders we know that they don’t have access to Phase 1 payments so we’re going to give them some retention payments…
However, survey respondents also commented on the administrative challenges of
receiving payments from the Social Security Administration, and cited this as a reason that more agencies are not participating in the program.
Benefits Counseling
Benefits counseling was noted by five of the seven participants as an important variable
in the success of Ticket to Work for adults with psychiatric disabilities. The administrator from
Vermont said,
…if you just spend a little bit of time understanding those work incentives, then imagine yourself as a person with a psychiatric disability…confronted with
someone trying to explain a trial work period or an extended period of eligibility or an impairment-related work expense to you. You can imagine the anxiety that causes for folks, especially when their benefits change as a result of work. And not just their Social Security benefits, but their food stamps, their fuel assistance, their housing, etc. It’s all inter-linked. So having a reliable source of benefits planning is a key intervention.
Despite the importance of benefits counseling, two of those five respondents
acknowledge that benefits counseling could be better coordinated with the Ticket to Work
Client Dissatisfaction with the Vocational Rehabilitation System
One theme that appeared in three different interviews was the disappointment or
dissatisfaction that clients had with Vocational Rehabilitation, which might make them more
reluctant to try to use services again. The interviewee from Delaware commented,
I have seen so many times how disappointed they have been. It takes a leap of faith for somebody to go out of the state hospital program and they’re on there talking about getting a job and things like that and all of their hopes and stuff are up and then there’s a failure at the other end.
In addition, the respondent from New York noted that there is some “frustration with folks
feeling that vocational rehabilitation hasn’t been responsive to people with serious mental
illness.”
Ranking Variables Important to the Success of Ticket to Work
I asked each of my respondents to rank a list of seven variables -- MH infrastructure,
state political culture, state budget, presence of a state Medicaid Buy-In, strength of the state
vocational rehabilitation program, access to Supported Employment, and access to IPS -- from
most important to least important to the success of the Ticket to Work program for adults with
psychiatric disabilities. Overall, the respondents agreed that the state Vocational Rehabilitation
program is most important factor, followed by the state MH infrastructure. The political culture
of the state and the presence of a state Medicaid Buy-In were the least important variables; the
New York respondent stood out as an exception, ranking the political culture as the most important factor. Administrators ranked the state budget, supported employment, and IPS as
Discussion
The interviews with these seven Ticket to Work administrators revealed several major
themes that allow us to understand the strengths and weaknesses of the program. These
themes highlight a few policy opportunities that could be adopted in the future to improve
employment outcomes for adults with psychiatric disabilities.
Measuring Outcomes
The program lacks data for evaluation, and nor is such data required by the federal
government. When asked if her state collects data on Ticket to Work outcomes for adults with psychiatric disabilities in her state, one respondent said, “We do, but…that’s not part of what
Ticket asks us to do when the individual assigns.” The Ticket to Work program should collect
data on employment outcomes for all enrollees by disability type. An enrollee with
schizophrenia will have different needs from an enrollee who is blind. The states should have
the capability of measuring their successes with different subgroups of clients, so that they can
evaluate their efforts and provide alternative interventions if necessary.
The Need for Vocational Rehabilitation-Mental Health Collaboration
The respondents agreed overall that the two most important variables in the success of
Ticket to Work are the strength of the state VR program and the strength of its MH
possible outcome for the client, but even the separate programs’ expertise is inadequate in the
absence of coordination and communication.
Some respondents have noted that the state VR systems have not always met the
needs of adults with psychiatric disabilities. This finding underscores the need for the MH
system, which has a better understanding of the needs of this particular population, to be
involved with employment services. However, to achieve the best employment outcomes, the
MH system must be supportive of the client’s employment goals.
The IPS model is the best opportunity for VR and the MH systems to collaborate. Every
administrator who was familiar with IPS recognized its success and agreed that Ticket to Work
should encourage greater implementation of this model. Federal support for education of state
administrators about the IPS model and the evidence supporting it would be an important first
step toward more effective policy. States with more developed VR-MH collaborations could also
share the strategies they have used to collaborate effectively, in the time-tested mode of states
as “natural laboratories” for policy development.
Vermont, which has the highest Ticket to Work enrollment rate in the U.S., is one model
of a successful VR-MH collaboration. The community mental health centers are small and do
not have the resources to apply for Ticket to Work payments, but they do have the expertise
with the IPS model. The state VR system can step in and provide the administrative legwork and both agencies reap the financial benefits of helping adults get back to work.
Having a variety of employment agencies involved with Ticket to Work is extremely
important to its success. The agencies with a particular area of expertise, such as mental
health, have a greater chance of first engaging the client in services and then helping him or her
to reach employment benchmarks like getting and holding a job in the competitive employment
encouragement to participate, but the administrative requirements have become so
burdensome that many are choosing not to participate. Collaboration between VR and local
agencies could help mitigate these stresses and allow more agencies to become involved in the
program.
Coordinating Ticket to Work and Work Incentives Planning and Assistance (WIPA)
Benefits counseling was considered by most administrators as an important variable in
the success of the Ticket to Work program, but the coordination of Ticket to Work and WIPA is
fractured in many states. Some administrators mentioned that, in their states, WIPA is delivered
by a completely different agency that does not communicate with the state VR offices.
Understanding the effect of employment on Social Security benefits is very complex. In
addition, employment can influence the receipt of other benefits, such as fuel assistance and
housing assistance, which can vary from state to state. If beneficiaries are better able to
understand how employment will influence their benefits, they can make informed decisions
about seeking employment, and in some cases they may see that the benefits of working
outweigh the risks.
Virginia has developed a novel way of integrating benefits counseling with Ticket to Work called Work World. Work World is a computer program that allows a vocational counselor
to input a client’s information to see how employment at different wages and hours will influence each of his or her benefits. This allows a vocational counselor, who might not have extensive
benefits counseling expertise, nonetheless to provide accurate benefits information to clients.
More cross-state sharing of innovations and information could enable other states to adopt
Conclusions
The Ticket to Work program shows promise for improving employment outcomes among
adults with psychiatric disabilities. At present, it is not realizing its promise, but my interviews
with administrators in seven states highlighted several themes that suggest potential policy
interventions that may improve outcomes moving forward. In particular, the Ticket to Work
program needs to encourage states to measure outcomes for enrollees by disability. This could
help states evaluate whether their interventions are helping. Additionally, better collaboration between the state MH infrastructure and state VR programs could strengthen the efforts of both
organizations. Finally, benefits counseling through the WIPA programs should be more tightly linked with state Ticket to Work agencies, so that adults with psychiatric disabilities can see that
they do have the potential to work. As I noted at the outset, people with psychiatric disabilities
Table 1. Ticket to Work Implementation by Phase Phase 1 February 2002 Phase 2 November 2002 Phase 3 November 2003 Arizona Colorado Delaware Florida Illinois Iowa Massachusetts New York Oklahoma Oregon South Carolina Vermont Wisconsin Alaska Arkansas Connecticut
District of Columbia Georgia Indiana Kansas Kentucky Louisiana Michigan Mississippi Missouri Montana Nevada New Hampshire New Jersey New Mexico North Dakota South Dakota Tennessee Virginia Alabama California Hawaii Idaho Maine Maryland Minnesota Nebraska North Carolina Ohio Pennsylvania Rhode Island Texas Utah Washington West Virginia Wyoming American Samoa Guam
Northern Mariana Islands Puerto Rico
Appendix 1: Further Background on the Ticket To Work Program
To appreciate the significance of the Ticket to Work-Work Incentives Improvement Act
(Ticket Act) we must first examine the historical context in which the legislation arose. Here, I
will provide a brief history of Social Security as it relates to adults with disabilities. In particular, I
will discuss the theory of punctuated equilibrium and how this theory helps us to better
understand the inception of Ticket to Work (TTW). I will also give a brief update on the current
status of Ticket to Work.
Punctuated equilibrium is the name of a theory of “institutionally reinforced stability
interrupted by bursts of change.”21, page 99 That is, using the punctuated equilibrium theory, we see that the political environment is dominated by policies that maintain a steady status quo,
only periodically shifted with a dramatic policy change.
Using the theory of punctuated equilibrium, policy formation and implementation can be compared to the construction of a house. For example, the Ticket Act is in essence the most
recent addition to the house of Social Security policy. The government laid the foundation of this house in the 1930s and approximately every decade has added an addition or made a
structural modification, reflecting the particular styles of that time period. The house remains
mostly unchanged for years until policy-makers enact a specific alteration that builds upon the
existing structure. The Ticket Act is not the final upgrade but just another punctuation of the
Social Security status quo.
In the case of Ticket to Work, though, we must also consider the development of the
disability rights movement. These two spheres of politics-Social Security and disability
Here I will discuss the development of the Ticket to Work-Work Incentives Improvement
Act. In particular, I will note how the theory of punctuated equilibrium can be applied to both
Social Security policy and disability rights policy, since understanding the background of both of
these is critical to understanding the Ticket Act.
A Brief History of Social Security Policy
Social Security has changed dramatically since April 14, 1935, when Franklin D.
Roosevelt signed the Social Security Act. This legislation was originally designed to create a
social insurance program to protect retired, eligible Americans 65 years and older from poverty.
Over the next 75 years Social Security underwent many reforms and expansions that have
created the system that exists today.22
Generally, Social Security policy remained largely unchanged until1956, when a
provision was made for disability insurance, now known as Social Security Disability Insurance
(SSDI), for individuals between the ages of 50 and 64 who were significantly disabled by a
life-threatening condition. To collect disability benefits, the beneficiary must have paid into the
Social Security trust fund before becoming disabled. Over the next three decades additional modifications were made to the legislation, lowering the age limit for SSDI and allowing younger
and younger adults to qualify.22
By the 1970’s, Social Security had already been providing aid for many years to poor
adults who were blind, elderly, or disabled through funds that were distributed to the states and
local governments. Over time, though, this system became a complex network of more than
1,000 state and local agencies. In order to streamline this bureaucracy, Congress passed
called Supplemental Security Income (SSI). Instead of being administered by the different
states, the Social Security Administration would assume responsibility for these funds.22
SSDI and SSI Today
Although the SSDI requirements are more liberal than they were when SSDI was
established in the middle of the 20th Century, one must fulfill certain requirements to qualify.
Beneficiaries must have paid into the Social Security trust fund prior to becoming eligible for
disability benefits, and though there is no age limit, an individual must meet the SSA’s work
history criteria. Work history is defined using a system of credits that must have been acquired
over a specific time period. In 2011, one credit is earned for each $1120 that an individual
works, and he or she can earn up to 4 credits per year. The number of credits required to
qualify for SSDI varies based on age ranging from 6 credits for 24 year-olds to 40 credits for 62
year-olds.23
In addition, the beneficiary must be unable to obtain Substantial Gainful Activity (SGA),
which is the metric that the SSA uses to define disability. In 2010 SGA for monthly earnings
was $1,640 for blind individuals and $1000 for the non-blind, with additional considerations taken for living situation and dependents.23 If an individual is able to earn more than SGA he or
she is not considered disabled for Social Security purposes and will automatically be denied benefits.
Blind and disabled individuals may also qualify for SSI if they fall below certain income
limits. SSI also uses SGA as a determinant for disability. In contrast to the SSDI program, the
SSI program does not require the beneficiary to have paid into the Social Security system.
payments can be stacked on top of SSDI payments such that an individual is able to meet the
maximum payout provided by SSI.23
Individuals who qualify for SSI automatically are enrolled in Medicaid in most states.
Individuals who qualify for SSDI will qualify for Medicare after a 24-month waiting period.23
These medical benefits are particularly beneficial for disabled beneficiaries, as they have health
care expenditures that are five times greater than those of the non-disabled population.24
Furthermore, disabled individuals are less likely to be able to find affordable insurance in the
private market.
Social Security Equilibrium in the 1990’s: Increasing Demands
The last three decades of Social Security policy have been overshadowed by the
increasing costs and rapid growth in the number of Social Security beneficiaries. Those
increases, along with the aging of the baby-boom population, have created serious concerns
about the viability of Social Security in the future and have contributed to continuous calls for
reform.
A number of hypotheses have been proposed to explain the dramatic increase in SSDI and SSI rolls and expenditures. For example, H. Stephen Kaye attributes these changes to
more significant impairments among the disabled that exclude them from the work force.25
Others believe that the Americans with Disabilities Act (ADA) of 1990, which was designed to
eliminate workforce discrimination and create more opportunities for employment for those with
disabilities, has actually caused employers to be more cautious about employing individuals with
Autor and Duggan provided the most comprehensive explanation in a 2006 National
Bureau of Economic Research report. In this report they suggest that the increase in the
disability rolls is primarily due to the liberalization of eligibility criteria that occurred in 1984.
Specifically, they note that these reforms have changed the proportion of disabling diagnoses
from more acute, higher mortality conditions, such as heart disease, to more chronic conditions
with an earlier onset and lower mortality rate, such as arthritis and mental illness. Thus,
individuals are qualifying earlier and staying on the rolls longer.28
In addition, they argue that disability payments have risen disproportionately to wages,
creating a greater incentive to apply for disability rather than work, especially when considering
the addition of health care benefits. Last, they note the increasing number of women in the
workplace, which has in turn increased the number of people who are potentially eligible for
benefits.28
Regardless of the cause of the expanding disability rolls, the rising costs were
concerning to Americans. With the aging of the baby-boomers it seemed likely that Social
Security would be bankrupt.
The Disability Rights Movement: An Impetus for Social Security Reform
In addition to the financial strain of the expanding Social Security program, other events
in the 1990’s led to a revolution in disability policy.
The first of these events, the enactment of the Americans with Disabilities Act in 1990,
dramatically changed the expectations for adults with disabilities. Before, the most common
conception was that disabled individuals would not work, but now disability rights activists were
integrated into the workplace. Despite this legislation, the employment rate for people with
disabilities actually dropped in the 1990’s, at the same time that disability rolls were
expanding.29
By the mid-to-late 1990’s it was clear that a number of disincentives were preventing
disabled Americans from rejoining the workforce. Specifically, beneficiaries feared the loss of
health care coverage by Medicaid or Medicare if they attempted to return to work. Even if they
were able to obtain health insurance, private insurance policies are less likely to cover specific
health care needs of the disabled, such as personal assistants and adaptive equipment. Even
worse, it would be more likely that these adults would not be able to obtain health insurance at
all as they tend to be unskilled workers with low levels of education working in jobs that do not
provide health insurance benefits to any employee, much less disabled employees.24
These concerns allowed disability rights activists and interest groups such as the
National Alliance on Mental Illness (NAMI) to obtain political momentum, which ultimately led
President Clinton to establish the Presidential Task Force on the Employment of Adults with
Disabilities in 1998. This commission urged the Clinton administration to take immediate measures to enact legislation that would remove these disincentives and allow thousands of
adults with disabilities to enter competitive employment.30
Though the unemployment rate for the disabled was alarmingly high, total US unemployment rate was at a 29-year low in 1998 and the economy was strong.31 These
circumstances would have made employers more eager to hire employees with disabilities.
Together, these factors created a climate in which Social Security reform was almost
inevitable. The White House, advocacy groups, and Congress were all interested in reform and
Ticket to Work and Work Incentives Improvement Act (TTW-WIIA)
In response to the Presidential Commission, President Clinton threw his support to
Senators James Jeffords (R-VT), Edward Kennedy (D-MA), William Roth Jr. (R-DE), and Daniel
Patrick Moynihan (D-NY) as they co-sponsored a bill called the Work Incentives Improvement
Act. This bill would allow disabled workers to retain Medicare and Medicaid coverage when
they return to work, potentially eliminating the most significant disincentive that disability
beneficiaries face when they go to work.32 Clinton publicly shared his support in the State of the Union address on January 19, 1999,
No one should have to choose between keeping health care and taking a job. And therefore, I especially ask you tonight to join hands to pass the landmark
bipartisan legislation proposed by Senators Kennedy and Jeffords, Roth and
Moynihan to allow people with disabilities to keep their health insurance when
they go to work. 31(page 8, 1st paragraph)
Ultimately this version of the bill stalled, though a similar bill sponsored by
Representative Rick Lazio (R-NY) was eventually passed on December 17, 1999. This bill,
called the Ticket to Work-Work Incentives Improvement Act passed with votes of 418-2 in the
House and 95-1 in the Senate, becoming PL 106-170.19
The bipartisan popularity of the legislation was not surprising. The goal of decreasing
the financial burden of Social Security by graduating beneficiaries to self-sufficiency and equal
opportunities in the workforce was appealing from both financial and social justice perspectives.
The Clinton administration and liberals could declare it a victory for disability rights while
conservatives could celebrate the contraction of a ballooning Social Security system. In
Security disability rolls the US government would save $3.5 billion over the lifespans of those
individuals, a savings that would offset the concerns of conservatives about the cost of the bill.18
The Ticket Act is based upon four principles: to help individuals with disabilities prepare
for work by providing employment readiness services and health care; to encourage states to
adopt Medicaid “buy-in” programs that allow individuals with disabilities to qualify for Medicaid
despite having higher income levels than the current standards; to allow beneficiaries to
maintain Medicare benefits while employed; and to establish vocational rehabilitation programs
that will prepare disabled beneficiaries for the workforce.18 Ultimately, the goal of Ticket to Work
is to graduate Social Security beneficiaries from public assistance.
The act is named after the ticket that disabled beneficiaries receive in the mail from the
Social Security Administration, which serves to educate those beneficiaries of their option to
enroll in Ticket to Work. The ticket, which is really just a symbolic tool, can be exchanged for
services from a participating Employment Network (EN) including vocational rehabilitation and
placement services. Ticket holders are able to locate local ENs using an online database and
ENs have access to lists of qualified ticket-holders in their region who are not currently using the services of another EN. In turn, the federal government reimburses the EN’s for each
beneficiary that returns to work.18
In addition to the employment services that are offered to beneficiaries, the Ticket to Work Act also provided for state demonstration projects to create Medicaid buy-ins for disabled
workers. These programs allow disabled individuals whose incomes exceed the limits for Medicaid coverage to pay a premium, often on a sliding scale, to enroll in Medicaid. In addition,
beneficiaries are assured that they will not be reevaluated for disability status while they are in
Ticket to Work: The First Decade
Ticket to Work was implemented in three phases. Phase 1 began in February of 2002
with 13 states participating. In November of 2002 phase 2 began with 20 additional states and
the District of Columbia. Finally, in November of 2003 the remaining 17 states and U.S.
territories implemented Ticket to Work (see Table 1).
During TTW’s first decade, four evaluations were released in 2004, 2006, 2007, and 2008. In general, these reports have had similar findings.33-36
Ticket to Work Enrollment
Ticket to Work enrollment has been low, but increasing slightly. In the 2006 report, the
enrollment rate was 1.1% of all beneficiaries. In 2008 that number increased to 1.8%.
Unfortunately, these numbers are not high enough to meet the benchmark (a 0.5% increase in
graduation from the Social Security rolls) that Congress set when enacting the bill.33-36
Despite these low rates of enrollment, there is hope that the program can continue to
expand. Surveys of beneficiaries show that 15% believe that they will leave the Social Security
rolls in the next 5 years due to employment. By capturing those individuals who believe they will
work, but who have not already enrolled in Ticket to Work, the SSA can increase total
enrollment rates.33-36
In addition, the reports show that certain beneficiaries are more likely to seek
employment. The TTW program can become more efficient if it targets those particular
beneficiaries, a group that includes younger adults (<55), those who have worked recently, and
Ticket to Work Employment Networks
In addition to the challenges of enrolling beneficiaries, the Ticket to Work program is also
struggling with the task enrolling Employment Networks. Without a variety of service providers,
the Ticket to Work program provides little deviation from the traditional vocational rehabilitation
system that was in place before the law was enacted.33-36
Initially ENs reported that they were losing money by serving TTW clients. In particular,
EN officials expressed frustration with the burdensome paperwork required to document
employment history and with the significant delays in receiving payments, typically between 7
and 9 months. As a result of these problems, fewer vocational programs enrolled as ENs while
others that were enrolled began leaving the program altogether. Furthermore, many current
ENs are not actually accepting tickets.33-36
The SSA recognized these problems early and made attempts to make the program
more palatable for the ENs by streamlining paperwork and increasing financial incentives.
However, these new rules did not go into place until 2008, resulting in a significant loss of
momentum for the program.36
Initial Results of the Ticket to Work Program
Despite the problems with both beneficiary and EN enrollment, the TTW has had some limited successes. Service use has increased. In addition, the SSA reports a cultural shift in
attitudes of its employees. Now, SSA employees are more supportive of employment efforts and beneficiaries are more likely to receive benefits planning. Unfortunately, it is unclear
whether changes to the Ticket to Work program has resulted in a decrease in benefits paid to
The process of moving from disability to employment is a slow one and rapid graduation
of beneficiaries from the rolls is unlikely. While the Ticket to Work program does not appear to
Appendix 2: Systematic Review of Supported Employment
Background
Historically, adults with severe mental illness have struggled to join the traditional
workforce. When an adult with a psychiatric disability seeks vocational rehabilitation services
he is typically directed to vocational rehabilitation (VR) programs. In the traditional VR model
the client obtains pre-vocational training, begins working in a sheltered workshop on a
supervised work team, and then graduates to competitive employment, that is, employment in
an integrated setting earning average wages. However, many clients become stalled in these
transitional settings and only 15%-30% achieve competitive employment.37 This is at odds with
the preference of these clients; most adults with severe mental illness prefer competitive to
transitional employment.38
Over the last two decades, researchers have begun testing a new model of vocational
rehabilitation called Individual Placement and Support (IPS). This model is characterized by
rapid job placement in a competitive setting with on-the-job support from a trained vocational specialist. Thus, the train-then-place model of conventional vocational rehabilitation is replaced
with the place-then-train model of IPS. In addition, IPS emphasizes collaboration between the
clinical and employment teams and the delivery of time-unlimited services, both in contrast to
the traditional vocational rehabilitation models.39
The purpose of this systematic review is to compare these two models-conventional VR
and IPS- in adults with severe mental illness. Outcomes of interest include vocational
outcomes, such as amount of time spent in competitive employment, and non-vocational
Methods
Types of Studies
All studies that compared employment and non-employment outcomes for IPS and
traditional vocational rehabilitation were eligible for consideration, with the exception of case
studies, which were excluded. In addition to randomized controlled trials, the search produced
a few quasi-experimental studies, though they were ultimately excluded from the review.
Participants
I included studies in which participants had diagnoses of severe mental illness. For the
purposes of this systematic review severe mental illness is defined as a DSM-IV diagnosis of schizophrenia-spectrum disorder, bipolar disorder, recurrent major depression, and borderline
personality disorder with significant dysfunction. Studies were excluded if all participants were
not 18 years of age or older.
Interventions
The experimental intervention that I am examining is Individual Placement and Support
(IPS), a specific form of vocational rehabilitation developed by Robert Drake, MD, PhD and
Deborah Becker, M.Ed. IPS is based on six fundamental tenets:
1. Rehabilitation is a component of mental health treatment and these services
should be delivered together
2. The goal of IPS is competitive, integrated employment in community settings,
3. Individuals should rapidly enter the work-force rather than spend large
amounts of time in pre-vocational training
4. Vocational rehabilitation services are provided on the job in the integrated,
community work setting
5. Clients received time-unlimited services
6. Clients enter jobs based on their own preferences39
The preferred method for measuring implementation of IPS is the IPS Fidelity Scale.40
The control intervention is conventional vocational rehabilitation (VR), a term that I will
use in this paper to describe a group of heterogeneous employment programs. Different
authors use different names for these programs, and while the specific strategies can vary from
agency-to-agency, they are similar in that they emphasize work readiness and pre-vocational
training. In addition, these services are not connected to the mental health services that a client
receives. Studies were eligible if the control intervention possessed these characteristics. While
these services are varied and do not have associated fidelity scales, they all differ in a common
way from IPS, an intervention that focuses on rapid job placement with on the job training.
Outcomes Measures
Primary Outcomes. The primary outcome of interest is competitive employment,
defined as employment at a job not reserved for adults with disabilities, making at least
minimum wage. There are a number of ways to measure competitive employment, and this
systematic review will assess the most common including:
• Days to first job
• Total competitive hours
• Total competitive wages
• Total weeks worked
• Job tenure
Secondary Outcomes. In addition to employment outcomes, this systematic review will
examine a number of other non-vocational outcomes. These outcomes will include:
• Job Satisfaction
• Self-Esteem
• Quality of Life
These outcomes will be included if they are measured with a validated assessment,
though specific instruments may vary from study to study.
Search Methods for Identification of Studies
On March 9, 2011 I searched the PubMed database using the MESH terms “supported
employment” and “mental illness”. I limited the search to English-language papers with
abstracts, published since 1960, and received 154 abstracts. I reach each abstract individually
and included it if it met the criteria for studies, participants, interventions and outcomes. Of the
154 results 24 abstracts appeared to meet the criteria and were selected for further review.
I then conducted a second search using the search chain “supported employment” OR
additional papers. I carefully read these 26 papers and excluded all but 9, which met eligibility
criteria.
Data Collection and Analysis
I used standard forms to extract data from the 9 studies (see appendix), including
eligibility criteria, number of participants, numbers of dropouts, and results. In addition, I
estimated the likelihood of selection bias, measurement bias, and confounding in each of the
studies using a plus system. One, two, or three plus signs are used to represent low, moderate,
or high likelihood of bias, respectively. Then, I made an estimate of the study’s overall internal
validity (good, fair, or poor) based on the overall risk of bias.
Using these forms, and my judgment about the internal validity of each study, I then
looked for patterns in the results as well as outliers in order to better understand the complete
picture presented by the evidence.
Results
A total of nine studies met inclusion criteria for the review.41-49 Altogether 1407
participants in the nine studies were randomized to either IPS or conventional VR (714 and 693
adults, respectively). The studies varied in length from 12 months to 2 years. All studies
included at least one measure of competitive employment. Six of nine studies included
measures of quality of life, five of nine included measures of self-esteem, and four of nine
included measures of job satisfaction.
Primary Outcomes
All of the studies included a measure of competitive employment. In this review I have
broken down the different measures of competitive employment to ease comparison.
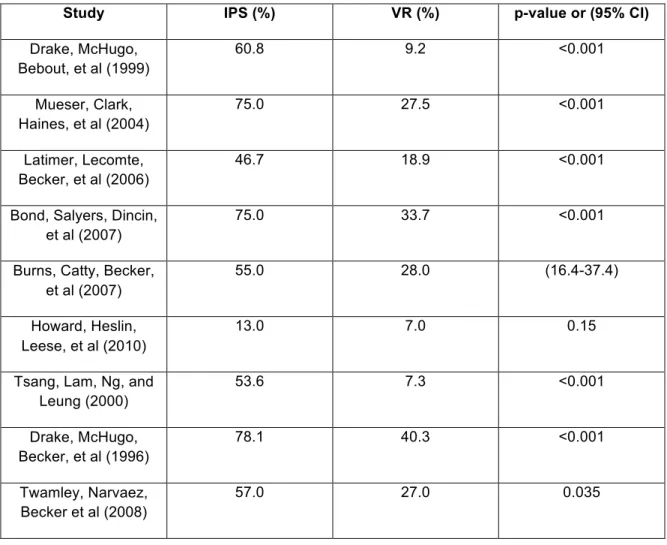
Rate of Any Competitive Employment. Table 2 shows the rates of competitive
employment (at least one day) for IPS and VR participants in each of the nine studies. With the
exception of the Howard, Heslin, Leese et al study, all studies demonstrated that IPS was
superior to conventional VR. In that particular study, almost twice as many IPS participants
achieved competitive employment, but the trend was not statistically significant.
Days to First Job. Five of the studies measured the number of days to first competitive
job (Table 3). Three of these studies found that participants enrolled in IPS had fewer days to
first competitive job than those enrolled in conventional VR. The other two studies mimicked
this trend but did not meet significance.
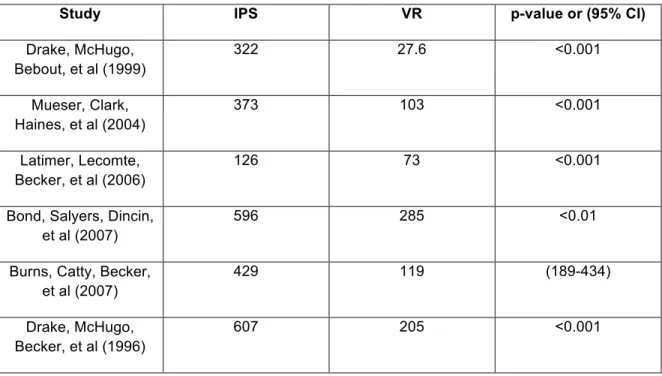
Total Competitive Hours. Six of nine studies measured the total competitive hours
worked by each group (Table 4). In all of these studies, participants in IPS worked more total
competitive hours than participants in conventional VR.
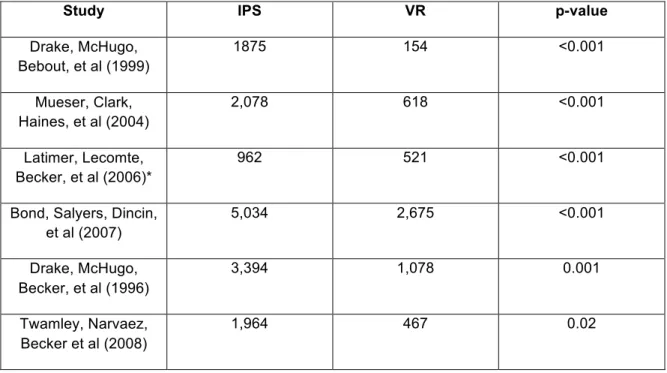
Total Competitive Wages. Six of nine studies measured the total wages earned in
each study arm (Table 5). In every study, IPS was superior to conventional VR in total wages
Total Weeks Worked. Four of nine studies measured the total weeks worked by
employees in IPS and conventional VR (Table 6). Each of the four studies demonstrated that
IPS participants worked more weeks, with all but Twamley, Narvaez, Becker et al study meeting
statistical significance.
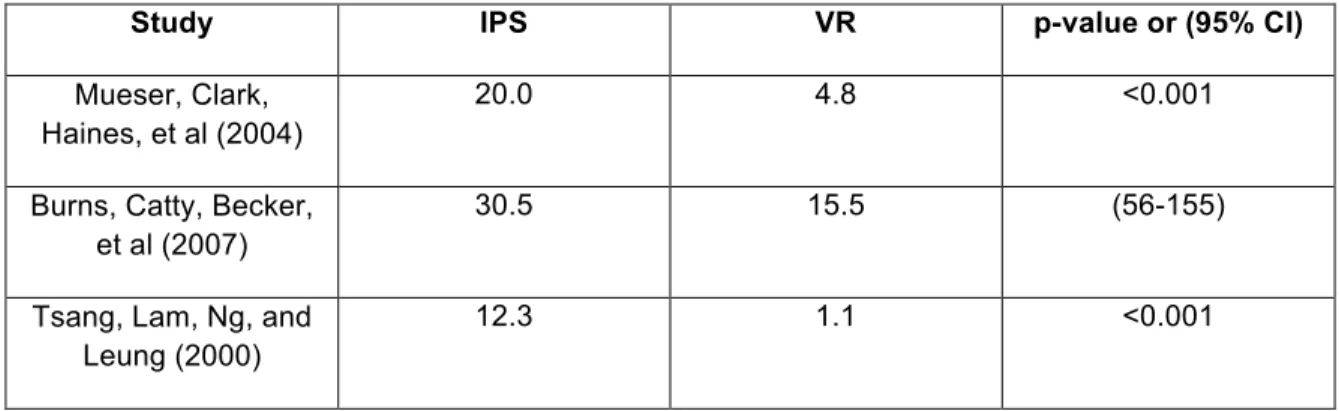
Job Tenure. Three of nine studies measured job tenure, or the average number of
weeks that an employee worked at a particular job (Table 7). In all of these studies, study
participants in IPS had longer job tenures than participants in conventional VR (Table 7).
Secondary Outcomes
Secondary outcomes in this review include quality of life, self-esteem, and job
satisfaction (see Table 8).
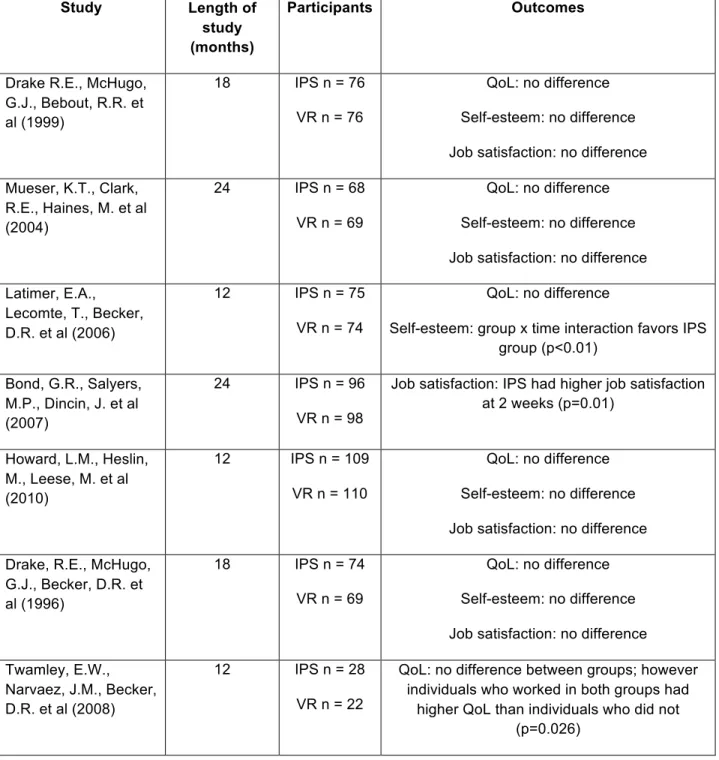
Quality of Life. Six of the seven studies included measures of quality of life. None of
these studies found significant differences between the IPS and the conventional VR groups in
quality of life at the end of the study. In the Twamely, Narvaez, Becker et al. study, however,
the researchers found that the quality of life among all individuals who obtained work in both
groups was higher than the quality of life among individuals who did not find work (p = 0.026).
Self-Esteem. Five of seven studies included measures of self-esteem.42, 43, 46, 47, 50 Of these, all but one found no differences in self-reported self-esteem between subjects
group x time interaction that demonstrated an increase in self-esteem in the IPS group
compared to the control group (p<0.01).
Job Satisfaction. Four of seven included studies reported outcomes on job
satisfaction. Only the Bond, Salyers, and Dincin et al study found a difference in job
satisfaction, with the IPS group having higher job satisfaction at the two-week period after
starting a new job (p=0.01).
Discussion
In this systematic review I examined the results of nine RCTs of IPS versus conventional VR for differences in employment outcomes, quality of life, self-esteem, and job satisfaction.
Employment Outcomes
With the exception of the Howard, Heslin, Leese et al study, all of the studies
demonstrated that IPS was superior to conventional VR in achieving higher rates of competitive
employment. Though that particular study had high IPS fidelity, it differed dramatically from
other studies as it had a much lower rate of employment among IPS participants (13%). The
next lowest employment rate among adults randomized to IPS was 47%.
The authors provided multiple explanations for the discrepancy including lower
effectiveness of IPS in non-US settings, enrollment of potentially less motivated clients, lack of
integration between the IPS program and mental health services, and higher proportion of
countries, Hong Kong, and Canada have demonstrated the superiority of IPS to conventional
VR.43, 48, 49 The second explanation may be more likely, as participants in this study were only
required to attend one information session. However, I compared studies that required
participants to attend two informational settings (Mueser, Clark, Haines, M. et al, Latimer,
Lecomte, Becker, et al, and Bond, Salyers, Dincin, et al) with all of the other studies, which only
required one informational session and found no differences in employment outcomes between
these groups. The fourth explanation is also unlikely as other studies have demonstrated that
IPS can be effective in minority populations.41, 42, 44, 45, 49
The third explanation is the most likely to be a key contributory factor to the differences
in employment outcomes since the coordination of mental health and vocational services is a
key component of IPS. In fact, the IPS fidelity rating for one borough in this study lost points
because mental health services were not coordinated with vocational services. The other
borough, with better integration and a higher fidelity rating, had much better employment
outcomes (3% and 17%, respectively). This finding suggests that the IPS fidelity scale might
not adequately account for the importance of co-location of mental health and vocational
services.
Additionally, the Howard, Heslin, Leese et al study notes that participants in IPS
received an average of 9.3 contacts with vocational specialists at one year. This number seems
low, with less than 1 contact per month. Other studies did not include number of contacts, which would be useful for comparison. If participants in this study were receiving fewer services
than participants in other studies that might explain the differences in employment outcomes.
Excluding the Howard, Heslin, Leese et al study, rates of competitive employment
ranged from 47% to 78%. These rates, which reflect employment among the most motivated
non-disabled population. Though IPS appears to be better than conventional VR, we still need to
research other interventions to ensure that interested individuals with disabilities can find
employment.
Secondary Outcomes
None of the six studies that measured quality of life found a difference between IPS and
conventional employment. However, one study did find that all adults who found employment,
regardless of intervention, had a higher quality of life than adults that were not employed. This
is consistent with previous studies on work and quality of life among adults with severe mental
illness.7
Of the five studies that measured self-esteem, all but one found no difference between
the IPS and conventional VR groups. That study found that the IPS group had a greater
increase in self-esteem over the course of the study compared to the control group. However,
at baseline the IPS group had statistically lower self-esteem. This result should be interpreted
with caution, as these groups had different self-esteem ratings at baseline, which makes
interpretations more difficult.
Job satisfaction did not differ between the experimental and control groups in three of the four studies. In the fourth, job satisfaction was higher after two weeks on the job in the IPS
group. A difference was not found after longer periods of work.
Considering all of the evidence, it is likely that IPS is not superior to conventional VR in improving quality of life, self-esteem, and job satisfaction among adults with SMI. However,
individuals might have reaped the rewards of employment without demonstrating statistically
significant differences in total outcomes.
The results from the Twamley, Narvaez, Becker et al study did reinforce the evidence
that employed adults with SMI have a higher quality of life than do adults who are unemployed.
IPS has consistently been shown to have superior work outcomes compared to conventional
VR, so it is reasonable to adopt this strategy with some confidence that increased employment
can benefit the quality of life of clients.
Conclusions
In this systematic review I found that Individual Placement and Support is superior to
conventional vocational rehabilitation in helping adults with severe mental illness obtain
competitive employment. The coordination of mental health services and vocational services is
likely a key factor in the success of an IPS program.
The studies in this systematic review did not detect differences in quality of life,
self-esteem, or job satisfaction between participants in IPS and conventional VR. However, these
studies were not powered to detect such differences. It is likely that higher rates of employment
would positively influence each of these outcomes, even thought the studies do not give
evidence to support this assumption.
Though this systematic review supports the superiority of IPS to conventional VR, it is
important for researchers to continue to work to improve employment outcomes for adults with
disabilities. Employment rates among the intervention groups are still not as high as they are in
the non-disabled population. The mental health research community needs to conduct
and vocational services. In addition, there might be other mediators of success, such as the
experience of the vocational specialist and the number of contacts that a participant has with a
specialist that influence the success of IPS. Given this body of research, IPS should be the
Table 2. Rate of Any Competitive Employment
Study IPS (%) VR (%) p-value or (95% CI)
Drake, McHugo, Bebout, et al (1999)
60.8 9.2 <0.001
Mueser, Clark, Haines, et al (2004)
75.0 27.5 <0.001
Latimer, Lecomte, Becker, et al (2006)
46.7 18.9 <0.001
Bond, Salyers, Dincin, et al (2007)
75.0 33.7 <0.001
Burns, Catty, Becker, et al (2007)
55.0 28.0 (16.4-37.4)
Howard, Heslin, Leese, et al (2010)
13.0 7.0 0.15
Tsang, Lam, Ng, and Leung (2000)
53.6 7.3 <0.001
Drake, McHugo, Becker, et al (1996)
78.1 40.3 <0.001
Twamley, Narvaez, Becker et al (2008)
Table 3. Days to First Job
Study IPS VR p-value
Drake, McHugo, Bebout, et al (1999)
126 293 <0.01
Mueser, Clark, Haines, et al (2004)
197 219 0.019
Latimer, Lecomte, Becker, et al (2006)
126 153 0.61
Bond, Salyers, Dincin, et al (2007)
156 193 0.20
Twamley, Narvaez, Becker et al (2008)
93 171 0.096
Table 4. Total Hours Worked in Competitive Employment
Study IPS VR p-value or (95% CI)
Drake, McHugo, Bebout, et al (1999)
322 27.6 <0.001
Mueser, Clark, Haines, et al (2004)
373 103 <0.001
Latimer, Lecomte, Becker, et al (2006)
126 73 <0.001
Bond, Salyers, Dincin, et al (2007)
596 285 <0.01
Burns, Catty, Becker, et al (2007)
429 119 (189-434)
Drake, McHugo, Becker, et al (1996)
Table 5. Total Wages Earned in Competitive Employment (in US dollars)
Study IPS VR p-value
Drake, McHugo, Bebout, et al (1999)
1875 154 <0.001
Mueser, Clark, Haines, et al (2004)
2,078 618 <0.001
Latimer, Lecomte, Becker, et al (2006)*
962 521 <0.001
Bond, Salyers, Dincin, et al (2007)
5,034 2,675 <0.001
Drake, McHugo, Becker, et al (1996)
3,394 1,078 0.001
Twamley, Narvaez, Becker et al (2008)
1,964 467 0.02
*Canadian dollars
Table 6. Total Weeks Worked
Study IPS VR p-value
Drake, McHugo, Bebout, et al (1999)
15 1 <0.001
Latimer, Lecomte, Becker, et al (2006)
7 3 0.001
Bond, Salyers, Dincin, et al (2007)
32 16 <0.01
Twamley, Narvaez, Becker et al (2008)
Table 7. Job Tenure (average weeks per job)
Study IPS VR p-value or (95% CI)
Mueser, Clark, Haines, et al (2004)
20.0 4.8 <0.001
Burns, Catty, Becker, et al (2007)
30.5 15.5 (56-155)
Tsang, Lam, Ng, and Leung (2000)
Table 8. Summary of Studies
Study Length of study (months)
Participants Outcomes
Drake R.E., McHugo, G.J., Bebout, R.R. et al (1999)
18 IPS n = 76
VR n = 76
QoL: no difference
Self-esteem: no difference
Job satisfaction: no difference
Mueser, K.T., Clark, R.E., Haines, M. et al (2004)
24 IPS n = 68
VR n = 69
QoL: no difference
Self-esteem: no difference
Job satisfaction: no difference
Latimer, E.A., Lecomte, T., Becker, D.R. et al (2006)
12 IPS n = 75
VR n = 74
QoL: no difference
Self-esteem: group x time interaction favors IPS group (p<0.01)
Bond, G.R., Salyers, M.P., Dincin, J. et al (2007)
24 IPS n = 96
VR n = 98
Job satisfaction: IPS had higher job satisfaction at 2 weeks (p=0.01)
Howard, L.M., Heslin, M., Leese, M. et al (2010)
12 IPS n = 109
VR n = 110
QoL: no difference
Self-esteem: no difference
Job satisfaction: no difference
Drake, R.E., McHugo, G.J., Becker, D.R. et al (1996)
18 IPS n = 74
VR n = 69
QoL: no difference
Self-esteem: no difference
Job satisfaction: no difference
Twamley, E.W., Narvaez, J.M., Becker, D.R. et al (2008)
12 IPS n = 28
VR n = 22
QoL: no difference between groups; however individuals who worked in both groups had