Jason W Richmond. Assessing Attitudes Toward Computers to Measure the
Effectiveness of Computer Instruction. A Master’s Paper for the M.S. in L.S degree. May, 2013. 36 pages. Advisor: Ronald Bergquist
Older adults are using the internet more than ever before for work, information seeking, and recreation. Public libraries have expanded their services to provide free computer and internet access along with instruction in technology. To improve, expand, and justify these programs, libraries need effective assessment techniques. This study surveyed 26 adults attending computer classes at a mid-sized public library using the Attitudes Toward Computers Instrument. Using a pre-test/post-test method the impact of instruction was measured. Participants showed a positive increase in their attitudes on seven of eight measures, both directly after class and one week afterwards. There was no impact on the use of computers. Based on these results future computer classes at this location will emphasize repetition, risk control, formative assessment, and engagement.
Headings:
Public libraries -- Evaluation Computer literacy
ASSESSING ATTITUDES TOWARD COMPUTERS TO MEASURE THE EFFECTIVENESS OF COMPUTER INSTRUCTION
by
Jason W Richmond
A Master’s paper submitted to the faculty of the School of Information and Library Science of the University of North Carolina at Chapel Hill
in partial fulfillment of the requirements
for the degree of Master of Science in Library Science. Chapel Hill, North Carolina
May 2013
Approved by
Table of Contents
Introduction ... 2
Literature Review ... 3
Public Library Computers ... 3
Anxiety ... 5
Andragogy ... 8
Instruction ... 9
Assessment ... 9
Method ... 13
Setting ... 13
Sample ... 13
Study Design... 15
Measure ... 16
Results ... 17
Relative Attitudes ... 18
Impact on Attitude ... 20
Relations between Questions ... 22
Impact on Behavior ... 23
Limitations of the study... 24
Discussion ... 25
Direction for Further Research ... 28
Conclusion ... 30
Bibliography ... 31
Introduction
Libraries are facing an existential crisis. They are navigating troubled financial times while trying to stay abreast of rapidly changing technology and facing competitors to their services. In order to remain relevant to their users, libraries need to explicitly articulate their value to the community and highlight their core strengths. Increasingly, as we continue into the 21st century one of the primary roles of public libraries will be to teach the information literacy skills to as broad a segment of the population as possible. To gain or retain funding for instructional programs libraries will need to show their effectiveness to those that hold the purse strings.
Public libraries need to be able to justify their budgets to secure funding at a time when local governments are facing budget deficits. The traditional role of libraries to provide instruction in using the library’s resources has been expanding to incorporate skills-based classes. One way public libraries are trying to meet the needs of their communities is by providing free computer classes.
Carolina at Chapel Hill Libraries and three local public libraries, provides classes on a variety of topics ranging from computer basics to advanced Excel and social media (http://www.lib.unc.edu/cws/). This breadth of curriculum, typical of public libraries, would require specific assessment tools to be developed for each class with a task oriented approach used at universities. Besides requiring greater effort from the
librarians, who may not be trained in research methods, the task oriented approach also limits the ability to compare results across classes. With standard measurement tools focused on user attitudes public libraries will be able to collect comparable data to use for budget justification and development of new instruction methods.
Literature Review
Public Library Computers
likely grown since (Becker et al. 2010). For many people, the library serves as the only location for free computer access (Becker et al. 2011).
Libraries have invested significant resources in installing computer infrastructure to meet the growing demands of their patrons. Public computers are used by one-third of the United States population over the age of 14. An even greater number, 44% or 77 million Americans, avail themselves of public computers and wireless access. More than three-quarters of those users chose to come to the library even though they had internet access at home, work, or elsewhere. People came to the library “because they did not have access elsewhere, needed faster Internet speed, wanted technical help from a librarian, competed for access to a computer at home, or simply wanted to work
somewhere more peaceful” (Becker et al. 2010, p 2). Patrons surveyed in this study used the internet to fill a broad range of needs such as Social connection (60%), education (42 percent), employment (40 percent), health (37 percent) and government and legal
information (34%).
access for education. On the other end, 54% of older adults over the age of 65 used library computers to gather health information (Becker et al 2010).
Older adults are one of the fastest growing segments of internet users. People over the age of 50 are also an increasing part of the workforce. Computers are being used for work, but also for communication, entertainment, education and seeking health
information. Learning how to use computers allows seniors to gain more independence and benefit from the flourishing provision of online services (Wagner 2010).
A large proportion of the American population is using library computers, but many may be unable to do so. The term “digital divide” was first used by the U.S. Department of Commerce in the late 90s in a series of reports looking at
telecommunications and internet access. The divide is the gap between those that can use a certain technology and those that cannot. It is not limited simply to access to computers and the internet. Digital divides are manifold, and arise with the introduction of each new technology. Nor are they limited to owning hardware as “new divides exist in terms of available Internet bandwidth, quality of computer equipment, and the ability of users to successfully navigate the Internet to accomplish their goals” (Becker et al. 2010,
emphasis added, p. 15). In short, users must have physical access and the necessary skills to be able to benefit from technology.
Anxiety
Libraries have developed many instruction programs to complement their
people how to use specific programs but also how to search and evaluate the flood of information available on the internet (Becker et al 2011). Assistance is an important part of patron’s use of library computers. A 2013 Pew study on library services found that “some 36% of those who had ever visited a library say the library staff had helped them use a computer or the internet at a library” (Zickuhr, Rainie & Purcell, p. 7). In
recognition of the importance of training, over 90% of American public libraries offer some level of training. However, only 32 percent of rural libraries versus 63% of urban libraries offer formal instruction (Hoffman, Bertot & Davis 2012).
Offering classes and providing access to computers may not be enough to reach people in need of those services. Anxiety, of both the library itself and computers may be a barrier to people seeking help. Library anxiety has been defined as “negative emotions including tension, fear, feelings of uncertainty and helplessness, negative self-defeating thoughts, and mental disorganization, all of which have the propensity to debilitate information literacy” (Jiao & Onwuegbuzie 1997). Bostick (1993) identified five
contributing factors to library anxiety: barriers with staff, affective barriers, comfort with the library, knowledge of the library, and mechanical barriers. Barriers due to interaction with staff were the most predictive factors of library anxiety. Examples of barriers include viewing staff as intimidating or too busy to help, perhaps owing to negative past encounters. To counteract anxiety, librarians should strive to be friendly and accessible to provide people with positive encounters and instruction in the library should focus on affective characteristics in addition to gaining skills (Jiao & Onwuegbuzie 1997).
mildly uncomfortable to exhibiting more pronounced physical reactions like sweaty palms and heart palpitations. The research is mixed on whether computer experience influences anxiety or if anxiety is present regardless of levels of experience. However, “individuals who have taken more computer classes and frequently use a computer are less likely to be members of the anxious, computerphobic type” (Marcoulides 2009, p. 693). This may be due to the effect of experience lessening anxiety or the result of individuals with less anxiety to begin with simply using computers more. Feelings of anxiety have been connected with negative early experiences with computers (Quinn, 2000). If computer novices feel a lack of control during their first exposure to computers, they are likely to have a sustained negative effect on the person’s views of computers. A friendly and helpful instructor has been found to have the opposite, and be able to create long lasting positive views of computers (Beckers 2003).
influence the other attitude. Informing someone that increased use of cell phones is hazardous would cause a reduction in their view of the benefits of cell phones, and vice-versa. Adults that have early negative experiences with computers would be expected to have a lower opinion of computers’ benefits to them.
Andragogy
Andragogy is a growing field focused on the instruction of adults, as opposed to the theories of pedagogy that were developed to teach children. Adult learners are defined as those that have assumed adult roles in society and have responsibilities outside of education (Gold 2005). This can include everyone from an18 year-old that dropped out of high school and is pursuing a GED while working to a 70 year-old retiree coming to the library for help with email. Andragogy works on the view that “adult learner are self-directed, they possess life experience that informs their learning, they possess a desire to actively participate in the learning process, their learning needs to be relevant to their lives, and they are highly motivated to learn” (Cooke 2010, p. 208). There can be many additional barriers for adult learners to overcome to seek educational opportunities. These may include limitations on time due to other responsibilities, limitations on physical access if they live away from educational institutions, and prejudices formed by negative past experiences (Gold 2005).
computers on the dimensions of comfort, competence, and control (Czaja & Sharit 1998). Negative attitudes can reinforce each other, creating a greater obstacle for older
individuals to overcome to become familiar with new technology.
Instruction
Instructional techniques, drawing from andragogical precepts, can help adult learners cope with existing anxieties and form more positive views of computers. Instruction should focus on immediacy and engagement. Adults want to learn skills that are immediately relevant to them and their lives. Classes should actively involve the students, allowing them to gain experience using a computer (Gold 2005). Pacing is important to keep the students engaged. Instructors need to watch the students’ progress to make sure the material being covered is at an appropriate level and repeat instructions as often as necessary (Quinn 2000). Older adults prefer to attend small, formal classes to introduce a topic but individual, informal assistance as needed after the initial class (Ruthven 2010). Taking account of adult’s preferences and meeting their desired learning outcomes can provide them with the positive educational experiences to build lasting positive attitudes.
Assessment
Assessment should be a critical component of any library program. Systematic assessment can be used to “increase student learning…respond to calls for
assessed to align its function to the library’s overarching strategic goals (Sobel & Sugimoto 2012).
The library setting poses challenges to assessing instruction. Students come with a wide background knowledge of skills (Dunaway 2010). Unlike traditional academic subjects, there is no formal, structured library curriculum that students progress through learning ever more advanced skills. When instruction is part of a multi-class unit, students will often misjudge their own skill level, underestimating their experience and attending unnecessary introductory classes or overestimating their skills and attending advanced classes they are not ready for (Tacheva 2008). In such cases, testing specific skills will return a wide range regardless of the quality of the instruction. Single session instruction meanwhile places constraints on the assessment methods available. Instructors may not be able to measure outcomes and durable impacts of the students if they are unable to administer an assessment after the class.
While both academic and public libraries have been adopting a more instructional role, academic libraries dominate the professional literature on best practices for classes. A broad analysis of the literature on library instruction done in 2007 found a total of 791 articles searching in the ERIC database for “library instruction” and “college or academic libraries.” As expected due to their methodology, the study found that the journals with the most articles on instruction are those closely associated with academic libraries like Research Strategies, College and Research Libraries, and Journal of Academic
evaluate academic instruction sessions (Oakleaf 2009, Archambault 2011). No similar standard exists for public libraries.
In a nationwide survey of instruction librarians at academic institutions, Sobel and Sugimoto (2012) found that while most respondents conducted assessment, they spent less than 10% of their time on the activity. Most librarians taught themselves how to do assessment, with less than 20% of respondents having learned in it their MLS program. A majority of respondents reported a lack of confidence in their ability to conduct statistical analysis on their assessment results. This is indicative of the lack of standard tools and practices in the profession. Walsh’s 2010 review of over 100 articles found ten forms of assessment “including analysis of bibliographies, essays, final grades, multiple choice tests, questionnaires, observation, portfolios, tests, self-assessment, and simulations” (as cited in Sobel & Sugimoto 2012, p 192). Many currently used assessment practices have been characterized as simply surveys of satisfaction that fail to measure actual student learning (Sobel & Sugimoto 2012, Tacheva 2008). The assessment tools being used have often been developed for the specific population being tested and many have not been statistically validated. A lack of baseline measures prevents the comparison of new results to gauge improvement (Sobel & Sugimoto 2012).
been created based off the work of Aizen and Fishbein. Shaft, Sharfman and Wu (2004) found 31 in a survey of existing measures. The Attitudes Toward Computers Instrument (ATCI) was created in response to be short, less complex, generally applicable, and stable over time to correct for perceived weaknesses in the other measures. This test is used in the current study as the aforementioned traits were suited to handle the broad
demographics of public library patrons.
Effective assessment of library instruction can aid the library in its meeting its strategic goals. The IMLS funded study Opportunity for All: How Library Policies and Practices Impact Public Internet Access reported a gap between what libraries were assessing and what funding authorities wanted to see (Becker et al. 2011). Libraries collect input and output data: how many books circulate, how many people attend a program, how many reference questions are asked, etc. Few collect data on the quality of the programs and the impact on the patrons which could be used to evaluate the
Method
Setting
The study was conducted at the Orange County Main Library in Hillsborough, North Carolina. This is a medium size library serving both the town and the county as a whole, covering a total of 133,801 people as of 2011. The county includes a population with a larger median income, higher percentage of adults with Bachelor’s degree, and lower unemployment rates than state and national averages. However, it also has a higher than average percentage residents in poverty. These demographics may be explained by the nearby major research universities. The county is predominantly white (70.5%) with a smaller black and Hispanic population than average (Chow, 2013).
Supported by the University of North Carolina at Chapel Hill Libraries the Community Workshop Series (CWS) offers computer education classes to three local public libraries using a common curriculum and teaching strategy lead by volunteers. In the spring of 2012, using a Library Services and Technology Act grant, the Orange County Main Library purchased 6 laptop computers and inaugurated their own computer instruction administered by an intern. This study was administered to assess the
effectiveness of this new program.
Sample
Twenty-six people attending the nine computer classes held from October 2012 to February 2013 participated in the study out
of a total attendance of thirty-four. Of the total number of attendees, 67% consented to participate, fully 92% of those that took the
Respondents Response rate Attendees 39
Pre test 26 33.33%
Post test 24 92.31%
Follow up 17 65.38%
pre-test also took the post-test, and 65% of participants returned their follow-up
questionnaire. Overall participation rate was higher than expected, but encouragingly for future research, it could have been even greater. All of the attendees asked agreed to participate, but the participation rate was decreased due to the high number of individuals that would arrive to the classes late, after the questionnaire had been administered and instruction had begun. It was determined to forego collecting their information in the interest of not interrupting instruction for the class as a whole.
No demographic data was collected on the questionnaires in the interest of protecting privacy and to ensure anonymity. Due to the expected small sample size, demographics such as race could have been used to identify respondents without
providing enough data points to run valid statistical tests. From observation, most of the attendees ranged in age from 35-65 and were predominantly white females. Attendance by minorities was minimal, with only one Hispanic and two black participants. Many participants came to a series of classes and were asked to complete a consent and
questionnaire for each session. The number of unique individuals reached for the class is unknown.
Between October 22, 2012 and February 18, 2013, nine classes were surveyed. These ranged from computer and internet basics to more advanced topics like social media. A breakdown of the classes and their attendance can be seen in Table X. The basics classes had higher attendance so composed the bulk of the surveys collected. Each class ran for an hour and a half on Monday evenings.
Study Design
Hypothesis: Can an instrument measuring attitudes towards computers be used assess the effectiveness and durable impact of computer instruction classes?
Operational Definitions
Attitudes: Positive or negative as dependent on responses to 8 questions of the Attitudes Towards Computers Instrument.
Effectiveness: A statistical significance of .05 for measures in changes of attitude in a positive direction between the pre-test and post-test.
Durable impact: A statistical significance of .05 for measures in changes of attitude in a positive direction between the pre-test and follow-up.
Participants: All the library patrons that attended a computer class and consented to the study.
Between October 22, 2012 and February 18, 2013, nine library computer classes were surveyed. Classes were held on Monday evenings for an hour and a half from 6:00pm to 7:30pm. A pre-class, post-class, and one week follow-up survey of computer attitudes was administered during the regularly scheduled classes. The study used the Attitudes Towards Computers Instrument which was assessed for reliability by Shaft et al (2003) using data collected from 176 undergraduate students.
Prior to the start of instruction, attendees were informed of the details of the research to be conducted. This introduction included a description of the study’s purpose and what would be required of participants. Attendees were asked to participate after an explanation that the study was voluntary with no direct benefit to participants and
Explanation of the study procedure, acquiring consent, and completion of the pre-test took between 5 to 10 minutes of the beginning of each class. The post-class survey was completed at the end of instruction. Before leaving participants were reminded to fill out and return the follow-up survey in one week. A self-addressed stamped envelope was included with the questionnaire to increase response rate. A period of one week was chosen, though shorter than the 4 to 10 weeks of some comparable academic library studies (Wong et al 2006, Swoger 2011). Due to the number of participants that attended consecutive classes, a week time frame measured the durability of any impact from one class separate from later sessions. This also allows for the data collected from serial attendees with one time students as they will all be exposed to the same treatment within the time frame of each data collection period.
Measure
The Attitudes Towards Computers Instrument (ATCI), validated by Shaft et al (2003) was picked as a general assessment tool. See Appendix for example. Pre-tests and post-tests have been used in academic libraries to assess the effectiveness of their
instruction sessions (Sobel & Sugimoto 2012, Archambault 2011, Swogger 2009). Prior studies on attitudes towards computers of adults after computer instruction have used the Attitudes Towards Computers Questionnaire (Jay and Willis 1992, Segrist 2004). The ATCQ is a 35 to 40 question tool that measures attitudes across the
controlled by computers” (Jay and Willis 1992, p. 257) that could prime participants against computers before the start of instruction. Shaft, Sharfman, and Wilfred (2004) found 31 different instruments that have been created to measure attitudes computers since the 1980s. The ATCI was developed to be short, simple, and applicable to a broad range of settings. Due to the public library setting, with limited time and varied
demographics, the ATCI was chosen for this study. However, since it has not been administered directly in a public library, this study tested whether the ATCI is discriminating enough to measure the impact of instruction on the attitudes towards computers of participants.
Results
For each question, average scores between tests were compared using a Wilcoxon non-parametric test. No statistical significance was found in the differences between the means for any questions or for the total scores. The difference on the scores for Question 1 between the pre-test and the post-test was the closest to being significant with p = .0627. Refer to Table 2 for the aspects of attitude each question measures. The hypothesis that the ATCI could be used to measure effectiveness and durable impact significantly must be rejected for this sample. Although the results lacked statistical significance due to the small sample size,
there were clear trends that emerged to support the positive influence of computer classes on attitudes that can be seen in Table 3. These results are in line with Segrist’s (2004) study of 30 older adults
Q1 Enhance/Restrain Creativity Q2 Helpful/Harmful
Q3 Enjoyable/Frustrating to Use Q4 Intriguing/Boring
Q5 Sound Investment/Waste of Money Q6 Easy/Difficult to Use
Q7 Threatening/Non-threatening Q8 Increase/Decrease Productivity
that found significance on the measure of comfort but positive movement on comfort, efficacy, gender equity, control, interest, and utility.
Relative Attitudes
The average scores for each test were above the middle score for the
questionnaire of 28 out of possible 56, which indicates a generally positive attitude towards computers. On the 7 point scale used on the measurement instrument, an answer of 4 is a neutral response. The lowest average scores were on the pre-test: 3.85, 4.0 and 4.38. Before any instruction, participants’ most negative views were still neutral or only slightly negative.
From that baseline, average total scores follow a trajectory that fits for the
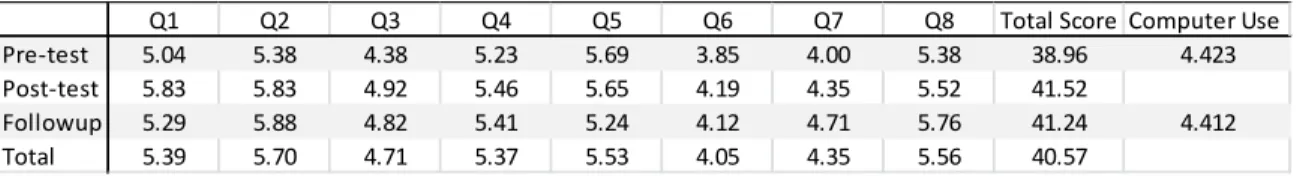
students receiving a benefit from the classes. Scores rise from the pre-test to the post-test by 6.6% as a result of the instruction. On all but one of the questions, scores were higher after the post-test than they had been on the pre-test. The only intervening variable between the questionnaires had been the instruction. Scores did drop from the post-test to the follow-up by less than 1%. Five of the questions remained stable, changing by less than 2% over the course of the week, suggesting a durable impact on attitudes. While scores did drop on six measures between the post-test and follow-up, the average score increased by 5.8% from the pre-test to follow-up, with an average score increase on seven of the eight questions. There was no change (<1%) in the number of times participants used a computer in a past week before and after the instruction. On a more granular level,
Q1 Q2 Q3 Q4 Q5 Q6 Q7 Q8 Total Score Computer Use
Pre-test 5.04 5.38 4.38 5.23 5.69 3.85 4.00 5.38 38.96 4.423
Post-test 5.83 5.83 4.92 5.46 5.65 4.19 4.35 5.52 41.52
Followup 5.29 5.88 4.82 5.41 5.24 4.12 4.71 5.76 41.24 4.412
Total 5.39 5.70 4.71 5.37 5.53 4.05 4.35 5.56 40.57
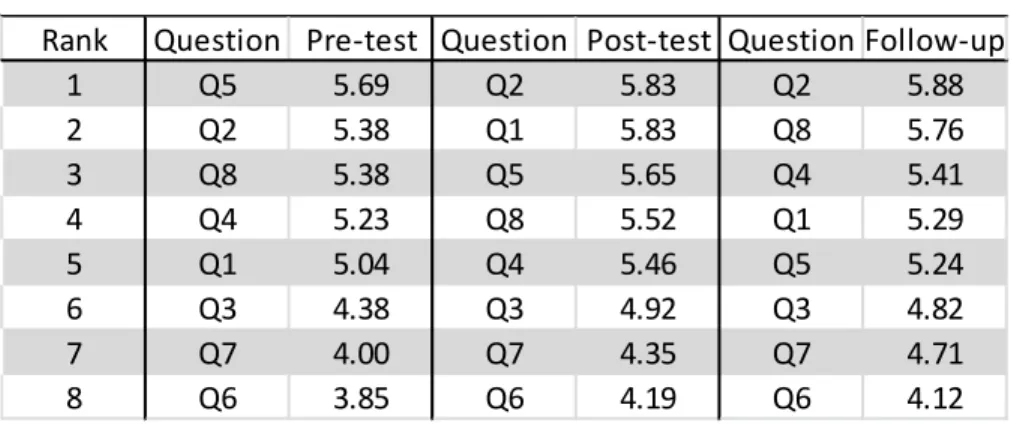
we can look at which questions, and the attitudes they represent, where the post positive on each questionnaire.
Pre-test Attitudes
Table 5 shows the question scores ranked highest to lowest by test. On the pre-test Q5 (5.69) had the highest score followed by a tie between Q2 and Q8 (5.38). Participants, before instruction, felt that computers were a sound investment, and also helpful and productive, relative to other views. The lowest scores were on Q7 (4.0), and Q6 (3.85), the lowest reported score on all the tests). As mentioned above, these scores came closest to having an overall negative valence. Participants felt that computers were threatening and difficult to use, relative to other measures.
Post-test Attitudes
After instruction, participants general felt better about computers, but their relative feelings had changed from the pre-test. The highest scores on the post-test were for Q1 and Q2, both tied at 5.83. Participants still viewed computers as helpful, but also considered them to be an aide for creativity. The lowest scores were still Q7 (4.35) and
Q1 Q2 Q3 Q4 Q5 Q6 Q7 Q8 Total Score Use
pre/post 15.8% 8.3% 12.1% 4.4% -0.7% 8.9% 8.9% 2.5% 6.6%
post/flw -9.2% 0.8% -1.9% -0.9% -7.4% -1.7% 8.1% 4.4% -0.7%
pre/flw 5.1% 9.2% 10.0% 3.5% -8.0% 7.1% 17.6% 7.1% 5.8% -0.3%
Table 4 Percent Changes between Tests
Rank Question Pre-test Question Post-test Question Follow-up
1 Q5 5.69 Q2 5.83 Q2 5.88
2 Q2 5.38 Q1 5.83 Q8 5.76
3 Q8 5.38 Q5 5.65 Q4 5.41
4 Q4 5.23 Q8 5.52 Q1 5.29
5 Q1 5.04 Q4 5.46 Q5 5.24
6 Q3 4.38 Q3 4.92 Q3 4.82
7 Q7 4.00 Q7 4.35 Q7 4.71
8 Q6 3.85 Q6 4.19 Q6 4.12
Q6 (4.19), which increased but still remained at the bottom of the measures. Both scores though were above the neutral point of 4 and leaning towards positive attitudes.
Follow-up Attitudes
A week after instruction, average scores had dropped for five of the eight
measures. The highest scores were on Q2 (5.88, the highest score of all the tests) and Q8 (5.76), both of which defied the trend and increased in the intervening time. Participants felt even more than before that computers were helpful and also aides to productivity. They still felt that computers were relatively threatening and difficult. As on the previous tests, Q7 (4.71) and Q6 (4.12) remained at the bottom. However, with a final score near 5, most participants felt that computers were, overall, non-threatening. The ranking of the scores accords with previous research by Czaja and Sharit (1998) that found age
negatively affects certain attitudes, such as comfort, competence, and control.
Impact on Attitude
Pre-test
Looking at Table 6 we can gauge what impact we had on particular dimensions of the participant’s attitudes toward computers. The largest increases in scores on the pre-test were for Q1 (15.8%) and Q3 (12.1%). Instruction seemed to be most effective in increasing participants’ attitudes towards the creative and enjoyable aspects of
being the absolute highest on the pre-test. Participants felt more positive about every aspect of computers, except their value, after direct exposure and training.
Post-test
There was a wide spread in the changes in scores from the post-test to the follow-up. Q7 (8.1%) showed the largest increase, on par with increases seen from instruction. Q8 (4.4%) had a smaller increase, but did change even more than it had after instruction. Something in the environment of the participants or their experiences reinforced and continued to increase their gains on these attitudes. Four of the questions (Q2, Q4, Q6, Q3) showed small changes, less than 2 percent positive or negative. Views on those dimensions (helpful/harmful, intriguing/boring, easy/difficult to use, and
enjoyable/frustrating) had sizable changes after the post-test from 4.4% to 12.1%. These attitudes were the most influenced directly by the instruction, and were durable and relatively unaffected by outside experience.
Both Q5 (-7.4%) and Q1 (-9.2%) had noted decreases in scores from the post-test to the follow-up. As people feel more comfortable around computers, they may develop more realistic views of the hardware and what it can and cannot do. This interpretation is stronger for Q5 which showed a decrease across all the tests. Q1 had both the largest
Rank Question Pre-test Question Post-test Question Follow-up
1 Q1 15.8% Q7 8.1% Q7 17.6%
2 Q3 12.1% Q8 4.4% Q3 10.0%
3 Q6 8.9% Q2 0.8% Q2 9.2%
4 Q7 8.9% Q4 -0.9% Q8 7.1%
5 Q2 8.3% Q6 -1.7% Q6 7.1%
6 Q4 4.4% Q3 -1.9% Q1 5.1%
7 Q8 2.5% Q5 -7.4% Q4 3.5%
8 Q5 -0.7% Q1 -9.2% Q5 -8.0%
increase (15.8%) and the largest decrease (-9.2%) of all the measures. From these results, perceptions of creativity are the most volatile attitude.
Follow-up
The changes from the pre-test to the follow-up shows the impact on attitudes after the participants have left the classroom and returned to the world. Even with drops in scores after the post-test, seven of the eight questions remained higher than the initial pre-test score. Q7 had the highest overall increase, at 17.6%, with Q3 (10.0%) in a distant second. Q6, which had the absolute lowest average score on all three tests, had a total increase of 7.1%. These gains were not enough to move the average score from the three lowest across all three tests, but show that the instruction was able to impact areas with the most negative initial outlook.
Q2 showed the third highest percentage increase overall of 9.2%. This measure of helpful/harmful was the highest average score for both the post-test and the follow-up. Q8, increase/decrease productivity also showed gains across all three tests, ended 7.1% higher than the post-test and had the second highest average score (5.76) on the follow-up. Participant’s greatest positive attitude, and consistent increase, was towards
computers perceived benefit to them. This does not fit well with the findings that Q5, sound investment/waste of money, as the only score to decrease on each test and to end lower than it started.
Relations between Questions
helpfulness and how threatening it is and also how intriguing they find computers with how easy they are to use. This accords with research in psychology and decision making on the affect heuristic. We would expect these scores to move together if there is a connection between perceived risk and perceived benefit as found in Alhakami and Slovic’s (1994) study. From these results, it cannot be determined if either score caused the other, but the emphasis on risk reduction in the instruction sessions supports the hypothesis that reducing perceptions of risk helped increase views of benefit. This conclusion is supported by the larger increase in the metric of risk, 17.6% for Q7 and 7.1% for Q6, than the related measure of benefit, 10% for Q4 and 3.5% for Q4. The connection between affective perceptions of risks and benefits may help explain the negative trend in perceptions of monetary value. If considerations of value do not rely as much on affect, it would not be as influenced by the intuitive perception of risk.
Impact on Behavior
Previous research has shown a connection between computer experience and attitudes. This study did not find any increase in computer use after instruction that increases positive attitudes. The average participant used a computer 4.4 times a week before the pre-test and stayed stable at 4.4 uses the week after instruction. However, Garland’s (2007) study of four common computer attitudes scales found that experience was a poor predictor of attitudes. As discussed above, computer skills are only part of the wider issue of computer access. Those participants that were not using computers
beforehand may also face problems getting to the physical hardware.
had an R square value of only 0.024, indicating that some of the questions asked bore little relevance to computer use. Q4, intriguing/boring, had the highest R square value of 0.139. The participants that found computers interesting were the most likely to use them more often.
Limitations of the study
The conclusions drawn from this study must be tempered with the significant limitations of the data collected. The relationships between the pre, post and follow up tests were not statistically significant. While the results point to a positive trend, it is not certain that the data are not the result of random chance. The data also lacks
generalizability due to the sampling method. Participants were a self-selecting group of patrons that are not representative of public library users in general. This was
compounded by the schedule, with classes only on Monday evenings, which precluded attendance for anyone unable to make it at that time. The sample also included many patrons that attended multiple classes which reduced the total number of unique
participants further limiting its representativeness. Multiple-session attendees may also have exhibited testing effects as they remembered what they had entered before. The instructor and the study researcher were often the same which may have also led to skewed results due to efforts to provide answers the participants’ thought the researcher expected. Due to the expected small number of classes and participants, a more thorough Solomon’s four group or similar research design. Finally, a follow-up test after one week prevents the collection of data on long term durability of attitude changes.
the study design approximates the setting in which practicing librarians would be using the questionnaires. The results do not apply to public library patrons throughout the nation, but they do tell the instructors about the particular patrons they are trying to teach. A high number of repeat participants demonstrates the versatility of the instrument. If the testing or researcher effect was high, the results would have skewed more to the extreme answers than analysis of answer distributions showed.
Discussion
Story of a Computer Class Patron
Keeping in mind the limitations mentioned above, strong claims cannot be made about computer class attendees in general, but the data does suggest several trends about one particular population that can inform practices and show the program’s value. A common aspect of libraries today is the desire to collect information through community analyses to determine who their users are and what they want. This should not just be limited to demographics and surveys. As we all learn in reference interviews, people do not always know what they want to ask, or know what they don’t know. Using data such as that collected here allows us to tell a story about who our users are and what their needs are. This narrative can enable us to create programs to meet their needs and provide us the means to advocate for the resources to implement those programs.
instruction class, she feels better about computers overall, especially that they are helpful and can enhance her creativity. In particular, the class improved her view of computers’ creative potential and how fun they can be. She rushed home after the late evening class to eat dinner and move back into her normal routine. For the rest of her week she uses computers the same as she always has, but when she reflects on how she feels about them before going to the next class, she feels more positive towards them. Computers may be a bit overpriced, but they are not as threatening or difficult to use as she once thought. In fact, they can be helpful and more efficient than doing things by hand, even if they are not all that enjoyable to use yet.
What Instructors Can Do
Using the data from this study incorporated with recommendations from the literature on andragogy and library instruction, there are several recommendations for improved computer classes.
Repetition: Patrons are already encouraged to attend multiple classes throughout the series. However, as the difficulty increases the number of attendees, and repeat participants, drops off. The library does not have the resources to offer more classes during the week, but more introductory skills classes will be offered each month to provide extra practice. This will reinforce the positive impacts of prior classes, perhaps limiting the diminishing impact of instruction, and provide attendees with a greater sense of control and self-efficacy before attempting more complicated tasks.
Engagement: Future classes will focus on hands on exercises and practice as recommended by Wang (2006). The instructor will stop and start over if students are just watching and not following along on their own computers. This creates an environment less like a traditional classroom which can increase anxiety.
Formative Assessment: Additions to the pre-test questionnaire will be added to gauge the participants’ skills prior to instruction as recommended by Dunaway (2011). This will allow the instructor to cover topics appropriate to the skill levels of the majority of the class. Current practice is to solicit information through conversation before
instruction, which has proved unsatisfactory as patrons may feel embarrassed to admit their ignorance to the group. Discussion of the pre-tests findings can downplay the evaluative aspect of the test, which has been connected with eliciting anxiety (Quinn 2000).
Make it Fun and Interesting: Attitudes were not strongly linked to computer use overall but whether a participant found computers intriguing or not was the best predictor of the weekly use of computers. Emphasizing the enjoyable aspects of computers, instead of just their functionality, can increase their affect, their use, and reduce their perception of risk.
Reporting to Stakeholders
While free to attend, computer classes are not free to hold. They require a
The data shows that participants had a positive increase in their attitudes toward computers. Beyond just looking at the number of people that showed up, these results show how much people were helped. Converting those numbers into a narrative makes the results more relatable, puts a face on the statistics. A 6% increase in attitudes may not impress, but a double digit percent change in perceptions of threat and enjoyment speaks more strongly to the library’s mission. Large investments have been made at virtually all public libraries to provide internet and public computer access. Those resources are wasted for patrons that are too intimidated to use the technology. Computer instruction can bridge the divide, helping enabling equal access to all the information and services the library provides. Instruction should be an ongoing commitment however, and not a one-time program. These results show that after just a week there is decline in five measures of attitudes toward computers. Continued classes are required to reinforce the benefits already accrued.
Systematic assessment can also be used to attract grants and other funding. With the push for greater accountability, organizations that distribute funds require more information about its use and impact. A library with data on how much it changes attitudes will be able to measure the further influence of new initiatives.
Direction for Further Research
The ATCI was sensitive enough to measure differences between pre and post-tests, but more data needs to be collected to establish a baseline for comparison. Consistent use of measures such as this would allow libraries to experiment with new instruction
experts could have a large impact on the influence of instruction classes. However, a means tested approach would allow libraries to pick the very best program for their users.
The relation between perceptions of economic value and other dimensions of attitudes should be investigated more. There are many plausible explanations for the decrease in perceptions of value in this study. Perhaps as people become more familiar with computers a veneer of magic is replaced with a more realistic evaluation.
Understanding this relationship may give librarians a deeper understanding of how to argue for the value of their programs. An analogy can be drawn between the participants in this study that felt computers we worth less even as they appreciated them more with public library patrons as a whole that have positive views of libraries but may not be willing to fund them.
Conclusion
This study attempted to determine the effectiveness of measuring the
effectiveness of computer instruction classes through the use of the ATCI. It found no statistically significant change, but the data collected did show a positive increase in attitudes after participants attended a class.
The participants showed an increase in attitudes towards computers for each class. An overall increase of 5% and an increase in each question bar one points towards a
measurably positive impact on attitudes on computers. The largest change was a
Bibliography
Ajzen, I., & Fishbein, M. (1977). Attitude-behavior relations: A theoretical analysis and review of empirical research. Psychological Bulletin, 84(5), 888–918.
Archambault, S. G. (2011). Evidence Based Library and Information Practice. Evidence based Library and Information Practice, 6(4), 88–106.
Ashcroft, L., Farrow, J., & Watts, C. (2007). Public libraries and adult learners. Library Management, 28(3), 125–138. doi:10.1108/01435120710727974
Becker, S., Crandall M., Fisher, K., Kinney, B., Landry, C., & Rocha, A. (2010). Opportunity for All: How the American Public Benefits from Internet Access at U.S. Libraries. (IMLS-2010-RES-01). Institute of Museum and Library
Services. Washington, D.C. Retrieved from
http://impact.ischool.washington.edu/documents/OPP4ALL_FinalReport.pdf
Becker, S., Crandall, M., Fisher, K., Blakewood, R., Kinney, B., Russell-Sauvé, C., (2011). Opportunity for All: How Library Policies and Practices Impact Public Internet Access. Institute of Museum and Library Services, Washington, D.C. Retrieved from http://tascha.washington.edu/usimpact
Beckers, J., & Schmidt, H. (2003). Computer experience and computer anxiety. Computers in Human Behavior, 19(6), 785–797. doi:10.1016/S0747-5632(03)00005-0
Bostick, S. L. (1993). The development and validation of the Library Anxiety Scale. In M. E. Murfin, & J. B. Whitlatch (Eds.), Research in reference effectiveness. RASD occasional papers (No. 16, pp. 1–7).Chicago, IL: American Library Association.
Chow, A. S. (2013). Orange County Libraries community needs analysis final report. Orange County Public Library. Hillsborough, NC.
Crawford, A., & Feldt, J.(2000). An Analysis of the literature on instruction in academic libraries. Reference and User Services Quarterly,46(3), 77-87.
Bibliography Continued
Cooke, N. (2010). Becoming an andragogical librarian: Using library instruction as a tool to combat library anxiety and empower adult learners. New Review of Academic Librarianship, 16(2), 208–227. doi:10.1080/13614533.2010.507388
Czaja, S. J., & Sharit, J. (1998). Age differences in attitudes toward computers. The Journal of Gerontology, 53B(5), 329–340.
DeRosa, C., Cantrell, J., Carlson, M., & Gallagher, P. (2010). Perceptions of libraries, 2010: Context and community. Online Computer Library Center. Dublin, Ohio. Dunaway, M. K., & Orblych, M. T. (2011). Formative assessment: Transforming
information literacy instruction. Reference Services Review, 39(1), 24–41. doi:10.1108/00907321111108097
Garland, K., & Noyes, J. (2008). Computer attitude scales: How relevant today? Computers in Human Behavior, 24, 563–575. doi:10.1016/j.chb.2007.02.005 Gold, H. E. (2005). Engaging the adult learner: Creating effective library instruction.
Libraries and the Academy, 5(4), 467–481. doi:10.1353/pla.2005.0051 Hoffman, J., Bertot, J., & Davis, D. (2012). Libraries connect communities: Public
library funding & technology access study 2011-2012. American Libraries. Retrieved from http://viewer.zmags.com/publication/4673a369.
Institute for Museum and Library Services. (2000). Perspectives on outcome based evaluation for libraries and museums. Washington, D.C.: IMLS.
Institute for Museum and Library Services. (2001). New directives, new directions: Documenting outcomes in IMLS grants to libraries and museums. Washington, D.C.: IMLS. Retrieved from
http://www.imls.gov/grants/current/crnt_obebasics.htm.
Jay, G. M., & Willis, S. L. (1992). Influence of direct computer experience on older adult’s attitudes towards computers. Journal of Gerontology, 47(4), 250–257. Jiao, Q., & Onwuegbuzie, A. (1997). Antecedents of library anxiety. The Library
Quarterly, 67(4), 372–389. Retrieved from http://www.jstor.org/stable/10.2307/40039590
Lagana, L. (2008). Enhancing the attitudes and self-efficacy of older adults toward computers and the Internet: Results of a pilot study. Educational gerontology, 34, 831–843. doi:10.1080/03601270802243713
Bibliography Continued
Oakleaf, M. (2012). Are they learning?? Are we?? Learning outcomes and the academic library. The Library Quarterly. 81(1), 61-82.
Oakleaf, M., & Kaske, N. (2009). Guiding questions for assessing information literacy in higher education, Libraries and the Academy, 9 (2), 273–286.
Quinn, B. (2000). Overcoming technostress in reference services to adult learners. The Reference Librarian, 33(69-70), 49–62. Retrieved from
http://www.tandfonline.com/doi/abs/10.1300/J120v33n69_05
Ruthven, J. (2010). Training needs and preferences of adult public library clients in the use of online resources. The Australian Library Journal, 108–118.
Segrist, K. (2004). Attitudes of older adults toward a computer training program. Educational Gerontology, 30(7), 563–571. doi:10.1080/03601270490466958 Shaft, T. M., Sharfman, M. P., & Wu, W. W. (2004). Reliability assessment of the
attitude towards computers instrument (ATCI). Computers in Human Behavior, 20(5), 661–689. doi:10.1016/j.chb.2003.10.021
Slovic, P., Finucane, M. L., Peters, E., & MacGregor, D. G. (2007). The affect heuristic. European Journal of Operational Research, 177(3), 1333–1352.
doi:10.1016/j.ejor.2005.04.006
Sobel, K., & Sugimoto, C. R. (2012). Assessment of learning during library instruction: Practices,pPrevalence, and preparation. The Journal of Academic Librarianship, 38(4), 191–204. doi:10.1016/j.acalib.2012.04.004
Swoger, B. J. M. (2011). Closing the assessment loop using pre- and post-assessment. Reference Services Review, 39(2), 244–259. doi:10.1108/00907321111135475 Wagner, N., Hassanein, K., & Head, M. (2010). Computer use by older adults: A
multi-disciplinary review. Computers in Human Behavior, 26(5), 870–882. doi:10.1016/j.chb.2010.03.029
Walsh, A. (2009). Information literacy assessment: Where do we start? Journal of Librarianship and Information Science, 41 (1), 19–28. Retrieved from http://lis.sagepub.com/cgi/doi/10.1177/ 0961000608099896
Wong, G., Chan, D., & Chu, S. (2006). Assessing the enduring impact of library instruction programs. The Journal of Academic Librarianship, 32(4), 384–395. Zickuhr, K., Rainie, L., & Purcell, K. (2013). Library services in the digital age. Pew
Research Center. Washington, DC. Retrieved from