1
Abstract
Recent trends show that species are undergoing a widespread shift in the timing of life
history events in accordance with global climate change. Butterflies typify this effect because they are ectothermic, and therefore sensitive to changes in temperature. Multiple studies indicate
that spring appearance dates in butterflies have been occurring earlier with rising temperatures. However, these trends have not been extensively studied for the southeastern United States, a geographically diverse region that has experienced a less dramatic change in temperatures
compared to that seen on a global scale. In this study, we examined changes in the date of first spring appearance between 1990 and 2014 for 65 butterfly species using a database of butterfly
observations made in North Carolina. We also examined changes in the date of first appearance at the regional level by comparing the mountains, the Piedmont and the coastal regions for relative differences. Finally, we explored whether certain species-specific traits play a role in the
relative changes of first flight date. Model averaging indicated that there was a trend of earlier first appearance dates over time, with an average advance of 0.6 days for each year and 3.8 days
for each 1°C rise in mean temperature. There was no significant difference in the advancement of first flight date between North Carolina’s three main geographical regions. Overwintering stage
and voltinism appear to be important factors for determining how North Carolina butterfly
species shift their first flight dates in response to year and temperature. These results point to potential further significant shifts in butterfly arrival date as temperatures are projected to rise in
2
Introduction
Mounting recent evidence indicates that species are undergoing significant changes in
seasonal ti𝑚ing and distribution on a global scale in response to climatic change (Walther et al.
2002, Parmesan and Yohe 2003). While species can have varied responses to changing temperatures due to variation in physiology and range, a number of distinct patterns have
emerged. Firstly, species have generally shifted their ranges both towards the poles and upwards in elevation (Parmesan et al. 1999). Secondly, spring events have advanced, largely occurring
earlier over time (Parmesan and Yohe 2003). These patterns have repercussions for individual fitness, community interactions, and the continued persistence of certain species (reviewed in Parmesan 2006, Møller et al. 2008). Therefore, as global temperatures rise as a result of climate
change, it is increasingly crucial to study the consequences of changes in temperature on seasonal timing and biological processes.
Spring phenology is an informative measure for examining how species respond to changing temperatures, and is consequently used in numerous reports of climate change response (IPCC 2007, Parmesan 2007). Butterflies are a useful model organism for studying changes in
spring phenology because they have predictable and readily observable life events (Roy et al. 2001). As ectotherms, they are also sensitive to changes in temperature (Pollard et al. 1993). As
temperatures have increased, the date of first spring emergence has advanced in many butterfly species observed in England (Diamond et al. 2011; Roy and Sparks 2000), California (Forister and Shapiro 2003), Ohio (Diamond et al. 2014), and the Mediterranean Basin (Stefanescu et al.
2003).
Many traits are involved in shaping ectotherm’s response to changing temperatures. For
3 overwintering stage, geographic range, and the breadth and composition of the larval diet
(Diamond et al. 2011). Examining diet breadth as an indicator of seasonal timing changes can be
complex because host plants are also undergoing temporal changes as a result of climate change (Visser and Holleman 2001). However, studying phenology and diet breadth can give insight
into how mutualistic relationships will be affected as a result of climate change. For example, species with a narrow diet breadth may be more susceptible to changes in seasonal timing than those with a broad diet breadth because their range and phenology is dependent on a limited
number of plant species (Diamond et al. 2011). Additionally, species that primarily feed on woody plants may experience a more drastic shift in life cycle events because the leaves of
woody plants are only palatable during the early spring (Altermatt 2010a).
While there have been multiple studies of changes in butterfly spring phenology from around the globe (Roy and Sparks 2000, Forister and Shapiro 2003, Stefanescu et al. 2003,
Diamond et al. 2011), the study of this phenomenon in the southeastern United States is in its nascent stages (Moore 2014, unpublished). This region is noteworthy because it has not
experienced the same upwards trend in temperature generally observed on a global scale. Rather, the southeastern US experienced a slight cooling trend over the 20th century (Portmann et al. 2009). This designates the southeastern US as a climatically unique region with the potential for
less drastic changes in first flight date in butterflies compared to the regions that have been previously studied.
In this project, we use a database of butterfly observations collected throughout North Carolina to determine whether butterflies shifted their spring appearance dates across the whole state, and how temperature possibly plays a role in these shifts. We also examine this at the
4 Mountains, the Piedmont, and the Coastal Plain- in order to understand whether there is a
localized influence on changes in phenology in North Carolina butterflies, as these three regions
are different in elevation and in the length of the growing season. In light of the potential biases presented by data gathered by citizen science, we test the robustness of different proxies for first
flight date prior to analysis. Finally, we also explore how species-specific traits relate to changes in first appearance dates in North Carolina butterflies, focusing on voltinism, overwintering stage, diet breadth, and diet composition. When examining voltinism, we expect those species
with higher voltinism to experience a greater advance in first flight date because warming has been shown to be associated with an increase in the number of generations per year in butterflies
(Altermatt 2010b). We hypothesize that species which overwinter as adults will experience a greater advance because the adults are more mobile, and may more readily respond to
temperature changes. We expect butterflies with a narrower larval diet breadth to have a greater
advance in first flight date because they are required to conform to the phenology of their host plants. Finally, we expect those species that feed primarily on woody plants in their larval stage
to experience a greater advance in first flight date because the leaves of woody plants tend to be palatable for a narrow length of time (Altermatt 2010a). Examining a geographically and
climatically diverse region like North Carolina will give further insight into how the local
5
Methods
Dataset
We used observational butterfly sighting data from the Butterflies of North Carolina Atlas (22nd Approximation), a database compiled by Dr. Harry Legrand at the North Carolina
Department of Natural Resources (LeGrand 2015). The database was first created in 1993 and covers North Carolina’s 176 known butterfly species. It has been updated yearly and now
includes 143,000 records from 1938 to 2014.It covers all North Carolina counties, and has good
representation of the Mountain, Piedmont and Coastal Plain regions (LeGrand 2015). Each entry lists the common name, date, observer name, number of individual butterflies observed, and the
county of sighting. We only used data collected from 1990 to 2014, as the large majority of the observations were made in this interval. Within this interval, we also selected those species which had at least 500 entries in the database in order to ensure sufficient data for analysis,
ultimately using 65 butterfly species for analysis. All statistical analyses were performed using R (version 3.2.3).
First flight date
Using the first record of appearance as a proxy for first flight date can be a biased estimate and is heavily subject to outliers and influence by variation in sampling effort or
population size (van Strien et al. 2008). We therefore tested a number of different alternative proxies for date of first flight to determine which was the most robust against differences in
sampling effort for use in the rest of the analyses. These alternative proxies included using the date by which 10% of that year’s individuals had been observed, the date by which 25% of that year’s individuals had been observed, the date on which the 10th individual of that year was
6 were chosen based on a study by van Strien et al. (2008), which used hypothetical data to test the robustness of different estimates of first flight date against bias from sampling effort.
In order to test the different estimates of first flight date, we chose the year with the most records for a particularly abundant species, which was the 2014 data for Pieris rapae, comprising
273 records. In order to examine how first flight date estimates varied with sample size, we randomly sampled the records to create subsamples of the data consisting of 10, 20, 50, 100, 150, 200, and 250 individuals. The first flight date was estimated for each sample using each proxy.
This was done 1000 times and averaged for each subsample to examine how it compared to the best estimate of first flight date, which is the first flight date calculated over the whole year. A
relatively robust estimate of first flight date was indicated by whether the average first flight date determined from smaller subsamples was similar to the best estimate of first flight date, (Figure 1). Based on this test, the date by which 10 percent of the individuals for that year had been
observed was determined to be the most robust against sampling effort, and was used for all subsequent analyses as the proxy for first flight date. For the analyses of the Mountain, Coastal
7
Temperature
For each species, the average month of appearance was determined by averaging the first flight date for each species from 1990 to 2014 (Roy and Sparks 2000). We measured temperature
as the mean temperature for North Carolina averaged over the 8 months prior to the mean arrival month for each species for each year. For the analyses of the Mountains, Coastal Plain, and Piedmont regions, we used the mean temperatures of the all the counties in the region, rather
than the whole state. We chose this eight-month interval because of the importance of winter and
Figure 1: Calculated flight dates using hypothetical subsample of data
and different proxies of first flight date.
Figure 2. The three regions used for analysis. From left
8 spring temperatures in dictating the variation in the timing of insect emergence (Forister and Shapiro 2003, Dell et al. 2005). Temperature data was obtained from the PRISM Climate Group
at Oregon State University.
Phenology analysis
For each species, the change in first appearance date over time was examined using linear regression analysis with year as the covariate. In addition, the change in first appearance date was also examined using linear regression analysis with temperature as the covariate.
Linear regression analysis was also used to examine the relationship between first flight date and both year and temperature as fixed effects within each of the three regions. Of the 65
species, 4 were excluded from the analysis because they were not observed sufficiently in all three regions. We used ANCOVA to compare whether there was overall difference in the changes in first flight date for the remaining 61 species between the Mountains and the Coastal
Plains regions in comparison to the Piedmont.
Species Traits
We examined four species-specific traits as factors: voltinism, diet breadth, diet type, and overwintering stage. Voltinism was defined as the number of generations per year for
populations in North Carolina. Diet breadth was defined as diversity of the larval host plant
species, and comprised four categories: single species, single genus, single family, and
multifamily (Peterson and Denno 1998). Diet type was defined as whether the larvae eat only
woody plants, only herbaceous plants, or a mixture of both (Altermatt 2010). Overwintering stage was reported as whether a species overwinters as larvae, pupae, adults, a mix of larvae and pupae, or a mix of pupae and adults. Species that do not overwinter in North Carolina were not
9 information is uncertain were not included in those respective analyses. Information on
voltinism, diet breadth, diet composition, and overwintering stage were obtained from the
website for Butterflies and Moths of North America (BAMONA), and from the 22nd Approximation of Butterflies of North Carolina (Table 1).
First flight date was tested as a response to species-specific variables using both linear and mixed-effects models in R, using first flight date as the response variable and species as a random effect. Year, temperature, overwintering stage, voltinism, diet breadth, diet type, and the
interaction term between either year or temperature and all the species traits were used as predictor variables. Mixed-effects models were analyzed using the nlme package in R (Pinheiro
et al. 2015). Model averaging was also performed on our full model using the MuMIn package in R (Barton 2015) and the non-conditional results for the full model averaging were examined.
Results
Phenology analysis
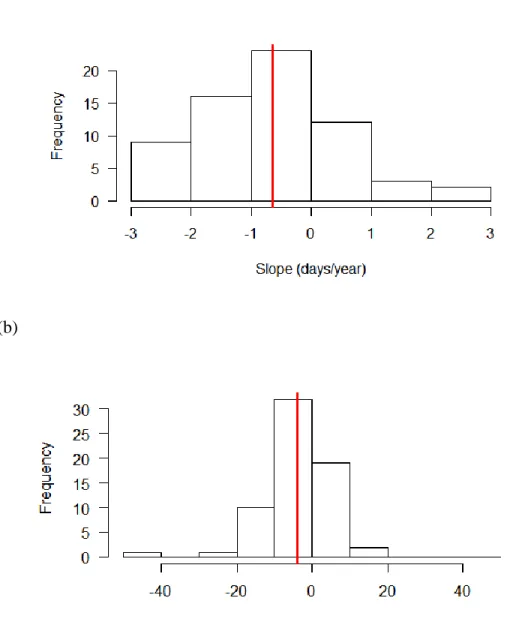
Between 1990 and 2014, 18 out of the 65 species tested experienced a significant
correlation between first flight date and year. Of those 18 species, 3 had a positive relationship between first flight date and year, and the remaining 15 had a negative relationship (Figure 3a). Overall there were 48 negative and 17 positive slopes, a much higher proportion of negative
slopes than the expected equality (binomial test, p<0.0001).
Using temperature as the predictor variable, 9 out of the 65 species tested experienced a
significant correlation between first flight date and temperature. Of those 9 species, 7 had a negative relationship and 2 had a positive relationship (Fig. 3b). Out of the 65 species, there were 44 negative slopes and 21 positive slopes, again a much higher proportion of negative slopes
10
Phenology analysis- regions
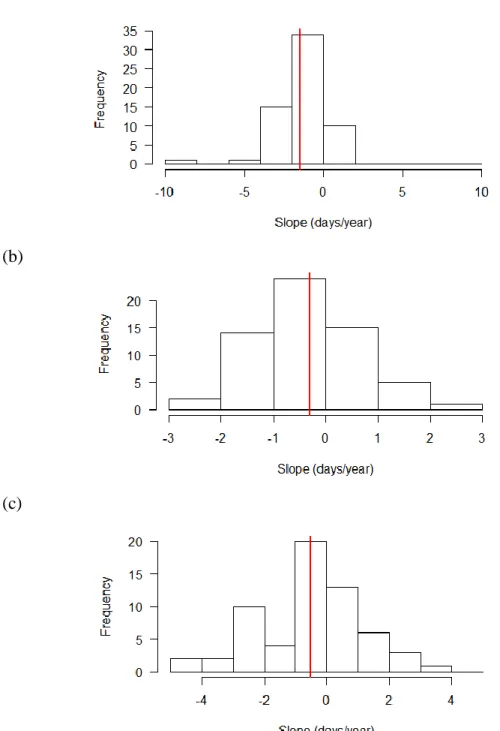
For first flight date versus year, 11 of the 61 species had a significantly different slope
when comparing the Mountains and the Piedmont, all of which were smaller in the Mountains (ANCOVA). When comparing the Coastal Plain and the Piedmont, 7 of the 61 species had a
significantly different slope, 6 of which were smaller in the Coastal Plain. Histograms of the slopes for all three regions are unimodal with a negative slope occurring in the majority of the species. (Figure 4).
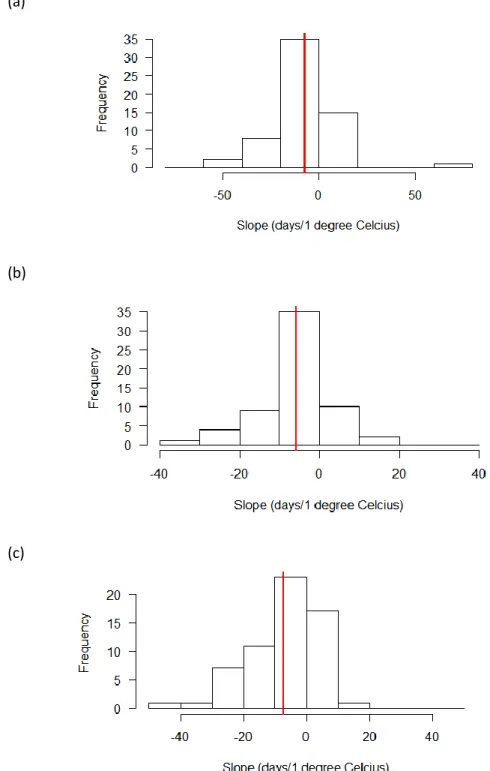
For the date of first flight versus temperature, 4 of the 61 species had a significantly different slope when comparing the Mountains and the Piedmont, 3 of which were smaller in the
Mountains (ANCOVA). When comparing the Coastal Plain and the Piedmont, 2 of the 61 species had a significantly different slope, both of which were smaller in the coast. Again, histograms of the slopes for all three regions are unimodal with a negative slope occurring in the
majority of the species (Figure 5).
Species Traits
From an ANOVA on the linear model, first flight date varied strongly by diet type, such that species that feed on woody plants and mixed woody and herbaceous plants tend to appear earlier than those that feed only on woody plants (ANOVA, p=0.0192, Figure 6, Table 2). First
flight date also varied very strongly by voltinism (ANOVA, p=0.0041, Figure 6, Table 2). There was also a strong interaction between overwintering stage and temperature, suggesting that the
first flight date for species of different overwintering stages changes differently as temperatures increase (ANOVA, p<0.0001, Table 2) as well as a strong interaction between voltinism and year, indicating that the first flight date changes differently over the years for species of different
11 Using model averaging on the full model, the interaction variable between temperature and overwintering stage was significant, with species that overwinter as either pupae and larvae
experiencing a less dramatic change in first flight date relative to those that overwinter as adults as temperatures increase (p<0.001). Overwintering stage, voltinism, the interaction between
overwintering stage and temperature, and the interaction term between voltinism and year were important in 100% (35/35) of the models tested. Diet type was important in 75% (26/35) of the models tested.
Discussion
The results of the state-wide phenology analyses are consistent with trends in
advancement of first flight date in butterflies, as demonstrated by previous studies of long-term butterfly data (Diamond et al. 2011; Roy and Sparks 2000, Forister and Shapiro 2003, Stefanescu
et al. 2003), and with a well-established trend of the influence of temperature on insect spring phenology (Forister and Shapiro 2003, Dell et al. 2005). In the regional data, only a very small
proportion of the species tested experienced significantly different changes in first flight date between the three regions. Overall, there did not appear to be any significant differences in the changes in first flight date between the three regions.
When testing the importance of species-specific traits in determining first flight date using model averaging, only the interaction between overwintering stage and temperature was
significant. Namely, species that overwinter as adults tended to experience a greater advance in date of first flight as temperatures rise compared to species that overwinter as either pupae or larvae. This aligns with a similar study conducted in the UK, which found that species with more
12 warmed, likely because more advanced overwintering stages can easily respond to changes in spring temperature (Diamond et al. 2011). Although only the interaction between overwintering
stage and temperature was significant, overwintering stage, voltinism, and the interaction between year and voltinism were important in 100% of the models tested, suggesting that these
traits are also potentially important in determining changes in first flight date between species. There are many potential biases from working with data generated by citizen science. For example, sampling effort was highly variable between species, years, and regions. Although the
proxy analysis sought to minimize the effect of sampling bias, there may have been an effect between regions, where sampling effort tended to be greater in the Piedmont than in either the
Coastal Plain or the Mountains. In addition, it is possible that observers were more likely to go out to observe butterflies when temperatures were warmer, possibly influencing when butterflies were first sighted in a year.
North Carolina is part of a region of the US that has experienced a warming pattern that is atypical compared to the rest of the world. This region- sometimes termed the “warming hole”- describes a region of the southeast where changes in temperature have not increased
uniformly as they have globally (Folland et al. 2002, Portmann et al. 2009). This may have repercussions on the strength of the correlation between first flight date and year parameters in
this analysis, as butterflies in North Carolina have not experienced a warming trend for as long as most other regions. It is noteworthy, however, that a greater number of species experienced a
strong negative correlation when year was used as covariant in comparison to when temperature was used as a covariant. This is unusual because the relationship between higher temperatures and earlier flight dates is well-established, and it would be expected that temperature would have
13 studies on this dataset it would be informative to look at different ways of approximating
temperature- such as using only maximum temperatures- as well looking at the effects of
precipitation.
Despite the unique climate patterns experienced by North Carolina average temperatures
in the southeastern US are projected to climb (US Global Change Research Program 2014). This analysis therefore points to the potential for continued changes in first flight date as temperatures continue to warm. This could have repercussions for survival at both the individual and species
level (reviewed in Parmesan 2006, Møller et al. 2008). For example, changes in temperature have the potential to cause temporal mismatches between butterflies and their plant hosts (Visser
and Holleman 2001). That is, if a butterfly experiences a phenological shift that differs from that of its host plant, the larvae may hatch at a time when the host plant is unpalatable, with
repercussions for survival (reviewed in van Asch and Visser 2006).
To further strengthen the study of changes in phenology and abundance of butterflies in North Carolina, future studies would implement an official long term monitoring scheme in
North Carolina in order to address the issues of working with archived citizen science data.
Acknowledgements
Thank you to Dr. Allen Hurlbert, Dr. Joel Kingsolver, Kate Augustine, Dr. Jessica Higgins, and
Elizabeth Moore for their essential insight and patient guidance with analyses. Also thank you to Kati Moore, whose initial work with this data in 2014 informed much of this project. The data
14
References
Altermatt F. (2010a) Tell me what you eat and I’ll tell you when you fly: diet can predict
phenological changes in response to climate change. Ecology Letters, 13(12):1475–1484. Altermatt, F. (2010b) Climatic warming increases voltinism in European butterflies and moths.
Proceedings of the Royal Society B, 1685:1281–1287.
van Asch, M., Visser, M.E. (2007) Phenology of forest caterpillars and their host trees: the importance of synchrony. Annual Review of Entemology, 52:37-55.
Kamil Barton (2016). MuMIn: Multi-Model Inference. R package version 1.15.6. https://CRAN.R-project.org/package=MuMIn
Berry, L., Burkett, V., Murley, J.F., Obeysekera, J., Schramm, P.J., Wear, D. (2014) Southeast Regional Report retrieved from
http://nca2014.globalchange.gov/report/regions/southeast.
Dell, D., Sparks, T.H., Dennis, R.L.H. (2005) Climate change and the effect of increasing spring temperatures on emergence dates of the butterfly Apatura iris (Lepidoptera:
Nymphalidae). European Journal of Entomolgy, 102:161–167.
Diamond, S.E., Frame, A.M., Martin, R.A., Buckley, L.B. (2011) Species’ traits predict phenological responses to climate change in butterflies. Ecology, 92(5):1005–1012. Diamond, S.E., Cayton, H., Wepprich, T., Jenkins, C.N., Dunn, R.R., Haddad, N.M., Ries, L.
(2014) Unexpected phenological responses of butterflies to the interaction of urbanization and geographic temperature. Ecology, 95(9):2613-2621.
Folland, C.K., Karl, T.R., Salinger, M.J. (2002) Observed climate variability and change. Weather, 57(8):269–278.
Forister, M.L., Shapiro A.M. (2003) Climatic trends and advancing spring flight of butterflies in lowland California. Global Change Biology, 9(7):1130–1135.
IPCC (Intergovernmental Panel on Climate Change). 2007. Climate change 2007: impacts, adaptation and vulnerability. WMO (World Meteorological Organization) and UNEP (United Nations Environment Programme),Geneva, Switzerland.
LeGrand, H.E. (2015, March) Butterflies of North Carolina, Twenty-second Approximation retrieved from https://leplog.files.wordpress.com/2015/03/butterflies-of-north-carolina- twenty-second-approximation.pdf.
Møller, A.P., Rubolini, D., Lehikoinen, E. (2008) Populations of migratory bird species that did not show a phenological response to climate change are declining. PNAS,
105(42):16195–16200.
Moore, K. (2014) First flight date changes in Southeastern butterflies since 1990. Unpublished. Parmesan C. (2006) Ecological and Evolutionary responses to recent climate change. Annual
15 Parmesan C. (2007) Influences of species, latitudes and methodologies on estimates of
phenological response to global warming. Global Change Biology, 13(9):1860–1872. Parmesan, C., Ryrholm, N., Stefanescu, C. et al. (1999) Poleward shifts in geographical ranges
of butterfly species associated with regional warming. Nature, 399:579-583.
Parmesan, C., Yohe, G. (2003) A globally coherent fingerprint of climate change impacts across natural systems. Nature, 421:37-42.
Peterson, M.A., Denno, R.F. (1998) The influence of dispersal and diet breadth on patterns of genetic isolation by distance in phytophagous insects. The American Naturalist, 152:428– 446.
Pinheiro J, Bates D, DebRoy S, Sarkar D and R Core Team (2015). _nlme: Linear and Nonlinear Mixed Effects Models_. R package version 3.1-122, <URL:
http://CRAN.R.project.org/package=nlme>.
Pollard, E., Van Swaay, C.A.M., Yates, T.J. (1993) Changes in butterfly numbers in Britain and The Netherlands, 1990–91. Ecological Entomology, 18(1):93–94.
Portmann, R.W., Solomon, S., Hegerl, G.C. (2009) Spatial and seasonal patterns in climate change, temperatures, and precipitation across the United States. Proceedings of the National Academy of Sciences USA, 106(18): 7324–7329.
PRISM Climate Group, Oregon State University, http://prism.oregonstate.edu, created 4 Feb 2004.
R Core Team (2015). R: A language and environment for statistical computing. R Foundation for Statistical Computing, Vienna, Austria. URL https://www.R-project.org/.
Roy, D.B., Rothery, P., Moss, D., Pollard, E., Thomas, J.A. (2001) Butterfly numbers and weather: predicting historical trends in abundance and the future effects of climate change. Journal of Animal Ecology, 70(2):201–217.
Roy, D. B., Sparks, T. H. (2000) Phenology of British butterflies and climate change. Global Change Biology, 6(4), 407–416.
Stefanescu, C., Peñuelas, J., Filella, I. (2003) Effects of climatic change on the phenology of butterflies in the northwest Mediterranean Basin Global. Global Change Biology, 9:1494–1506.
van Strien, A. J., Plantenga, W.F., Soldaat, L.L., et al (2008) Bias in phenology assessments based on first appearance data of butterflies. Oecologia, 156:227-235.
Visser, M.E., Holleman, L.J.M. (2001) Warmer springs disrupt the synchrony of oak and winter moth phenology. Proceedings of the Royal Society B, 268(1464):289-294.
16
Tables and Figures
(a)
(b)
Figure 3. Histograms of the distribution of values of the slopes for all 65 species
17 (a)
(b)
(c)
Figure 4. Distribution of the slopes of the linear regression of first flight date vs. year for the 61
18 (a)
(b)
(c)
Figure 5. Distribution of the slopes of the linear regression of first flight date vs. temperature for the 61 species
19
Figure 6. Mean first flight date across voltinism, diet type, diet breadth, and overwintering stage. Under voltinism,
2.5 and 3.5 represents those species that have 2-3 or 3-4 generations per year, respectively. A value of 4 is assigned to species that have 4 or more generations per year. For overwintering stage, the category
20
Table 1: Species and traits used for analysis.
Species Voltinism Diet Type Diet Breadth Overwintering Stage
Abaeis nicippe 3 Both Genus Adults
Achalarus lyciades 2 Herb Family Larvae
Agraulis vanillae 3 Herb Genus Adults
Ancyloxypha numitor 3 Herb Family Larvae
Anthocharis midea 1 Herb Family Pupae
Asterocampa celtis 3 Woody Genus Larvae
Atalopedes campestris 3 Woody Family Adults
Battus philenor 3 Herb Genus Pupae
Boloria bellona 3 Herb Genus Larvae
Callophrys gryneus 2 Woody Species Pupae
Calycopis cecrops 2 Woody Multifamily Pupae/Larvae
Celastrina ladon 1 Both Species Pupae
Celastrina neglecta 3 Both Multifamily Pupae
Cercyonis pegala 1 Herb Family Larvae
Chlosyne nycteis 3 Herb Family Larvae
Colias eurytheme >3 Herb Family Pupae
Colias philodice >3 Herb Family Larvae
21 Erynnis juvenalis Euphyes vestris Euptoieta claudia Eurytides marcellus Hermeuptychia sosybius Hylephila phyleus Junonia coenia Lerema accius Lethe anthedon Lethe appalachia Lethe portlandia Libytheana carinenta Limenitis archippus
23
Table 2: Results of ANOVA of linear model with first flight date as the response variable, species as a random factor, and voltinism, diet type, diet breadth, overwintering stage, and the interaction variables between both year and temperature and all species-specific traits as predictor
variables.
DF F value P-value
Voltinism 5 4.0854 0.0041
Diet Type 2 4.3478 0.0192
Diet Breadth 3 1.2216 0.3137
Overwintering 4 2.4785 0.0585
Year: Voltinism 5 2.9720 0.0133
Year: Diet Type 2 1.0300 0.3573
Year: Diet Breadth 3 0.7655 0.5134 Year: Overwintering 4 1.2931 0.2707
Temp: Voltinism 5 1.3270 0.2500
Temp: Diet Type 2 0.1406 0.8688
24
Supplementary Materials
Table 3: Slopes and p-values for the linear regression of first flight date vs. both year and temperature for each species across the whole state.
Year Temperature
Species slope p-value slope p-value
Abaeis nicippe -0.2900 0.7836 -15.5752 0.1456
Achalarus lyciades -0.5813 0.3228 -12.8021 0.0249
Agraulis vanillae -1.1062 0.0661 0.0456 0.9946
Ancyloxypha numitor -0.2665 0.5719 2.9270 0.5412
Anthocharis midea 0.1591 0.4944 -6.3936 0.0020
Asterocampa celtis -0.2130 0.7539 2.7334 0.6922
Atalopedes campestris 0.0065 0.9906 -4.3869 0.4301
Battus philenor -0.1352 0.9028 -4.0292 0.7379
Boloria bellona -1.5861 0.1541 -22.5171 0.0397
Callophrys gryneus -0.7322 0.4073 2.5890 0.7892
Calycopis cecrops 0.5813 0.7019 -47.2722 0.0004
Celastrina ladon -0.3830 0.3526 1.1575 0.7775
Celastrina neglecta -1.2470 0.0097 -0.5968 0.9115
Cercyonis pegala -0.0161 0.9300 -0.2922 0.8764
Chlosyne nycteis -1.5548 0.0074 3.6093 0.5717
Colias eurytheme -2.2426 0.0228 -15.4179 0.1333
Colias philodice 0.4081 0.6331 -6.7213 0.4233
Cupido comyntas -2.4723 0.0058 -3.3061 0.7479
Cyllopsis gemma -1.3539 0.0764 -0.3296 0.9671
Danaus plexippus 2.3123 0.0427 -1.2614 0.9205
Epargyreus clarus 0.5730 0.4101 -10.5576 0.1249
Erynnis horatius -0.2609 0.7669 -3.2433 0.7354
Erynnis juvenalis 0.0452 0.8035 -4.3130 0.0048
25
Euptoieta claudia -1.4654 0.0317 -0.7723 0.9190
Eurytides marcellus -1.2130 0.0730 -5.0914 0.4588
Hermeuptychia sosybius 0.3626 0.7009 -9.7388 0.3011
Hylephila phyleus 1.0861 0.1036 -5.9961 0.3919
Junonia coenia -0.6431 0.3981 -9.7940 0.2245
Lerema accius -1.4626 0.0003 6.3688 0.1716
Lethe anthedon -1.3735 0.0224 -8.7866 0.1994
Lethe appalachia -1.5733 0.0123 -4.0513 0.5465
Lethe portlandia -0.0404 0.9695 -8.8508 0.4061
Libytheana carinenta 1.0613 0.2397 -1.9331 0.8305
Limenitis archippus -0.1885 0.8113 0.2608 0.9753
Limenitis arthemis astyanax -0.9462 0.2628 6.3030 0.4848
Megisto cymela -1.2100 0.0085 5.2888 0.2892
Nastra lherminier 1.5374 0.0272 -4.9443 0.5067
Nymphalis antiopa -0.7817 0.1083 2.8447 0.6133
Panoquina ocola 0.0852 0.8850 13.8484 0.0343
Papilio glaucus -0.9900 0.3029 0.7615 0.9398
Papilio palamedes 0.3300 0.6583 -14.4923 0.0484
Papilio polyxenes -0.7265 0.2301 -2.0527 0.7406
Papilio troilus -2.3185 0.0179 6.4939 0.5541
Phoebis sennae -2.3415 0.0091 -3.0643 0.7644
Pholisora catullus -1.5217 0.0676 0.7984 0.9271
Phyciodes tharos -2.3100 0.0429 -10.4026 0.4068
Pieris rapae -2.8188 0.0081 -2.1267 0.8532
Poanes zabulon -0.5099 0.4001 -5.9175 0.3702
Polites origenes -0.0998 0.6573 -4.6182 0.0492
Polites vibex 0.3474 0.6128 0.6876 0.9225
26
Polygonia interrogationis -2.0104 0.0940 4.6118 0.7053
Pompeius verna -0.2095 0.7531 -4.9913 0.4901
Pyrgus communis -1.4809 0.2768 -16.1405 0.2427
Pyrisitia lisa 0.4592 0.5882 -17.8584 0.0771
Speyeria cybele -2.3769 0.0015 17.4780 0.0400
Strymon melinus -1.0349 0.1020 -5.2925 0.4534
Thorybes bathyllus -0.2461 0.5821 -6.1970 0.1613
Thorybes pylades -0.4034 0.2857 -5.8933 0.1473
Urbanus proteus -0.8509 0.0817 6.8892 0.2365
Vanessa atalanta -2.5577 0.0094 -4.2410 0.7049
Vanessa cardui -0.1161 0.9395 -12.2094 0.4294
Vanessa virginiensis -1.6723 0.0780 -10.3745 0.3128
Wallengrenia otho 2.0751 0.0126 4.7212 0.6281
Table 4: Results from ANCOVA comparing changes in first flight date by year for each species by region.
Piedmont Mountains Coast p-value of β3
Species slope p-value slope p-value slope p-value
Mountain
vs.
Piedmont
Coast vs.
Piedmont
Abaeis nicippe 0.5949 0.7209 -3.7476 0.0331 0.1243 0.9220 0.0744 0.8237
Achalarus lyciades -0.7737 0.2699 -4.8159 0.0030 -0.5378 0.6326 0.0028 0.8550
Agraulis vanillae -0.7383 0.6958 -2.6888 0.1345 -0.9974 0.0770 0.4214 0.8568
Ancyloxypha numitor -0.3182 0.7221 -1.0652 0.1970 0.9170 0.1817 0.5431 0.2788
Anthocharis midea 0.2332 0.5290 -0.4105 0.4210 -0.5048 0.0936 0.2351 0.0473
27
Atalopedes campestris -0.6038 0.5382 0.7741 0.5596 -0.3126 0.7903 0.3388 0.8323
Battus philenor -0.7767 0.5157 -1.0579 0.4255 -0.2350 0.8681 0.8693 0.7605
Callophrys gryneus -0.5366 0.5952 -9.6972 0.1684 -2.0318 0.2547 0.0364 0.4601
Calycopis cecrops -1.1965 0.3192 0.7091 0.5811 1.6561 0.3224 0.3151 0.1797
Celastrina ladon 0.0909 0.8170 -0.5581 0.2606 0.2049 0.5487 0.2415 0.7825
Celastrina neglecta -1.7905 0.0062 -1.1769 0.1152 -0.6887 0.4350 0.4884 0.2700
Cercyonis pegala -0.0957 0.7774 -0.6561 0.1048 0.7125 0.1883 0.2450 0.1698
Colias eurytheme -2.6482 0.0209 -2.5277 0.0044 -2.7130 0.0349 0.9388 0.9715
Colias philodice 1.6403 0.1001 -1.8626 0.0988 -0.5067 0.8225 0.0149 0.3580
Cupido comyntas -1.2599 0.1855 -1.8138 0.0453 -0.8396 0.3062 0.6596 0.7306
Cyllopsis gemma -1.2704 0.1996 -2.0854 0.1556 -3.3847 0.0372 0.5948 0.2055
Danaus plexippus 2.7599 0.0322 1.4522 0.2502 2.1996 0.3434 0.4462 0.8318
Epargyreus clarus -0.0958 0.9079 -0.2491 0.7353 0.5552 0.6142 0.8927 0.6465
Erynnis horatius 0.5583 0.5330 -1.0287 0.2678 -0.7302 0.3666 0.2134 0.2802
Erynnis juvenalis 0.0316 0.9197 -1.1937 0.0051 -0.3789 0.0998 0.0082 0.1985
Euphyes vestris -0.1378 0.8278 0.3735 0.6006 1.0461 0.2756 0.5926 0.3009
Euptoieta claudia -1.9397 0.0837 -1.2561 0.2951 -0.6874 0.1521 0.6574 0.2431
Eurytides marcellus -0.2174 0.7847 -1.4410 0.3271 -2.3143 0.0447 0.3371 0.0810
Hermeuptychia sosybius 0.5968 0.5957 0.5673 0.6301 0.0139 0.9919 0.9851 0.7385
Hylephila phyleus 0.4733 0.4617 1.3975 0.1827 1.4604 0.0650 0.3750 0.2833
Junonia coenia -0.5109 0.6562 -1.2186 0.3639 -0.5687 0.5198 0.6672 0.9651
Lerema accius -0.3607 0.7228 -0.7325 0.6526 -0.9687 0.0687 0.8100 0.3652
Lethe appalachia -1.6088 0.0546 0.1102 0.9269 -1.0256 0.5153 0.1793 0.6971
Lethe portlandia 0.7243 0.6253 -1.3727 0.7951 -0.8165 0.4685 0.6383 0.3862
Libytheana carinenta 1.2401 0.2839 -3.8857 0.0273 -2.1220 0.1693 0.0074 0.0664
Limenitis archippus 0.9644 0.4346 -1.0462 0.4283 0.6317 0.3399 0.2531 0.7998
Limenitis arthemis
28
Megisto cymela -0.2915 0.4233 -1.2196 0.0066 0.1400 0.8018 0.0673 0.4720
Nastra lherminier 1.2095 0.2558 -2.5822 0.1199 1.8035 0.1492 0.0308 0.7008
Nymphalis antiopa -0.2322 0.6755 -2.2370 0.0064 -3.1079 0.0063 0.0133 0.0077
Panoquina ocola 0.7312 0.2147 -1.2927 0.4415 0.2861 0.6566 0.0973 0.5776
Papilio glaucus 1.3182 0.1414 -2.8808 0.0041 -1.3487 0.0424 0.0009 0.0063
Papilio polyxenes -1.1423 0.2065 -3.1241 0.0035 -1.0787 0.2991 0.1334 0.9629
Papilio troilus -0.5296 0.5827 -1.1983 0.2832 -1.9065 0.0338 0.6197 0.2368
Phoebis sennae -1.5781 0.2905 -1.0300 0.5078 -0.5721 0.5823 0.7818 0.5115
Pholisora catullus -2.2791 0.0372 -0.9884 0.4669 -2.6160 0.0234 0.4446 0.8233
Phyciodes tharos -1.4901 0.1904 -1.5385 0.1505 -2.2935 0.0851 0.9748 0.6404
Pieris rapae 1.1259 0.2497 -3.7335 0.0014 -2.2896 0.0654 0.0005 0.0165
Poanes zabulon -0.5672 0.5064 1.3291 0.2109 -2.9769 0.0083 0.1206 0.0459
Polites origenes -0.0850 0.9182 -1.5429 0.2642 3.3587 0.0016 0.2508 0.0008
Polites vibex 0.2328 0.9108 -1.8571 0.0423 0.3543 0.6434 0.7309 0.9501
Polygonia comma 0.4536 0.6171 -3.9101 0.0025 -4.7374 0.0125 0.0013 0.0049
Polygonia interrogationis -0.8883 0.4011 -0.8091 0.4173 -4.1482 0.0025 0.9574 0.0526
Pompeius verna -0.1848 0.7792 -1.2722 0.0333 2.3921 0.0838 0.2632 0.0838
Pyrgus communis -1.2856 0.4534 -1.4030 0.5280 -2.1309 0.1152 0.9631 0.6613
Pyrisitia lisa -0.9101 0.5476 -1.0273 0.5624 1.7689 0.0518 0.9613 0.1390
Speyeria cybele -0.6818 0.1982 -2.1085 0.0021 0.7360 0.7799 0.0464 0.3591
Strymon melinus -0.1769 0.8289 -1.2711 0.1549 -0.4684 0.6037 0.3413 0.8020
Thorybes bathyllus -1.0010 0.2222 -0.3231 0.8335 -0.5835 0.4074 0.6329 0.6500
Thorybes pylades 0.0524 0.9351 -1.7230 0.0690 0.8020 0.3336 0.0676 0.4173
Urbanus proteus -1.2342 0.2221 -2.0713 0.0652 -0.2552 0.6718 0.6020 0.4168
Vanessa atalanta -1.0474 0.2492 -2.5823 0.0036 -2.0366 0.1170 0.2061 0.5221
Vanessa cardui -1.4543 0.4352 0.3881 0.8117 0.3005 0.9075 0.5020 0.5961
Vanessa virginiensis -0.6700 0.4549 -2.6767 0.0045 -0.8357 0.3454 0.1120 0.8956
29
Table 5: Results from ANCOVA comparing changes in first flight date by temperature for each species by region.
Piedmont Mountains Coast p-value of β3
Species slope p-value slope p-value slope p-value
Mountain vs.
Piedmont
Coast vs.
Piedmont
Abaeis nicippe -15.8281 0.3339 -14.3059 0.4223 -22.3384 0.0668 0.9487 0.7401
Achalarus lyciades -1.8330 0.8485 -7.3066 0.6431 -7.2495 0.5183 0.7088 0.6878
Agraulis vanillae -5.1660 0.7525 -22.9326 0.1955 1.2121 0.8378 0.4247 0.6350
Ancyloxypha
numitor 13.6725 0.1488 -11.1373 0.1728 1.9467 0.7809 0.0501 0.3169
Anthocharis midea -6.3085 0.0694 -1.0615 0.8267 -5.6166 0.0443 0.2925 0.8219
Asterocampa celtis 2.9275 0.7582 4.0714 0.8307 -18.3076 0.3503 0.9436 0.2248
Atalopedes
campestris -1.1447 0.9042 -28.8760 0.0158 -7.6841 0.5114 0.0407 0.6467
Battus philenor -4.5145 0.7081 -4.3542 0.7396 -17.1664 0.2122 0.9925 0.4671
Boloria bellona NA NA NA NA NA NA NA NA
Callophrys gryneus -2.2894 0.8355 -28.2677 0.5749 -9.5358 0.6093 0.3504 0.7293
Calycopis cecrops -28.3902 0.0117 -12.0348 0.2864 -46.2724 0.0028 0.3155 0.3220
Celastrina ladon -5.2693 0.1574 2.8765 0.5521 -4.0864 0.2518 0.1233 0.7602
Celastrina
neglecta -0.7578 0.9136 -6.9354 0.3583 -0.3069 0.9719 0.5310 0.9664
Cercyonis pegala 0.3649 0.9131 -7.3775 0.0697 0.4025 0.9449 0.1094 0.9952
Chlosyne nycteis 7.6262 0.3302 -3.7774 0.5425 -7.2225 NA 0.3022 0.5231
Colias eurytheme -19.8088 0.1027 -11.3620 0.2319 -27.6134 0.0334 0.6160 0.6747
Colias philodice -17.3929 0.0745 0.1920 0.9865 -13.5308 0.5883 0.2059 0.8711
Cupido comyntas -11.2138 0.2634 -1.3693 0.8894 -10.8625 0.1664 0.4677 0.9765
Cyllopsis gemma -0.3160 0.9749 -10.8056 0.4999 1.4410 0.9284 0.5275 0.9196
30
Epargyreus clarus -7.4938 0.3603 -6.2191 0.3883 -6.6475 0.5497 0.9086 0.9523
Erynnis horatius 4.6752 0.6262 -11.2726 0.2382 -3.2426 0.7124 0.2343 0.5394
Erynnis juvenalis -5.4188 0.0906 0.3870 0.9287 -3.9919 0.0632 0.2040 0.5807
Euphyes vestris -4.6787 0.4477 -10.2659 0.1407 9.8612 0.3047 0.5474 0.2040
Euptoieta claudia 0.3231 0.9766 -23.1693 0.0479 -5.3269 0.2767 0.1337 0.6235
Eurytides
marcellus -6.3370 0.4006 9.7079 0.4221 1.0536 0.9303 0.1512 0.5525
Hermeuptychia
sosybius -6.2593 0.5761 -8.2059 0.4567 -24.5449 0.0638 0.8985 0.2755
Hylephila phyleus -6.0674 0.3815 -1.3920 0.8804 -7.9354 0.3360 0.6405 0.8486
Junonia coenia -20.6045 0.0854 -16.6289 0.2187 -17.0233 0.0445 0.8087 0.7763
Lerema accius -0.4671 0.9552 -44.2955 0.0006 0.5510 0.9206 0.0005 0.8898
Lethe anthedon -8.4886 0.1715 -12.9411 0.0423 -106.9816 NA 0.5923 0.0004
Lethe appalachia 9.1254 0.2716 -5.5492 0.6247 -4.7059 0.7543 0.2447 0.3556
Lethe portlandia -19.8367 0.1599 -50.1714 0.0230 -3.1059 0.7838 0.2155 0.3578
Libytheana
carinenta -9.2329 0.4393 2.6550 0.8639 -5.2628 0.7251 0.4974 0.8213
Limenitis
archippus -2.0504 0.8783 -3.9361 0.7823 1.5813 0.8130 0.9209 0.7934
Limenitis arthemis
astyanax 9.6770 0.3033 -3.7925 0.6746 2.2909 0.7703 0.2915 0.5312
Megisto cymela -4.2463 0.3391 0.4594 0.9244 0.5443 0.9230 0.4227 0.4408
Nastra lherminier -9.9032 0.3674 -32.4123 0.0322 1.9544 0.8787 0.1747 0.4783
Nymphalis antiopa -2.4048 0.7323 2.0489 0.8330 -6.5547 0.6192 0.6545 0.7510
Panoquina ocola 3.3908 0.6095 -19.5945 0.1153 6.6861 0.3568 0.0331 0.7259
Papilio glaucus 2.3208 0.8117 -0.8489 0.9407 -3.4832 0.6151 0.8156 0.5559
Papilio palamedes NA NA NA NA NA NA NA NA
31
Papilio troilus -2.4536 0.8025 -4.4870 0.6943 -0.1967 0.9836 0.8827 0.8557
Phoebis sennae -14.3478 0.3355 -12.7047 0.4315 -17.7215 0.0882 0.9349 0.8240
Pholisora catullus 1.9483 0.8542 -22.0344 0.0610 -0.0616 0.9959 0.1407 0.9025
Phyciodes tharos -16.5998 0.1506 -8.5064 0.4354 -21.9984 0.1033 0.6026 0.7546
Pieris rapae -8.6228 0.4102 -3.3939 0.7932 -21.9210 0.0432 0.7218 0.2735
Poanes zabulon -0.9793 0.9100 -23.2993 0.0269 -4.3506 0.7430 0.0687 0.8164
Polites origenes -3.5472 0.6931 -11.0448 0.3894 -22.4948 0.0701 0.5529 0.1211
Polites vibex -20.7855 0.2673 -11.7123 0.1767 2.2027 0.7767 0.8219 0.2061
Polygonia comma -3.4866 0.7322 10.8063 0.4218 -4.7076 0.8073 0.3204 0.9490
Polygonia
interrogationis -5.0318 0.6173 1.8723 0.8429 4.7851 0.7541 0.6254 0.5927
Pompeius verna -6.7852 0.3508 -4.8151 0.4269 9.9582 0.5051 0.8444 0.3023
Pyrgus communis -29.8014 0.1018 -9.5143 0.6613 -3.5810 0.7968 0.4246 0.1921
Pyrisitia lisa -8.2002 0.6369 -38.4817 0.0353 -16.6705 0.1044 0.2580 0.6857
Speyeria cybele -2.9466 0.6581 10.8218 0.1633 17.4931 0.4936 0.1217 0.1866
Strymon melinus -2.4406 0.7669 -11.2529 0.2152 -10.4178 0.2569 0.4477 0.4939
Thorybes bathyllus -2.6404 0.7435 -11.5018 0.2898 -6.9456 0.3274 0.4465 0.6480
Thorybes pylades -1.9086 0.7808 4.9092 0.5889 -19.1607 0.0181 0.4840 0.0487
Urbanus proteus -5.7359 0.5907 2.5116 0.8262 8.2073 0.2235 0.6192 0.2832
Vanessa atalanta -11.3833 0.2575 -5.8261 0.5627 -23.4149 0.0782 0.6820 0.4381
Vanessa cardui -32.6521 0.1019 5.6432 0.7131 -16.9799 0.4429 0.1601 0.6158
Vanessa
virginiensis -18.2184 0.0614 -4.0954 0.7021 -14.8679 0.0890 0.2986 0.7777