82
Using data envelopment analysis (DEA) to improve the sales
performance in Iranian agricultural clusters by utilizing business
networks and business development services providers (BDSPs)
Abdorrahman Haeri
1*, Rouzbeh Ghousi
11
School of Industrial Engineering, Iran University of Science & Technology, Tehran, Iran
[email protected], [email protected]
Abstract
Business clusters play an important role in developing and improving the economic performance of countries and in promoting the welfare of people. Business development service providers (hereafter referred to as, BDSP) have a considerable role in providing specialized services pertinent to the conditions of active enterprises in clusters and in promoting their performance level in order to improve their competitiveness compared to large enterprises. In this study, data envelopment analysis (DEA) was used with respect to three inputs (the number of active networks, active BDSPs, staff in the cluster) and two outputs (the amount of domestic sales and exports). DEA model has been used in order to provide an accurate and comprehensive analysis of the eight agricultural clusters under study while some of the above-mentioned inputs and outputs have been considered. The performance of clusters can be compared together from different aspects and perspectives. For example, domestic sales was considered as the output factor only once, and so was export and, then, the performance of agricultural clusters were compared with each other. It should be noted that the clusters under study are active in terms of the processing of agricultural products, such as gardening products, dates, saffron, tea, and pistachios.
Keywords:data envelopment analysis; agricultural clusters; business development services providers; agricultural products; efficiency evaluation
1-
Introduction
In recent decades, business clusters have played a substantial and significant role in the regional development of many developed and developing countries. This is so because the context of clusters provides the conditions for the development of innovation, entrepreneurship, establishment of new businesses, the increase of productivity of the existing enterprises in the cluster,and the attraction of the outside enterprises into the cluster.
Despite the small size of many active enterprises inclusters, clusters make a significant contribution to the economic development of countries in terms of employment, production,and export. Clusters are not only considered as the backbone of industrial systems (Richard, 2003),but also are considered as a viable path for more rapid development of local small businesses and dealing with their growth constraints.
*Corresponding author.
ISSN: 1735-8272, Copyright c 2016 JISE. All rights reserved Journal of Industrial and Systems Engineering
Vol. 9, No. 3, pp 82-95 Summer (July) 2016
83
Thus, according to the position of clusters in economic development, developing and developed countries have set the project ofcluster development on the agenda (Stejskal & Hajek, 2012). In cluster development programs, the emphasis is placed upon the development of micro and small businesses and the increase of the competitive ability of these units. This can be accomplished via the promotion of networking activities between enterprises, the combination of competition and collaboration to reinforce learning and innovation, and the provision of the required conditions for offering business development services to the enterprises of clusters (Karaev et al., 2007). Business clusters encompass a set of enterprises that have been concentrated in a geographic area. The geographic expansion of a cluster goes up to the point wherein the tacit knowledge at the center of the cluster can flow among entrepreneurs (Anbumozhi et al., 2009). The enterprises of a cluster produce a set of related or supplementary products. This feature, that is, “concentration” makes clusters benefit from external economies (Altenberg & Meyer-Stammer, 1999).Such concentration leads to the creation of related businesses and contributes to the emergence ofspecialized services in technical, managerial,and financial areas (Humphrey & Schmit, 1998).
The enterprises available in clusters face "common opportunities and threats" as a result of concentration and geographic centralization.These common opportunities and threats provide the conditions for inter-firm cooperation among the cluster enterprises, so that "cooperation despite competition" is considered as one of the features of developed clusters (Enright, 2000; Karaev et al., 2007). There are two kinds of links, i.e.vertical and horizontal ones in clusters. In vertical links, different stages or phases of joint production are accomplished in a local complex and an input and output chain is created and the production of a particular commodity is developed. In horizontal links, similar enterprises that are engaged in manufacturing a particular commodity and become to some extent competitor to each other. While they are competing with each other, they also cooperate with each other in many aspects, as well (Maskell, 2001).The majority of enterprises are members of small and medium clusters. Small and medium enterprises are faced with a huge number of constraints due to their structural characteristics(Felzensztein & Gimmon, 2008; De Maeseneire & Claeys, 2012). The small size does not allow these enterprises to extensively make investment in education, technology, quality, research and development, market research, etc. In many cases,these enterprises cannot recruit the staff with the job skills needed to perform the basic activities of the business, such as marketing, accounting, and management. Hence, providing the conditions for offering business development services to small and medium businesses is one of the requirements for this category of enterprises. One of the experts in this area recognizes BDS offering to the enterprises as one of the methods to develop business clusters (Chuluunbaatar et al., 2014).
Business development services are referred to those non-financial services that improve the performance of enterprises, market access, and the organization's ability for competition. Business development services refer to the knowledge transformation, skills, and information and also provision of consultation on various aspects of business activities. Business services that are effective in the development of small industries include the following items:
• Educational services
• Marketing and market recognition
• Providing inputs
• Technology and product development
• Technical and engineering services
• Financial advice
The purpose of providing business development services for small and medium businesses is to increase their competitiveness in confrontation with large-scale industries. Mentoring model is one of the successful models in providing small businesses with business development services. In this way, from the beginning, investment is made to create asmall business and provide the investor with business services in the form of consulting activities, which lie within the range of the definition of feasibility plan, development of business strategy, specification of the roadmap to plan and implement business development programs, and penetrate to the domestic and foreign markets (Peel, 2004).
Micro, small and medium enterprises inherently suffer from some constraints. Thus, economic development policies put more emphasis on endogenous regional development and economic
84
development of business clusters to make these enterprises enabled. It is so because the high failure rate of these enterprises is one of the biggest problems of such businesses despite the key role of enterprises inemployment (Miller et al., 2010). Financial, marketing, and manufacturing constraints are main reasons for the failure of micro, small, and medium enterprises. Such enterprises should resolve their constraints through participation in networking activities and collective actions in order to get enabled (Gilmore et al., 2006).
Micro, small, and medium enterprises can achieve technology-based and marketing skills through networking. Another advantage of networking activities is that they help micro, small, and medium enterprises get exposed to new opportunities, gain knowledge, learn from each other's experience,and benefit from the synergistic effects of common sources (Chetty & Holm, 2000). All such advantages of networking enable micro, small,and medium enterprises to improve their competitive advantage. Thus, development policies emphasize the enhancement of the competitiveness of these businesses through networking and the combination of competition and cooperationin order to solve common problems because of the importance of networking for the development of enterprises, small,and medium enterprises (Karaev et al., 2007). The active enterprises within clusters need both competition and cooperation simultaneously for achieving success in domestic and foreign markets (Mesquita, 2007). There are opportunities for collaboration and networking in the context of business clusters because of the availability of synergistic chances resulting from geographical proximity (Porter, 1990).
Simultaneous availability of competition and cooperation has an important role in the development of business clusters (Karaev et al., 2007). The results of research conducted on business clusters show that inter-firm cooperation among small and medium enterprises leads to the collective efficiency of the cluster activists by reducing communication costs, accelerating innovation and collective learning, quick resolution of problems, and achieving larger markets (Giuliani, 2007). Active networks in clusters reduce the costs related to such activities as education, finance, technology development, product design, marketing, export,and distribution. In the same way, networking can reduce the cost of technical services being provided to members of the network (Thornton et al., 2013).
Inter-firm cooperation has been often emphasized and confirmed as a central feature of successful business clusters. Furthermore, the positive correlation between collaboration and performance promotion of clusters has been proved (McCann & Timothy, 2008).
In other words, collaboration is the means to meet the major challenges; and the higher the collaboration, the higher the ability of business units or clusters in overcoming business challenges. Therefore, the enterprises in the cluster should closely cooperate with each other while competing with each other so that the business cluster can be developed. In conclusion, it will lead to innovation, productivity promotion, and increase of competitiveness of the enterprises in domestic and foreign markets. Hence, the recognition of various methods of inter-firm cooperation and competition is necessary. However, considering the importance of networking activities, management and programming of inter-firm cooperation seems necessary since cooperation and competition often contradict one another in business relations.
The results of several studies suggest that the development of networking activities and business development services leads to the promotion of economic performance of clusters in different ways. For example, Oprime et al. (2011) showed that cooperation and solidarity are vital to cluster development because high level of cooperation between members of the cluster lead to the increase of the level of operational efficiency in them. Networking activities lead to the facilitation of knowledge transformation between enterprises of the cluster and, thereby, innovation network in the cluster will increase (Cui & Wei, 2012). Morosini (2004) also stated that knowledge transformation causes the improvement of economic performance of the cluster. Finally, some of the previous researches focused on the improving efficiency of lands and firms such as Tang et al. (2015).
Some of the previous research used DEA as a performance evaluation tool for different agricultural-related decision making units (DMUs). For instance, Tomaa et al. (2015) applied DEA to assess agriculture performance in 36 counties. In the research CRS and VRS DEA models have been used to obtain technical efficiency score. The results show the considerable difference between counties that have similar factors such as work, land and mechanization level. Janová et al. (2012) applied DEA to forecast bankruptcy of agri businesses. The proposed approach used conditional probabilities
85
estimations and the efficiency scores to predict which DMUs in agriculture filed has the bankruptcy potential. This analysis provides valuable information for investors, governments and policy makers to make the appropriate decisions for firms in agriculture filed. Vlontzos et al. (2014) used non-radial DEA model to evaluate EU countries from the environmental and energy efficiency. Results show that efficiency of countries such as Sweden, Austria and Germany is less that countries like Ireland, Denmark and Belgium. Also it is detected that eastern European countries that utilize low level technology have the less efficiency score.
It is necessary to mention that in the previous researches different DMUs at the heterogeneous levels from corporation to county and country have been investigated for efficiency evaluation. But it is not intended to study agricultural clusters to from the efficiency analysis. In this regard, main contributions of this research are as follows.
• Considering agricultural clusters as DMUs
• Analyzing efficiency level as a capability to utilize inputs to realize the suitable outputs
• Analyzing efficiency for different sets of input and output factors to present to what extent agricultural clusters can utilize a specified set of input factors to produce a determined set of output factors.
In addition, one of the most important issues in economic units of business clusters is the usage of the contexts created in them, such as networks and BDSPs to improve their own performance measures. Despite the importance of this issue, it has not been addressed in previous research. Therefore, this study puts its main focus on evaluating the efficiency of business clusters and agricultural product processing in the field of business networking, business development services providers, and human resources to fulfill domestic sales and exports in clusters. After the introduction, the proposed approach of this research is discussed in section 2. In section 3, the performance of Iranian agricultural clusters in connection with the fulfillment of output factors, including domestic sales and exports will be discussed. Section 4 is devoted to the analysis of the performance of clusters from the perspective of input factors, including networks, BDSPs, and employees. Finally, sections 5 and 6 are dedicated to discussion and conclusion, respectively.
2-
Proposed approach using data envelopment analysis
Each cluster pertaining to the processing of agricultural products utilizes some resources and inputs to achieve the desired outputs. Data envelopment analysis (DEA) is used to evaluate and analyze the capability of clusters in terms of the efficiency of input utilization.
In this regard, decision making units (DMU) areagricultural clusters whose input factors are the number of active business networks, the number of BDSPs, and the number of staff. In addition, the two performance measures, namely domestic sales (in Iran) and exports have been considered as output factors. The previous researches focused only on the tangible factors. Considering business networks and BDSPs as intangible (but important) input factors is one of the contributions of this research. Certainly performance and capability of all business networks and BDSPs are not the same like other input factors such as staff. But “number of staff” is used as an important input factor in many of the researches that applied DEA to evaluate efficiency level. In addition, Iran Small Industries and industrial Parks Organization (ISIPO) applied the promotion and development policies to empower networks and BDSPs. Therefore, it is logical to consider them as the effective entities to increase efficiency level and performance of agricultural clusters from the sales-related criteria. Staff is a major resource to promote sales performance of an agricultural cluster. Its effect has two main aspects. Initially, operational staff help a cluster to produce more products. Then, marketing and sales staff provide the possibility to increase sales level of clusters. To other input factors including “Business networks” and “BDSPs”, promote the contextual requirements and empower agricultural clusters to promote their marketing and sales management capability. One of the major types of business networks is “sales networks” that help clusters to increase amount of sales by implementing different approaches such as cross-selling and up-selling. In addition, BDSPs present management consultancy services about effective marketing and advertising programs. Therefore, it is acceptable to consider “staff”, “business networks” and “BDSPs” as input factors that have the appropriate effect on sales performance of agricultural clusters.
86
The data required for this research have been collected from businessclusters’databases in Iran Small Industries and industrial Parks Organization (ISIPO). The databases are updates by using data of industrial cluster development program. ISIPO has a critical role to set the appropriate policies for industrial cluster development (including agricultural clusters). One of the major concerns in the mentioned program is clusters’ sales either domestic sales of foreign sales (export). Therefore, data of clusters’ sales have been continually monitored, updated and evaluated. The other important issue of clusters is their relationships with the related entities such as networks and BDSPs so that the related data has been updated regularly.
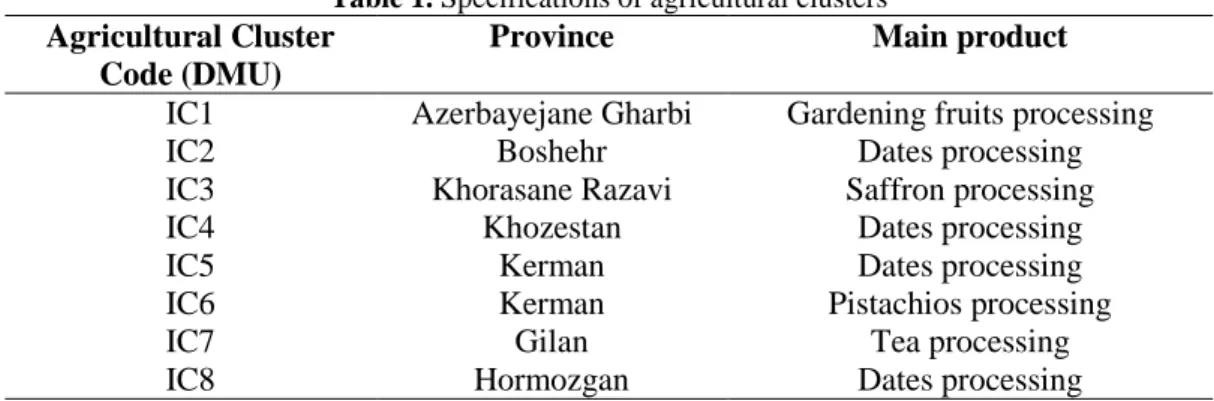
The features of the agricultural clusters in this study are listed in the Table 1. Table 1. Specifications of agricultural clusters
Main product Province
Agricultural Cluster Code (DMU)
Gardening fruits processing Azerbayejane Gharbi
IC1
Dates processing Boshehr
IC2
Saffron processing Khorasane Razavi
IC3
Dates processing Khozestan
IC4
Dates processing Kerman
IC5
Pistachios processing Kerman
IC6
Tea processing Gilan
IC7
Dates processing Hormozgan
IC8
Selection of agricultural clusters is carried out based on two criteria including “product” and “location”. From the “product” perspective, it is intended that clusters are related to the heterogeneous products such as dates, saffron, tea, gardening fruits and pistachios. From the “location” perspective, it is intended that clusters are placed in the different geographical conditions so that Gilan and Azerbayejane Gharbi are placed at North and North West, respectively. Khorasane Razavi is located at North East of Iran. Finally, Boshehr, Hormozgan, Kerman and Khozestan are located at southern region of the country.
In this research, basic data envelopment analysis model has been used to calculate efficiency sores of agricultural clusters. This linear programming model is proposed by Charnes et al. (1978) that is called CCR DEA model. In this model, that there are n Decision Making Units (DMUs) that have m and s input and output factors, respectively. The main variables and parameters of the CCR-DEA model are stated in below.
vi: weight of i-th input ur: weight of r-th output xij: i-th input of j-th DMU yrj: r-th input of j-th DMU esj: efficiency score of j-th DMU
Objective function of the CCR-DEA model is: )
/ max(
1 1
∑
∑
= =
= m
i ij i s
r rj r
j u y vx
es
(1)
Constraints of the CCR-DEA model are stated as follows.
ε
≥
≤ −
∑
∑
= =
i r
m
i ij i s
r rj r
v u
x v y
u ,
0 1
1
(2)
Objective function (equation 1) is equal to the ratio of the two mathematical terms and so is a non-linear programming model. One mathematical constraint (∑
=
= m
i ij ix
v
1
)
1 is added to the above model. Therefore the linear programming mode of the above model is obtained as follows.
87
Objective function of the CCR-DEA model in the linear mode is:
∑
=
= s
r rj r
j u y
es
1
max
(3)
In addition, the constraints of the CCR-DEA model in the linear mode are stated in below.
ε
≥
≤
−
=
∑
∑
∑
= =
=
i r
m
i ij i s
r rj r m
i ij i
v
u
x
v
y
u
x
v
,
0
1
1 1
1
(4)
3-
Results
3-1- Performance analysis ofclustersin terms ofdomestic salesandexports
In this case, the three inputs, namely the number of active networks in the cluster, the number of active BDSPs in the cluster, and the number ofemployees in the cluster and also two output factors, namely domestic sales and exports are considered for theDEA model. The DEA results and efficiency scores (ES) are shown in the Table 2.
Table 2. Efficiency scores of agricultural clusters in terms of domestic sales and exports
Ranking ES
Main product Province
DMU
1 1
Gardening fruits processing Azerbayejane Gharbi
IC1
1 1
Dates processing Boshehr
IC2
1 1
Saffron processing Khorasane Razavi
IC3
2 0.92768
Dates processing Khozestan
IC4
3 0.66334
Tea processing Gilan
IC7
4 0.63515
Dates processing Kerman
IC5
5 0.44072
Pistachios processing Kerman
IC6
6 0.15332
Dates processing Hormozgan
IC8
As shown in the above table, three clusters of IC1, IC2,and IC3 have the maximum ES(1) which means that these clusters efficiently use inputs (the number of active networks in the cluster, the number of active BDSPs in the cluster, and the number of employees in the cluster) to produce outputs (domestic sales and exports). Another interesting point is the difference between the performance of processing clusters of dates so that four processing clusters of dates lie in the ranks1, 2, 4,and 6 and in the efficiency spectrum from1 to 0.15332.
3.2- Performance analysis ofclustersin terms ofdomestic sales
In this state, three inputs (i.e., the number of active networks in the cluster, the number of active BDSPs in the cluster, and the number of employees in the cluster) and one output factor (domestic sales) are considered. The DEA results and efficiency scores (ES) are shown in the Table 3 in below.
88
Table 3. Efficiency scores of agricultural clusters in terms of domestic sales Ranking ES
Main product Province
DMU
1 1
Gardening fruits processing Azerbayejane
Gharbi IC1
1 1
Dates processing Boshehr
IC2
2 0.663343
Tea processing Gilan
IC7
3 0.602929
Dates processing Kerman
IC5
4 0.459272
Saffron processing Khorasane
Razavi IC3
5 0.148419
Dates processing Hormozgan
IC8
6 0.126355
Dates processing Khozestan
IC4
7 7.50E-02
Pistachios processing Kerman
IC6
The above table shows that two clusters of IC1 and IC2 have the efficiency scores of 1. The specific point in the table above is the big difference between the efficient clusters and the second-ranked cluster which has the efficiency score of 0.663343. In total, the clusters under study can be classified in the following four groups in terms of efficiency score with regard to the output factor of domestic sales:
a)The first group: two efficient clusters of IC1 and IC2(ES = 1)
b)The second group:two clusters of IC7 and IC5 whose efficiency scores are 0.663343 and 0.602929, respectively.
c)The third group:IC3whose efficiency score isequal to0.459272.
d)The fourth group: three clusters of IC8, IC4, and IC6 whose efficiency scores are 0.148419, 0.126355,and7.50E-02, respectively.
So far, the cluster pertaining to dates has a wide range of efficiency score (from 1 to 0.126355). 3.3- Performance analysis of clusters in terms of foreign sales (exports)
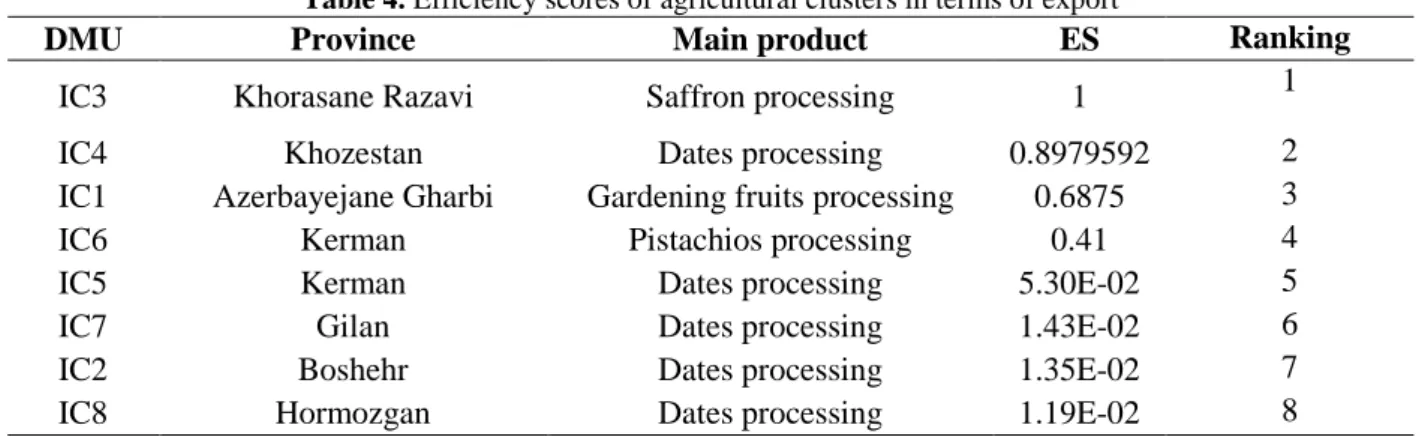
In this state, three inputs (i.e., the number of active networks in the cluster, the number of active BDSPs in the cluster, and the number of employees in the cluster) and one output factor (exports) are considered to evaluate and analyze the efficiency of business clusters. The ranking of business clusters is shownin the Table 4 based on efficiency scores (ES).
Table 4. Efficiency scores of agricultural clusters in terms of export
Ranking ES
Main product Province
DMU
1 1
Saffron processing Khorasane Razavi
IC3
2 0.8979592
Dates processing Khozestan
IC4
3 0.6875
Gardening fruits processing Azerbayejane Gharbi
IC1
4 0.41
Pistachios processing Kerman
IC6
5 5.30E-02
Dates processing Kerman
IC5
6 1.43E-02
Dates processing Gilan
IC7
7 1.35E-02
Dates processing Boshehr
IC2
8 1.19E-02
Dates processing Hormozgan
IC8
The above table shows that IC3 has been the only cluster that efficiently uses inputs to produce the output (exports). The specific point in the above table is that the four clusters of IC5, IC7, IC2,and IC8 have a very low efficiency score (about 0.05 or less). Three clusters out of these four ones are in "processing of dates" business field. Overall, it is shown that most of the clusters in this state have poor performance in terms of the output factor of "exports".
Tables 3 and 4 show the ranking of clusters in terms of ES for the two states wherein "domestic sales" and "exports" have been considered as outputs. In practice,some clusters concentrate more on "domestic sales" and some others concentrate more on"exports". Therefore, it was shown that the index analysis of ES can provide decision-makers and analysts with a desired outlook in both states.
89
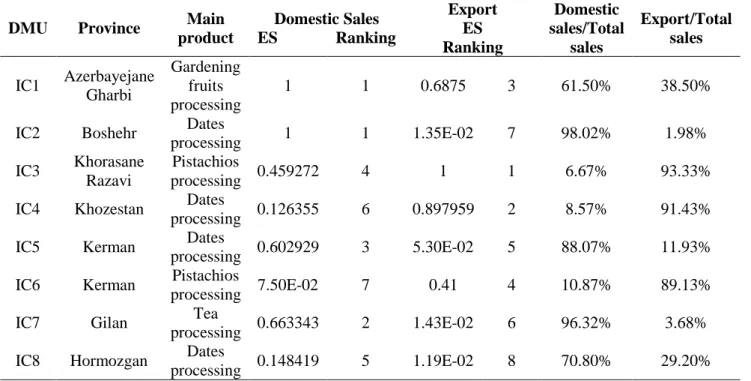
Table 5. Comparison of agricultural clusters in terms of domestic sales and export
Export/Total sales Domestic sales/Total sales Export ES Ranking Domestic Sales
ES Ranking Main product Province DMU 38.50% 61.50% 3 0.6875 1 1 Gardening fruits processing Azerbayejane Gharbi IC1 1.98% 98.02% 7 1.35E-02 1 1 Dates processing Boshehr IC2 93.33% 6.67% 1 1 4 0.459272 Pistachios processing Khorasane Razavi IC3 91.43% 8.57% 2 0.897959 6 0.126355 Dates processing Khozestan IC4 11.93% 88.07% 5 5.30E-02 3 0.602929 Dates processing Kerman IC5 89.13% 10.87% 4 0.41 7 7.50E-02 Pistachios processing Kerman IC6 3.68% 96.32% 6 1.43E-02 2 0.663343 Tea processing Gilan IC7 29.20% 70.80% 8 1.19E-02 5 0.148419 Dates processing Hormozgan IC8
Table 5 contains some interesting findings in connection with the comparison of cluster performance and efficiency score in the two states in which "domestic sales" and"exports" have been considered as performance outputs. These findings are as follows:
A) The state where in"exports" is considered as the output factor.
Three clusters of IC3, IC4,and IC6 take up the highest proportion of"exports to total sales" that are respectively 93.33%, 91.43%, and 89.13% and have obtained ranksof 1, 2,and 4, respectively based on the efficiency scores. Interestingly, cluster IC1 exports approximately 38.50% of its products, lies in the third ranking in terms of efficiency, and outperforms IC6 which exports about 89.13% of its products and lies in the fourth ranking. Although IC8 exports approximately 29.20% of its products, it lies in theeighth (last) ranking and has lower performance compared to IC2, IC5,and IC7 that respectively export 1.98%, 11.93%, and 3.68% of their products.
B) The state wherein"domestic sales" is considered as the output factor.
Three clusters of IC2, IC7,and IC5 take up the ratios of 98.02%, 96.32%, and 88.07%, respectively in terms of the proportion of domestic sales to total sales and lie in the first, second, and third rankings, respectively. Interestingly, the ES index has been obtained equal to one for IC1 although it has dedicated 61.50% of its products to domestic sales. With this respect, IC1 outperforms clusters IC7 and IC5.Another point is that cluster IC3 that sells only 6.67% of its productshas gained the fourth ranking in terms of efficiency and stands above IC4, IC6 and,IC8 which sell 8.57%, 10.87%, and 70.80% of their products, respectively.
Table 2 shows that the three clusters of IC1, IC2,and IC3 have Ess equal to one. The findings of Table 5 shows that the efficiency of two of these three clusters (IC1and IC2) has been obtained equal to one with respect to"domestic sales" as the output factor and the efficiencyof IC3 is equal to one with respect to"exports" asthe outputfactor.
In the next subsections, the ways that clusters benefit from inputs (networksandBDSPs) to provide outputs (domestic sales andexports) is analysed. For this purpose,"networks" and, then, "BDSPs" are considered as input factors.
3.4- Performance analysis of clusters in terms of the utilization of networks
In this state,"networks" is consideredas an input factor and"domestic sales" and "export" are considered as output factors. The ranking of clusters has been shown inTable 6 in terms of ES.
90
Table 6.Efficiency scores of agricultural clusters in terms of the utilization of networks Ranking ES
Main product Province
DMU
1 1
Gardening fruits processing Azerbayejane
Gharbi IC1
1 1
Saffron processing Khorasane Razavi
IC3
2 0.4825732
Dates processing Boshehr
IC2
3 0.3406504
Tea processing Gilan
IC7
4 0.3310445
Pistachios processing Kerman
IC6
5 0.2915215
Dates processing Kerman
IC5
6 0.287614
Dates processing Khozestan
IC4
7 2.63E-02
Dates processing Hormozgan
IC8
Two clusters of IC1and IC3 have gained the ESs equal toone after applying data envelopment analysis (DEA) technique. Interestingly, amongst the clusters that are involved in the processing of dates, IC2 is placed in the third ranking and the other ones (IC5, IC4, and IC8) lie in the last positions (sixth to eighth). Another finding indicates that two clusters of IC5 and IC6, which are both situated in one province (Kerman), have the same conditions in terms of network utilization capability and have the ESs equal to 0.3310445 and 0.2915215, respectively.
3.5- Performance analysis of clusters in terms of the utilization of BDSPs
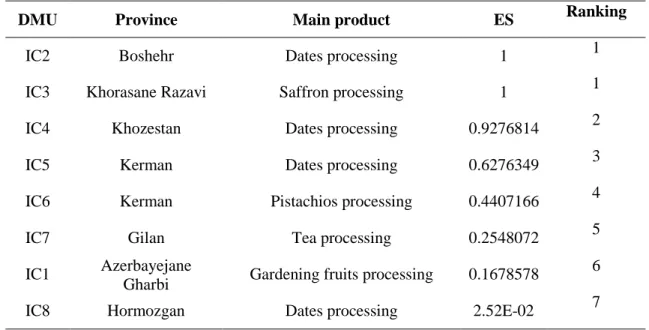
In this state,"BDSPs" is considered as the input factor and "domestic sales" and"exports" are considered as output factors. The ranking of clusters has been shown in the Table 7 in terms of ES.
Table 7.Efficiency scores of agricultural clusters in terms of the utilization of BDSPs Ranking ES
Main product Province
DMU
1 1
Dates processing Boshehr
IC2
1 1
Saffron processing Khorasane Razavi
IC3
2 0.9276814
Dates processing Khozestan
IC4
3 0.6276349
Dates processing Kerman
IC5
4 0.4407166
Pistachios processing Kerman
IC6
5 0.2548072
Tea processing Gilan
IC7
6 0.1678578
Gardening fruits processing Azerbayejane
Gharbi IC1
7 2.52E-02
Dates processing Hormozgan
IC8
The above table shows that IC2 and IC3 have the Ess equal to one. Another finding is that two clusters of IC5 and IC6, which are both situated in one province (Kerman), have the same conditions in terms of network utilization capability in the cluster and have the ESs equal to 0.6276349 and 0.4407166 with the third and fourth rankings, respectively.
Tables 6 and 7 show the ranking of clusters in terms of ES for the two states wherein "networks" and "BDSPs" have been considered as input factors. In practice, it is likely that some clusters utilize "networks" more and some others utilize from"BDSPs" more to achieve domestic sales and exports. Therefore, it was shown that the analysis of ES can provide decision-makers and analysts with a desired insight in both states.
91
Table 8. Comparison of agricultural clusters in terms of the utilization of networks and BDSPs Number of BDSPs Number of networks BDSPs ES Ranking Networks ES Ranking Main product Province DMU 21 1 6 0.167858 1 1 Gardening fruits processing Azerbayejane Gharbi IC1 5 4 1 1 2 0.4825732 Dates processing Boshehr IC2 11 7 1 1 1 1 Saffron processing Khorasane Razavi IC3 1 2 2 0.927681 6 0.287614 Dates processing Khozestan IC4 9 7 3 0.627635 5 0.2915215 Dates processing Kerman IC5 55 44 4 0.440717 4 0.3310445 Pistachios processing Kerman IC6 7 2 5 0.254807 3 0.3406504 Tea processing Gilan IC7 10 3 7 2.52E-02 7 2.63E-02 Dates processing Hormozgan IC8
Table 8 shows that IC3 has acted efficiently in both network and BDSPs utilization capability. This can be accounted for by the fact that the major portion of the products at this cluster is exported and active units in this cluster have higher operational efficiency in network utilization and BDSPs since they have to compete in the global domain. In addition, IC1 has benefited from an active network in it and its ES has been obtained equal to one while that efficient cluster has been unable to utilize BDSPs and it lies in the sixth ranking. IC2 has efficiently benefited from five active BDSPs while it does not efficiently take advantage of the four networks involved in this cluster and is placed in the second ranking (ES=0.4825732). The cluster of IC6 also has the largest number of networks and is very different from the other clusters under study. In terms of network and BDSPs utilization, this cluster has shown an average performance and lies in the fourth ranking. At the end of the table, the performance of cluster IC8 should be taken into consideration because it has shown a very bad performance in both contexts of the usage of networks and BDSPs and lies at the bottom of ranking from both perspectives.
Another point is that such clusters as IC4, IC7,and IC8 are similar in terms of the number of networks with two or three active networks and these clusters show different types of performance in terms of network utilization and have the ESs equal to 0.927681, 0.927681, and 2.52E-02 with the sixth, third, and seventh rankings, respectively. Similarly, two clusters of IC3 and IC5, which both have seven active networks, hold a huge performance difference in terms of network utilization in such a way that IC3 makes efficient use of its seven active networks while the efficiency of IC5 is only equal to0.29 in connection with the usage of networks to provide "domestic sales" and"exports". In the same way, three clusters of IC3, IC5, and IC8 consist of 11, 9, and 10 BDSPs, respectively; however, the efficiency of BDSP utilization is considerably different among them which is equal to 1, 0.627635, and 2.52E-02 with the first, third, and seventh rankings, respectively.
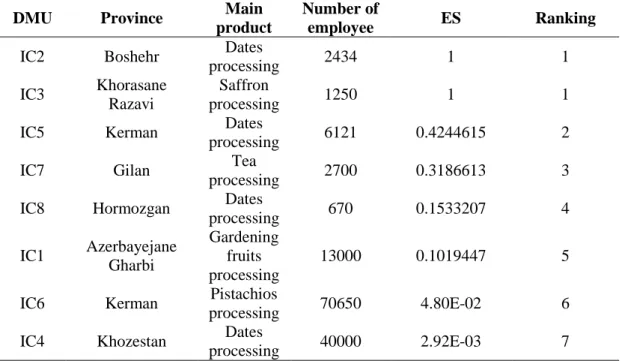
3.6- Performance analysis of clusters in terms of the usage of staff
In this state,"the number of staff" is considered as the input factor and"domestic sales" and"exports" are consideredas output factors in DEA model. The ranking of clustershas been shown in the following table in terms of ES.
92
Table 9.Efficiency scores of agricultural clusters in terms of the utilization of staff Ranking ES
Number of employee Main
product Province
DMU
1 1
2434 Dates
processing Boshehr
IC2
1 1
1250 Saffron
processing Khorasane
Razavi IC3
2 0.4244615
6121 Dates
processing Kerman
IC5
3 0.3186613
2700 Tea
processing Gilan
IC7
4 0.1533207
670 Dates
processing Hormozgan
IC8
5 0.1019447
13000 Gardening
fruits processing Azerbayejane
Gharbi IC1
6 4.80E-02
70650 Pistachios
processing Kerman
IC6
7 2.92E-03
40000 Dates
processing Khozestan
IC4
Table 9 shows that mIC2 and IC3 have acted efficiently in terms of the usage of staff and take the first ranking in this regard. In addition, three clusters of IC1, IC6, and IC4 have the highest number of staff amongst the eight clusters under study and stand in a very poor position in terms of utilization of human resources in such a way that they have taken the three last places in the (table 9). In total, there is a significant difference among the five top clusters and the three bottom clusters in terms of the number of employees. Possibly, the weak structures of human resource management in clusters is the main reason for this difference. Most clusters that have been studied in this research have been composed of a large number of small and micro units. These units do not generally have strong human resource departments and most of them do not even have a systematic approach of performance assessment and compensation. The absence of such organizational systems is not that much tangible when there are a small number of employees in a business. However, the lack of scientific approaches of human resource management about personnel efficiency shows itself more than ever when the number of employees increases. This issue and also the comparison of the efficiency difference among business clusters in terms of human resource utilization have been show in (table 9).
4-
Discussion
In this section, applied analyses about the performance improvement of clusters are discussed. In terms of active networks in business clusters, the application of network development approach (especially active networks in sales) for two clusters of IC1 and IC3 is recommended to lead to the development of performance and an increase in domestic sales and exports of the products of these clusters since these two clusters efficiently use their existing networks. In terms of IC2, IC7, IC6, IC5, and IC4, the efficiency of network utilization is moderate. Here, the sole reliance on the policy of increasing the number of networks is not that much effective since these clusters do not make efficient use of the existing networks. Thus, cluster development approach and improvement of network utilization capability for these clusters are suggested. This leads to the increase of the capability and knowledge of these clusters in order to take advantage of business networks. IC8 lies at a low level in terms of network utilization and the approach of increasing utilization capability from the networks in cluster units is suggested to be used. After the efficiency of current network utilization for this cluster increased at least up to a moderate level, the approach of increasing the number ofnetworks can be also considered.
In terms of BDSP, two efficient clusters of IC2 and IC3 (ES=1) utilize the existing BDSPs and so does IC4 with an approximate optimal efficiency (ES = 0.9276814). Therefore, the approach of
93
increasing the number of BDSPs is suggested to be used for these clusters. Given that these clusters efficiently utilize their BDSPs, the conditions for the increase of domestic sales and exports in these clusters are provided. For clusters IC5, IC6, IC7, and IC1, the approach of improving communications with BDSPs can be used as the first priority to enhance the ability of using their services since these clusters do not efficiently utilize BDSPs. As the second priority, the approach of increasing the number of BDSPs can be considered for these clusters. In terms of cluster IC8, since its efficiency score is very low (ES = 2.52E-02), efforts should be focused on the development of the cluster connections with BDSPs and on the provision of the conditions to create the capability of receiving specialized services of BDSPs. In addition, it is possible to assign credit to the approach of BDSP movement so that the additional BDSPs in clusters of IC5, IC6, IC7, IC1, and IC8 whose services are not effectively used can be moved to clusters of IC2, IC3, and IC4 that appropriately use the specialized services of BDSPs.
In terms of using human resources, clusters IC2 and IC3 efficiently utilize their current human resources; therefore, the maintenance of capacity of human resources and, if necessary, the recruitment of competent personnel are appropriate approaches for thesetwo clusters. In the case of clusters of IC5, IC7, IC8, and IC1, the improvement of human resource management systems, such as training, performance assessment,and incentive programsis required. In addition, if necessary, it is possible to take steps towards limited recruitment. In terms of IC4, the re-engineering of human resource management processes is an unavoidable requirement in order to bring about a significant change towards increasing the utilization capability of human resources and improving their performance.
5-
Conclusion
The application of business development services (BDS) by business clusters and also the increase of the number of active networks in clusters lead to the generation of synergies and promotion of cooperation between active enterprises in clusters, which finally results in the improvement of their performance. In this research, the calculation and analysis of the efficiency of eight Iranian agricultural clusters in using business development services, specialized networks, and human resources (as input factors) were examined to fulfill the two performance measures of domestic sales and export (as output factors). This analysis was conducted in three phases. First,all the inputs and outputs were taken into account. Second, the capability of clusters in achieving the performance outputs was investigated. Third,cluster efficiency in input utilization was examined. In each of the three above phases, clusters have been compared with each other and, thereby, efficient and inefficient clusters have been determined. Finally,based on the resultsof the conducted analyses, practical recommendations have been made for decision-makers to improve the performance of clusters. These recommendations have been focused on which cluster is suitable to concentrate on increasing the number of networks, business networks, or human resources and/or increasing its capabilities in the utilization of inputs and existing resources.
References
Altenburg, T., & Meyer-Stamer, J. (1999). How to promote clusters: policy experiences from Latin America. World development, 27(9), 1693-1713.
Anbumozhi, V., Gunjima, T., Ananth, A. P., & Visvanathan, C. (2010). An assessment of inter-firm networks in a wood biomass industrial cluster: lessons for integrated policymaking. Clean
Technologies and Environmental Policy, 12(4), 365-372.
Charnes, A., Cooper W. W., Rhodes, E. (1978). Measuring the efficiency of decision making units.
European Journal of Operational Research, 2: 429-444.
Chetty, S., & Blankenburg Holm, D. (2000). Internationalisation of small to medium-sized manufacturing firms: a network approach. International Business Review, 9(1), 77-93.
94
Chuluunbaatar, E., Luh, D. B., & Kung, S. F. (2014). The Role of Cluster and Social Capital in Cultural and Creative Industries Development. Procedia-Social and Behavioral Sciences, 109: 552-557.
Cui, M., Wei, X. (2012). Analysis for Innovation Performance of the Enterprise in Industrial Cluster Based on the Network, Advances in Intelligent and Soft Computing, 141: 443-450.
De Maeseneire, W., & Claeys, T. (2012). SMEs, foreign direct investment and financial constraints: The case of Belgium. International Business Review, 21(3), 408-424.
De Maeseneire, Wouter, Claeys, Tine. (2012). SMEs, foreign direct investment and financial constraints: The case of Belgium, International Business Review, 21(3), 408-424.
Enright, M. J. (2000). Regional clusters and multinational enterprises: independence, dependence, or interdependence? International Studies of Management & Organization, 114-138.
Esquita, L. F. (2007) Starting over when the bickering never ends: Rebuilding aggregate trust among clustered firms through trust facilitators. Academy of Management Review, 32(1), 72-91.
Felzensztein, C., & Gimmon, E. (2008). Industrial Clusters and Social Networking for enhancing inter-firm cooperation: The case of natural resources-based industries in Chile. Journal of business
market management, 2(4), 187-202.
Gilmore, A., Carson, D., & Rocks, S. (2006). Networking in SMEs: Evaluating its contribution to marketing activity. International Business Review, 15(3), 278-293.
Giuliani, E. (2007). The selective nature of knowledge networks in clusters: evidence from the wine industry. Journal of economic geography, 7(2), 139-168.
Humphrey, J., & Schmitz, H. (1998). Trust and inter‐firm relations in developing and transition economies. The journal of development studies, 34(4), 32-61.
Janová, j., Vavřina, j., Hampel, d. (2012). DEA as a tool for bankruptcy assessment: the agribusiness case study. Proceedings of the 30th international conference mathematical methods in economics, karviná: silesian university in opava. 379–383.
Jianjun Tang, J., Henk Folmer, H., Jianhong Xue, J. (2015). Technical and allocative efficiency of irrigation water use in the Guanzhong Plain, China. Food Policy, 50: 43-52.
Karaev, A., Lenny Koh, S. C., & Szamosi, L. T. (2007). The cluster approach and SME competitiveness: a review. Journal of Manufacturing Technology Management, 18(7), 818-835. Maskell, P. (2001). Towards a knowledge‐based theory of the geographical cluster. Industrial and
corporate change, 10(4), 921-943.
McCann, B. T., & Folta, T. B. (2008). Location matters: where we have been and where we might go in agglomeration research. Journal of Management, 34(3), 532-565.
Miller, N. J., Besser, T. L., & Sattler Weber, S. (2010). Networking as marketing strategy: a case study of small community businesses. Qualitative Market Research: An International Journal, 13(3), 253-270.
Morosini, P. (2004). Industrial Clusters, Knowledge Integration and Performance, World Development, 32(2), 305-326.
95
Oprime, P. C., Tristão, H. M., & Pimenta, M. L. (2011). Relationships, cooperation and development in a Brazilian industrial cluster. International Journal of Productivity and Performance Management,
60(2), 115-131.
Peel, D. (2004). Coaching and mentoring in small to medium sized enterprises in the UK: Factors that affect success and a possible solution. International Journal of Evidence Based Coaching and
Mentoring, 2(1), 46-56.
Porter, M. E. (1990). The competitive advantage of nations. Harvard business review, 68(2), 73-93. Stejskal, J., & Hajek, P. (2012). Competitive advantage analysis: a novel method for industrial clusters identification. Journal of Business Economics and Management, 13(2), 344-365.
Tomaa, E., Dobrea, C., Donaa, I., Cofasa, E. (2015). DEA applicability in assessment of agriculture efficiency on areas with similar geographically patterns. Agriculture and Agricultural Science
Procedia, 6, 704 – 711.
Thornton, S. C., Henneberg, S. C., & Naudé, P. (2013). Understanding types of organizational networking behaviors in the UK manufacturing sector. Industrial Marketing Management, 42(7), 1154-1166.
Vlontzos, G., Niavis, S., Manos, B. (2014). A DEA approach for estimating the agricultural energy and environmental efficiency of EU countries. Renewable and Sustainable Energy Reviews, 40: 91– 96.