109
A Multi-objective Model for Location of Transfer Stations: Case Study in Waste
Management System of Tehran
Armin Jabbarzadeh
1*1, FarzanehDarbaniyan
2, M.Saeed Jabalameli
31,2,3
School of Industrial Engineering, Iran University of Science and Technology, Tehran, Iran. [email protected], [email protected], [email protected]
Abstract
This paper presents a multi-objective optimization model for the design of a waste management system consisting of customers, transfer stations, landfills and collection vehicles. The developed model aims to simultaneously minimize the total costs, greenhouse gas emissions and the rates of energy consumption. To tackle the multiple objectives in the problem, an interactive fuzzy programming solution approach is utilized. The model is capable of determining the location and allocation of transfer stations as well as the selection of the waste processing technologies. The proposed model isapplied to a case problem where real data is used for long-term planning of solid waste of Tehran city.
Keywords: Waste management systems, Facility location, Transfer stations, Multi-objective optimization
1
-
Introduction
Global waste generation rates are rising fast due to population explosion and economic development. Therefore, an effective approach for the design and planning of waste management system is indispensable (Sujing, 2010).The planning and design of a regional solid waste management system involves selection of treatment and disposal facilities, allocation of solid wastes and waste residues to treatment and disposal sites, and determination of transportation routes (Sujing, 2010).
Design of a regional solid waste management system typically requires consideration of several criteria such as the distances from residential areas and main roads, investment costs, climate conditions, availability of solid wasted, and land slope (Önüt & Soner, 2008).
*Corresponding author
ISSN: 1735-8272, Copyright c 2016 JISE. All rights reserved
Journal of Industrial and Systems Engineering
Vol. 9, No. 1, pp 109-125
Winter (January) 2016
Waste transfer stations play an important role in a community waste management system by serving as links between community solid waste collection facilities and waste disposal centers. The waste transfer stations aim to consolidate waste from multiple collection vehicles into higher volume transfer vehicles for more economical shipment to distant disposal sites. In other words, a transfer station is a facility with a designated receiving area where waste collection vehicles discharge their loads. The waste is often compacted, and then loaded into larger vehicles for haul shipment to a final disposal site. No long-term storage of waste occurs at a transfer station. Thus, waste is quickly consolidated and loaded into a larger vehicle and moved off site within few hours (Anon, 2002).
The primary reason for using a transfer station is to reduce the cost of transporting waste to disposal facilities. Consolidating smaller loads from collection vehicles into larger transfer vehicles, reduces hauling costs by enabling collection crews to spend less time traveling to and from distant disposal sites and more time collecting waste. According to Antunes (1999), shipment costs on transportation trailers are estimated to be only about 30% of the costs incurred by the same quantity hauled by the collection vehicles. Utilizing transfer stations, furthermore, reduces fuel consumption and collection vehicle maintenance costs, and produces less overall traffic, air emissions, and road wear. Waste transfer stations also provide more flexibility in terms of disposal options. Decision makers have the opportunity to select the most cost-effective and/or environmentally protective disposal sites, even if they are more distant. They can consider multiple disposal facilities, secure competitive disposal fees, and choose a desired method of disposal (e.g. land filling or incineration)(Anon, 2002).
Selecting suitable locations for transfer stations is a complex problem and calls for a detailed evaluation process accounting for the requirements of municipal, governmental and environmental regulations (Önüt & Soner, 2008). For example, in many communities, citizens have voiced concerns about solid waste transfer stations that are poorly sited, designed, or operated. In addition, some citizens might feel that transfer stations are disproportionately concentrated in or near their communities. Yet transfer stations play an important role in a community’s waste management system (Barcena-Ruiz & Casado-Izaga, 2015).The rise in the popularity of environmental considerations in municipal planning also has increased the need to fully identify the environmental principles to determine the best location of the solid wastes to be collected (Önüt & Soner, 2008).
In this context, multi-criteria decision making approaches and optimization models have been popular tools to tackle facility location problem within waste management systems. Kao and Lin (1996) developed a facility location model to obtain optimal landfill sites utilizing a mixed-integer programming model. Siddiqui et al. (1996) were among the first scholars to use a combined geographical information system and analytical hierarchy process procedure to aid in site selection. Later, Chang (1997) formulated an operational solid waste management model through a hierarchical approach, in which the site finding problem of transfer stations in a large scale metropolitan region decomposed into two different levels. This analytical method contained a preliminary screening procedure using the geographical information system and an optimization analysis by a mixed integer programming model. Kirca and Erkip (1988) proposed a static model to minimize the total transportation cost for transfer station location. Their model selects the loading–unloading facilities technology and number of transfer vehicles.
Antunes (1999) formulates a single objective mixed-integer optimization model to determine the location and size of the transfer stations and sanitary landfills, while minimizing total transportation and opening costs. In another work, Chang and Wie (2000) presented a fuzzy multi-objective nonlinear integer programming model to optimize site aspects in the solid waste collection network. To select the best municipal solid waste management strategy, Chambal et al. (2003) developed a multiple-objective decision analysis model. Eiselt (2007) examined the site finding of landfills and waste transfer stations in
New Brunswick and compared the results with the locations of existing facilities. The developed optimization formulation was similar to the models used in the analysis of standard hub location problems. Xi et al. (2010) addressed a long-term planning of solid waste management in the City of Beijing, China using an inexact chance-constrained mixed-integer linear programming model.
Samanlioglu (2013) presents a novel multi-objective location-routing model to decide on locations of treatment centers, routing different types of industrial hazardous wastes to treatment centers, locations of recycling centers and routing hazardous waste and waste residues to those centers, and locations of disposal centers and routing waste residues there. More recently, Eiselt and Marianov (2015) discussed different classes of decision-making models and formulate a generic cost-minimization model for landfill site problem. They also surveyed landfill location models that had appeared in the literature during the last forty years. Beskese et al. (2014) present a hybrid method based on analytical hierarchy process to choose the proper landfill location among three possible landfill sites for the city of Istanbul. Kinob et al. (2015) used geographical information system tools’ to optimize travel distances, trips and collection time to maximize total waste collection, and as a result large savings and keeping the environment clean. For a comprehensive review of the existing literature on solid waste management a reader can refer to Ghiania et al. (2014).
The above literature review reveals that the main focus of existing studies has been placed on undesirable facility location, primarily on landfill site problems. However, there are a limited number of models optimizing the locations and technologies of transfer stations. Moreover, most models in the literature of the urban waste management overlook the sustainability issues entailing the impacts of transporting wastes on environment. Motivated by a real-world case of designing the waste management system in Tehran, this paper presents a multi-objective model that aims to address these research gaps. Tehran is the most populated and is an industrial region of Iran. As a result, waste materials produced by the industrialization and urbanization cause various environmental problems. The waste management system is comprised of customers, transfer stations and landfills. The transfer stations are responsible for compacting the wastes collected from customers and loading them into semi-trailers to transfer to landfills. The proposed model determines the location and allocation of transfer stations and selects the waste processing technologies in facilities to compact the wastes. The objective is to simultaneously minimize the greenhouse gas emissions and the rates of energy consumption within the waste management system at the lowest cost. To tackle the multiple objectives in the problem, an interactive fuzzy programming solution approach is used.
The remainder of this paper is organized as follows. Section 2 states the problem and presents the multi-objective model. The solution approach for the developed model is presented in Section 3. The application of the multi-objective model in the real world case of Tehran is presented in Section 4. Finally, Section 5 concludes the article and provides directions for future research in the area.
2- Model Formulation
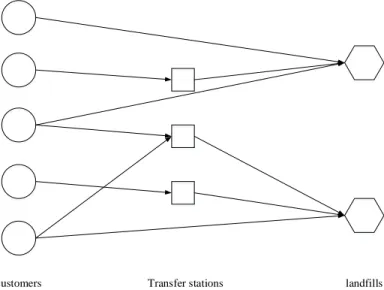
An optimization model for designing a waste management system consisting of customers (waste generators), transfer stations and landfills is formulated in this section. In this system, the collection vehicles collect the waste generated by customers at each region and haul them either to a landfill site directly, or to a transfer station. The transfer stations compact the waste and transport it to a landfill by semi-trailers. Compacting the waste leads to decrease in the volume of the garbage and the amount of greenhouse gas emission. Likewise, semi-trailers and collection vehicles have different capacities and
greenhouse emissions. At each transfer station, different technology types with different costs and energy consumption rates can be acquired. Figure 1 shows the structure of this waste management system.
customers Transfer stations landfills
Figure 1.The structure of waste transportation system
The problem lies in determining the following decisions at once: 1. The number of transfer stations to be located,
2. The location of transfer stations,
3. The technology adopted at each transfer station, 4. The number of semi-trailers at each transfer station,
5. The quantity of waste to transported from each transfer station to landfills, 6. The number of collection vehicles at each customer region
7. The quantities of waste transported from each customer region to transfer stations and landfills. To determine the above decisions, a multi-objective model is developed which aims at minimizing the total cost as well as minimizing greenhouse gas emissions and the rates of energy consumption within the waste management system.
2-1- Notations
In order to formulate the model, the following notations are used. Indices:
i
:
Index of customers j : Index of transfer stationsk
: Index of landfillsl
: Index of technology levels at transfer stations Parameters:Tc
: Shipment cost by a collection vehicle, per kilometerl
Sc
:
Shipment cost by a semi-trailer with technology levell
, per kilometerlj
Fc
: Fixed cost of establishing transfer station 𝑗𝑗 with technology levell
lj
V c
: Variable cost of compacting waste at station j with technology levell
ij
drt
: Distance between customer regioni
and transfer station jjk
dtl
: Distance between transfer station j and landfillk
ik
drl
: Distance between customer regioni
and landfillk
TSn
: Maximum number of transfer stationslj
Ca
: Capacity of transfer station j with technology levell
Tp: Greenhouse gas emission from a collection vehicle, per kilometer
l
Sp
: Greenhouse gas emission from a semi-trailer with technology levell
, per kilometerW p : Greenhouse gas emission from waste, per cubic meter of waste and per kilometer
l
Wcp
: Greenhouse gas emission from the waste compacted with technology levell
, per cubic meter of waste and per kilometerl
β
: Compaction factor of technologyl
for reducing the volume of the waste (this parameter shows how much the volume of waste will be after the compaction be reduced.)l
α
: Discount factor for a transfer station with the technology levell
(This factor shows how much the cost of shipping waste from a transfer station with the technology level 𝑙𝑙 is lower than directly shipping it from a customer.)lj
ε
: Energy consumption rate of transfer station 𝑗𝑗 with the technology levell
i
ww
: Total amount of waste generated by customer regioni
Tca
: Capacity of a collection vehiclel
Sca
: Capacity of semi-trailer with technology levell
lj
Mca
: Minimum percentage of the capacity of a transfer station which needs to be used if technology levell
is adopted at location jDecision variables:
ijl
X
: Volume of waste shipped from customer regioni
to the transfer station j with technology level 𝑙𝑙(in cube meter)jkl
Y
: Volume of waste shipped from transfer station j with technology levell
to the landfillk
(in cube meter)
ik
U
: Volume of waste shipped from regioni
to the landfillk
(in cube meter)lj
Z
: Equal to 1 if a transfer station with technology level l is established at location j , 0 otherwiseij
Tnt
:Number of collection vehicles for shipping waste from regioni
to transfer station jik
Tnl
:Number of collection vehicles for shipping waste from regioni
to landfillk
jkl
Sn
: Number of semi-trailers with technology level l for shipping waste from transfer station j to landfillk
2-2- Objectives
In this problem, three objectives are taken into account:
• Minimizing the total cost
• Minimizing the total emission of greenhouse gas
• Minimizing the total rate of energy consumption
114
Equations (1)-(3) present these objectives respectively.
1)
1 .
.
lj lj lj ijl ik ik
j l i j l i k
ij ij l l jk jkl
i j j k l
Min Fc z vc x Tc drl Tnl
Tc drt Tnt Sc dtl Sn
ϖ
α
= + + + +∑∑
∑∑∑
∑∑
∑∑
∑∑∑
(2)2 . .
. .
ij ij jk jk l jk jkl
i j j k j k l
ij ijl l jk jkl ik ik
l i j l j k i k
Min Tp drt Tnt Tp dtl Tnl Sp dtl Sn
Wp drt x Wcp dtl y Wp drl u
ϖ
= + ++ + +
∑∑
∑∑
∑∑∑
∑∑∑
∑∑∑
∑∑
(3)
3 lj ijl
i j l
Min
ϖ
=
∑∑∑
ε
x
The cost components in Equation (1) include the fixed cost of establishing transfer stations, the shipment from customers to transfer stations landfills, the cost of compacting waste at transfer stations, and the shipment cost from transfer stations to landfills. Equation (2) sums the amounts of greenhouse gas emitted from collection vehicles, semi-trailers, and compacted and uncompacted wastes. Equation (3) minimizes the total rates of energy consumptions considering different technologies of transfer stations.
2-3- Constraints
(4) 1
lj j
Z
≤
TSn
∑∑
(5)
ijl ik i
j l k
x
+
u
=
ww
∀
i
∑∑
∑
(6)
,
l ijl jkl
i k
x
y
j l
β
∑
=
∑
∀
(7)
,
ijl lj lj
i l
x
≤
Ca z
∀
j l
∑
∑
(8)
1
lj l
z
≤
∀
j
∑
(9)
,
ijl lj lj lj i
x
≥
Mca
×
Ca
×
Z
∀
j l
∑
(10)
T
,
ijl ij l
x
≤
Tnt
×
ca
∀
i j
∑
(11)
T
,
ik ik
u
≤
Tnl
×
ca
∀
i k
(12)
, ,
jkl jkl l
y
≤
Sn
×
Sca
∀
i j l
(13)
,
,
0
ij jk ik
Tnt Sn Tnl
≥
(14)
,
,
0
ijl jkl ik
x
y
u
≥
(15)
{ }
0,1
lj
Z
∈
Constraint (4) enforces the maximum number of transfer stations which can be located. Constraint (5) ensures that the total amount of waste shipped to landfills is equal to the sum of the waste quantities shipped from transfer stations and customers to them. Constraint (6) represents the flow balance constraint in transfer stations. Constraint (7) enforces the capacity limitation of transfer stations. Constraint (8) requires only a single technology level that can be adopted at each transfer station. Constraint (9) ensures the minimum percentage of capacity which must be used at each transfer station. Constraints (10)-(13) guarantee that the amounts of the waste shipped by collection vehicles and semi-trailers do not exceed their capacities in different routes. Finally, constraints (14)-(15) define the domain of decision variables.
3- Solution Approach
Numerous techniques have been developed to solve multi-objective linear programming models. Weighted sum methods, goal programming, compromise programming, and ε-constraint are amongst the simplest and most popular techniques. However, the primary difficulty with these methods is determining the weight or the goal of each objective (Jadidi et al., 2014; Selim & Ozkarahan, 2008). To cope with this difficulty, fuzzy approaches can be applied for solving the multi-objective models (Eydi & Javazi, 2012).Fuzzy approaches is capable of measuring the satisfaction degree of each objective function explicitly. This issue can assist decision makers in making their final decisions by selecting a preferred efficient solution according to the preference of each objective function (Seifbarghy, et al., 2011;Mohammadi et al., 2011). In this paper, the interactive fuzzy programming solution approach developed by Torabi and Hassini, (2008) is used to solve the model. The primary reason why we have used this method is that unlike classical multi objective programming techniques which may arrive at weakly efficient solutions, it can guaranty to find just efficient solutions. Also, the fuzzy programming solution approach can obviate the need for setting the precise weight for each objective function in advance (Maghool & Razmi, 2010; Torabi and Hassini, 2008). The fuzzy programming solution approach for our multi-objective model (1)-(15) includes the following steps:
Step 1. Determine the positive ideal solution (PIS) and negative ideal solution (NIS) for each objective function. To reach the positive ideal solutions, we just need to solve each objective function separately as follows:
(16)
min
PIS
h h
ϖ
=
ϖ
s. t.
Constraints (4)-(15)
The negative ideal solution can be also obtained by solving the following model:
(17)
max
NIS
h h
ϖ
=
ϖ
s. t.
Constraints (4)-(15)
Where
ϖ
h denotes theh
th objective value (see (1)-(3)).Step 2. Determine a linear membership function for each objective function using Equation (18):
116
(18)
1
0
NIS
h h
NIS
PIS NIS
h h
h NIS PIS h h h
h h
PIS
h h
ϖ
ϖ
ϖ
ϖ
µ
ϖ
ϖ
ϖ
ϖ
ϖ
ϖ
ϖ
<
−
=
≤
≤
−
>
We can interpret
µ
has the satisfaction degree for theh
th objective function for the given solution vectorv. Figure 3 illustrates the graph of this membership function.
Figure 2.The membership function
Step 3.Convert the multi-objective model (1)-(15) into an equivalent single-objective using the following formulation.
(19)
00
0
( )
(1
)
s.t .
1, 2,3
[0,1]
Constraints (4)-(15)
h h h h
Max
h
λ ν
γλ
γ
θ µ
λ
µ
λ
γ
=
+ −
≤
=
∈
∑
Where
µ
handλ
0=
min { }
hµ
h indicate the satisfaction degree ofh
th objective function and the minimum satisfaction degree of objectives, respectively.Equation (19) has a new achievement function defined as a convex combination of the lower bound for satisfaction degree of objectives (
λ
0), and the weighted sum of these achievement degrees (µ
h)toguarantee arriving at an adjustable balanced compromise solution. Furthermore,
θ
handγ
represent the relative importance for theh
th objective function and the coefficient of compensation, respectively. The value ofθ
his selected by decision makers based on their preferences, while it is required that∑
hθ
h=
1
and
θ >
h0
. In addition,γ
controls the minimum satisfaction level of objectives as well as the compromisedegree among the objectives implicitly. In other words, the developed formulation enables decision makers to yield both unbalanced and balanced compromised solutions based on their preferences through adjusting the value of parameter
γ
. Evidently, a higher value forγ
means that more attention is paid to gain a larger lower bound for the satisfaction degree of objectives (λ
0) and consequently more balancedcompromise solutions. Conversely, a lower value for
γ
results a solution with a higher satisfaction degrees for some objectives and lower satisfaction degrees for the other ones (leading to unbalanced compromise solutions).Step 4. Having the coefficient of compensation (
γ
) and relative importance of the fuzzy goals (θ
vector), solve the model (19). If the decision maker is satisfied with this current efficient compromise solution, stop. Otherwise, provide another efficient solution by changing the value of controllable parameters and go to step 3.4- Case Study
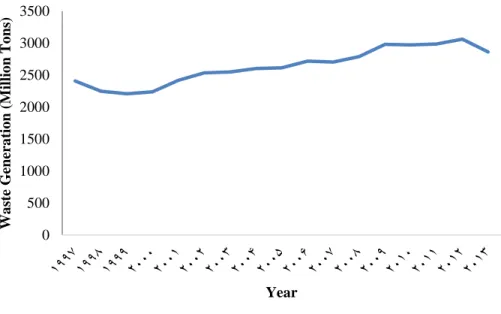
Municipal solid waste has been one of the most major concerns in Tehran over the past few years. The main difficulty with solid waste management in Tehran is the large amount of waste per day which is estimated to be 7.641million ton in average. Figure 3 illustrates the total amount of waste generated in Tehran from 1997 to 2013, as reported by Tehran waste management organization.
Figure 3. Total solid waste generation in Tehran from 1997 to 2013 based on data provided by Tehran waste management organization
0 500 1000 1500 2000 2500 3000 3500
W
a
st
e
G
en
er
a
tio
n
(
M
illio
n
T
o
n
s)
Year
As can be seen in Figure 3, the yearly generated waste in Tehran has had an increasing trend from 1997 to 2013. Thus, we expect even more quantities of waste in near future which can lead to undesirable impacts such as pollution, diseases, vermin animals, etc. This highlights the need for establishing more infrastructures including transfer stations, landfills, and transportation vehicles as well as utilizing higher technologies for managing such a large amount of waste. The experts of Tehran waste management organization have found that the utilization of compacting technologies can be helpful for this purpose. Compacting technologies can considerably reduce the volumes of wastes (up to 40%) and rates of energy at transfer stations without any need for vast spaces. Three technology levels can be adopted at transfer stations:
1. Technology level 1: Following this approach, traditional technologies are selected.
2. Technology level 2: This technology level corresponds with adopting compacting technologies and resuming the existing semi-trailers. Using this approach, the quantity of compacted wastes are loaded in existing semi-trailers and hauled to landfills. This technology is less expensive, but it leads to consuming more amounts of energy in comparison with technology level 3.
3. Technology level 3: This technology level is equivalent to acquiring compacting technologies as well as purchasing modern trucks equipped with compacting technologies. This technology level is the most expensive strategy due to the large costs of purchasing new trucks. However, it can result in lower rates of energy, fuel and pollution.
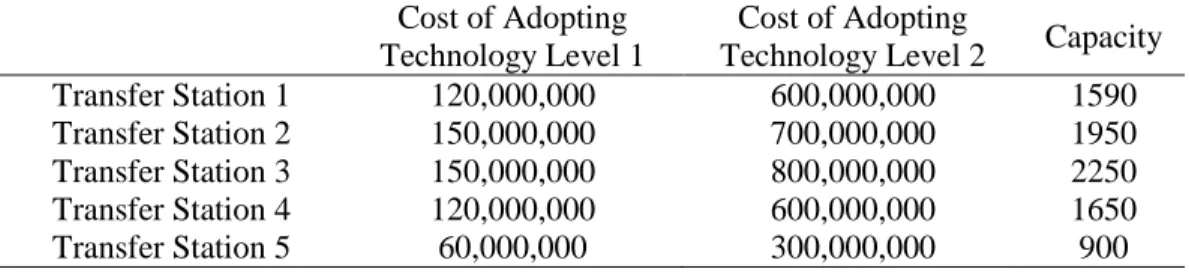
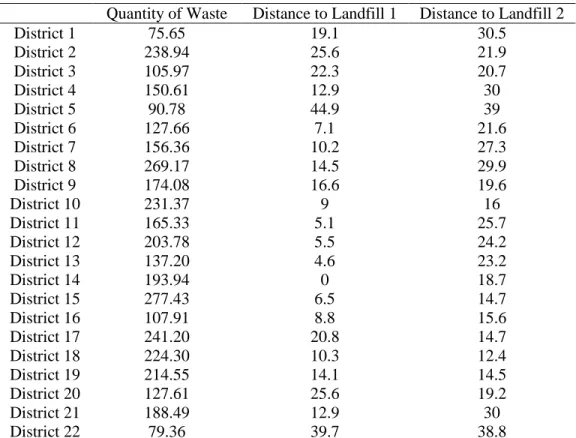
While there were 11 active transfer stations in Tehran, five locations were identified as potential sites for establishing new transfer stations. Table 1 provides the distances of these locations from the 22 districts of Tehran and the two landfills located in Abali and Kahrizak region. The fixed costs of establishing transfer stations with different technology levels along with their capacities are presented in Table 2. Also, Table3 includes the distances between districts of Tehran and landfills as well as the amounts of waste generated in these sites.
Table 1. Distances between potential locations for establishing transfer stations and the other sites
Transfer Station 1
Transfer Station 2
Transfer Station 3
Transfer Station 4
Transfer Station 5
District 1 5.1 21.6 17.1 19.1 30.5
District 2 16.3 13 25.7 25.6 21.9
District 3 15.6 12.1 16.9 22.3 20.7
District 4 11.4 15.8 24.4 12.9 30
District 5 26 17.2 12.6 44.9 39
District 6 18 6.1 19.6 7.1 21.6
District 7 14.9 19.6 28.2 10.2 27.3
District 8 16.5 23.2 31.8 14.5 29.9
District 9 25.4 1.1 13.3 16.6 19.6
District 10 28.8 4.6 18.2 9 16
District 11 18 10 23.7 5.1 25.7
District 12 16.5 12.2 30.6 5.5 24.2
District 13 17.1 10.3 31.5 4.6 23.2
District 14 22.8 17.2 35.4 0 18.7
District 15 29.1 13.1 31.4 6.5 14.7
District 16 29.6 5.1 18.7 8.8 15.6
District 17 31.3 7 16 20.8 14.7
District 18 31.2 11.6 25 10.3 12.4
District 19 32.4 26.9 37.9 14.1 14.5
District 20 29.2 4.9 13.1 25.6 19.2
District 21 11.4 15.8 24.4 12.9 30
District 22 28.3 16.1 6.1 39.7 38.8
Landfill 1 70 45 50 25 22
Landfill 2 25.4 39.9 48.4 31.3 44.5
Table 2. Capacity and cost of establishing transfer stations with different technology levels
Cost of Adopting Technology Level 1
Cost of Adopting
Technology Level 2 Capacity
Transfer Station 1 120,000,000 600,000,000 1590
Transfer Station 2 150,000,000 700,000,000 1950
Transfer Station 3 150,000,000 800,000,000 2250
Transfer Station 4 120,000,000 600,000,000 1650
Transfer Station 5 60,000,000 300,000,000 900
Table 3. Amounts of waste generated in districts of Tehran and their distances to landfills
Quantity of Waste Distance to Landfill 1 Distance to Landfill 2
District 1 75.65 19.1 30.5
District 2 238.94 25.6 21.9
District 3 105.97 22.3 20.7
District 4 150.61 12.9 30
District 5 90.78 44.9 39
District 6 127.66 7.1 21.6
District 7 156.36 10.2 27.3
District 8 269.17 14.5 29.9
District 9 174.08 16.6 19.6
District 10 231.37 9 16
District 11 165.33 5.1 25.7
District 12 203.78 5.5 24.2
District 13 137.20 4.6 23.2
District 14 193.94 0 18.7
District 15 277.43 6.5 14.7
District 16 107.91 8.8 15.6
District 17 241.20 20.8 14.7
District 18 224.30 10.3 12.4
District 19 214.55 14.1 14.5
District 20 127.61 25.6 19.2
District 21 188.49 12.9 30
District 22 79.36 39.7 38.8
The proposed model is implemented in this study to redesign the waste management network of Tehran. To solve this model, the decision maker provides the relative importance of objectives linguistically as
1 2 3
θ θ θ
> >
, and based on this relationships we set the objectives weight vector as: θh =(0.5, 0.3, 0.2).In this respect, our initial experiments show that any value of
γ
between 0.3 and 0.8 could be appropriate for obtaining a compromise solution. Figure 3 demonstrates the results of solving the model at(0.5, 0.3, 0.2) h
θ = andγ =0.4. Table 4 and Table 5 moreover present sensitivity analyses on the values of
γ
andθ
h, respectively, which can be used for exploring tradeoffs between the three objectives of the problem. An important managerial insight from the obtained results is that the optimal solution requires adopting the technology level 3at all the transfer stations which corresponds to acquiring compacting technologies as well as purchasing modern trucks. In other words, despite the large costs of adopting compacting technologies and purchasing equipped trucks, this technology level is the most effective strategy when one aims to simultaneously minimize the total cost, rate of energy consumption, and air pollution in Tehran.1
1
1
3
4 2
5
2
Region
Transfer station Landfill
km
22
21
20 19
18 17
16 15 14 13 12
11 10 9
8 7
6 5
4 3
2
1
Figure3. Optimal decisions for locations and allocation of transfer stations in Tehran
Table4.Sensitivity analysis on γ value for exploring balanced compromise solutions
γ Total Cost (
ϖ
1)Total Emission of Greenhouse (
ϖ
2)Total Rate of Energy
Consumption (
ϖ
3)λ
00 6522017 147995 422692.2 0.856
0.1 9390087 248724.2 203478.4 0.742
0.2 9833596 264350.7 173737.9 0.724
0.3 9834618 263780.1 174456.7 0.724
0.4 9828775 264295.9 173693.6 0.725
0.5 9553734 249558.7 201443.2 0.736
0.6 9675836 256537.8 188965.9 0.731
0.7 9957699 265551.3 174772.9 0.719
0.8 9947848 265422.7 175850.5 0.72
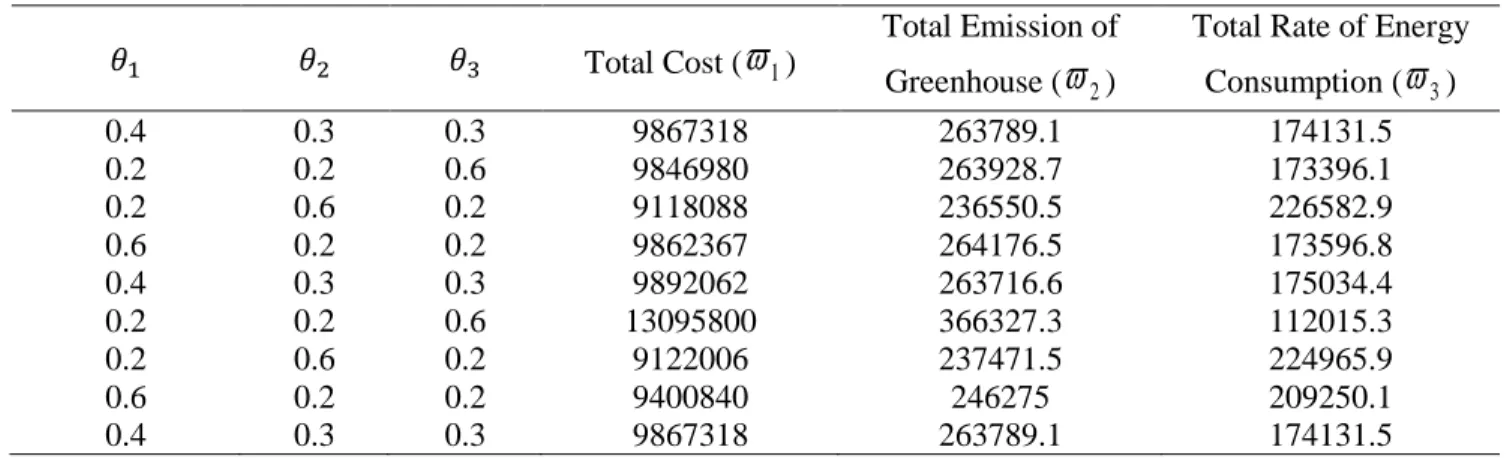
Table 5. Sensitivity analysis on 𝜃𝜃 values for exploring tradeoffs between the three objectives
𝜃𝜃1 𝜃𝜃2 𝜃𝜃3 Total Cost (
ϖ
1)Total Emission of Greenhouse (
ϖ
2)Total Rate of Energy Consumption (
ϖ
3)0.4 0.3 0.3 9867318 263789.1 174131.5
0.2 0.2 0.6 9846980 263928.7 173396.1
0.2 0.6 0.2 9118088 236550.5 226582.9
0.6 0.2 0.2 9862367 264176.5 173596.8
0.4 0.3 0.3 9892062 263716.6 175034.4
0.2 0.2 0.6 13095800 366327.3 112015.3
0.2 0.6 0.2 9122006 237471.5 224965.9
0.6 0.2 0.2 9400840 246275 209250.1
0.4 0.3 0.3 9867318 263789.1 174131.5
5 - Conclusions
In this study, a multi-objective optimization model is presented for the design of solid waste management system. The objective of the problem is to simultaneously minimize the greenhouse gas emissions and the rates of energy consumption within the waste management system at the lowest cost. An interactive fuzzy programming solution approach was utilized to solve the multi-objective model. The proposed approach in this study is used to redesign the waste management network of Tehran using real data. The obtained results revealed that the optimal solution requires adopting high technologies for transfer stations of Tehran, albeit their large costs.
Future research can study inherent uncertainty of input data such as amounts of waste generated at each region. Stochastic programming or robust optimization approach can be promising tools for this purpose. Another direction for future research can be the incorporation of vehicle routing decisions into the model. In this case, considering time windows may take a great importance in the problem. In addition, dealing with larger network design problems, compared to those investigated in our real case study, may need the development of solution methods that can reach optimal solutions within reasonable length of time.
References
Barcena-Ruiz, J. C. & Javier Casado-Izaga, F., 2015. Regulation of waste management under spatial competition. Journal of Cleaner Production, pp. 216-222.
Selim , H. & Ozkarahan, I., 2008. A supply chain distribution network design model: An interactive fuzzy goal programming-based solution approach. Int J Adv Manuf Technol, 36(3-4), pp. 401-418.
Abduli, M. & Azimi, E., 2010. Municipal waste reduction potential and related strategies in Tehran. International Journal of Environmental Research, 4(4), pp. 901-912.
Anon., A., 2002. A manual for decision-Making. United States Environmental Protection Agency. s.l.:s.n.
Antunes, A., 1999. Location analysis helps manage solid waste in central Portugal. Interfaces, 29(4), pp. 32-43.
Beskese, A., Demir, H. H., Ozcan, H. K. & Okten, H. E., 2014. Landfill site selection using fuzzy AHP and fuzzy TOPSIS: a case study for Istanbul. Environmental Earth Sciences, 73(7), pp. 3513-3521. Chambal, S., Shoviak, M. & Thal Jr., A., 2003. Decision analysis methodology to evaluate integrated solid waste management alternatives. Environmental Modeling & Assessment, 8(1), pp. 25-34.
Chang, N.,& lin, 1997. Optimal siting of transfer station locations in a metropolitan solid waste management system. Journal of Environmental Science & Health Part A, 32(8), pp. 2379-2401.
Chang, N. & Wie, Y., 2000. Siting recycling drop-off stations in urban area by genetic algorithm-based fuzzy multiobjective nonlinear integer programming modeling. Fuzzy Sets and Systems, 114(1), pp. 133-149.
Eiselt, H., 2007. Locating landfills-Optimization vs. reality.. European Journal of Operational Research, 179(3), pp. 1040-1049.
Eiselt, H. & Marianov, V., 2015. Location modeling for municipal solid waste facilities. Computers & Operations Research,62, pp. 1040-1049.
Erkut, E., 2008. A multicriteria facility location model for municipal solid waste management in North Greece. European Journal of Operational Research, 187(3), pp. 1402-1421.
Eydi, A. & Javazi, L., 2012. Model and Solution Approach for Multi objective-multi commodity Capacitated Arc Routing Problem with Fuzzy Demand. Journal of Industrial and Systems Engineering, 5(4), pp. 208-229.
Ghiania, G., Laganàb, D., Mannia, E., Musmannob, R., Vigo, D.2014. Operations research in solid waste management: A survey of strategic and tactical issues. Computers & Operations Research, Volume 44, pp. 22-32.
Hosseiniju,M& bashiri, M., 2012. Stochastic models for transfer point location problem. The International Journal of Advanced Manufacturing Technology, 58(1-4), pp. 211-225.
Jadidi, O., zolfaghari, S. & Cavalieri, S., 2014. A new normalized goal programming model for multi-objective problems: A case of supplier selection and order allocation. International Journal of Production Economics, pp. 158-165.
Kao, J. & Lin, H., 1996. Multifactorial spatial analysis of landfill siting. Journal of Environmental Engineering.
Kinobe, J., Bosona, T. & Gebresenbet, G., 2015. Optimization of waste collection and disposal in Kampala city. Habitat International, Volume 49, pp. 126-137.
Kirca, O. & Erkip, N., 1988. Selecting transfer station locations for large solid waste systems. European Journal of Operational Research, 35(3), pp. 339-349.
Maghool, E. & Razmi, J., 2010. A Fuzzy Based Mathematical Model for Vendor Selection and Procurement Planning with Multiple Discounts in the Presence of Supply Uncertainty. Journal of Industrial and Systems Engineering, 4(2), pp. 125-151 .
Mohammadi, M.,Torabi & Tavakoli-Moghaddam, 2014. Sustainable hub location under mixed uncertainty. Transportation Research, Volume 62, pp. 89-115.
Önüt, A.,& Soner, M., 2008. Transshipment site selection using the AHP and TOPSIS approaches under fuzzy environment.. Waste Management, 28(9), pp. 1552-1559.
Samanlioglu, F., 2013. A multi-objective mathematical model for the industrial hazardous waste location-routing problem. European Journal of Operational Research, 226(2), p. 332–340.
Seifbarghy, M., Gilkalayeh, A. P. & Alidoost, M., 2011. A Comprehensive Fuzzy Multiobjective Supplier Selection Model under Price Brakes and Using Interval Comparison Matrices. Journal of Industrial and Systems Engineering, 4(4), pp. 224-244.
Siddiqui, M., Everett, J. & Vieux, B., 1996. Landfill siting using geographic information systems: a demonstration. Journal of Environmental engineering, 122(6), pp. 515-523.
Sujing, M., 2010. An integrated optimization approach and multi-criteria decision analysis for supporting the waste-management system of the City of Beijing, China.. Engineering Applications of Artificial Intelligence, 23(4), pp. 620-631.
Torabi, S., & Hassini, E., 2008. An interactive possibilistic programming approach for multiple objective supply chain master planning. Fuzzy Sets and Systems, 159(2), pp. 193-214.
Xi , B.,Sua, J., Huangb, G., Qinc, X., Jianga, Y., Huoa, S., Jia, D., Yao, B.,2010. An integrated optimization approach and multi-criteria decision analysis for supporting the waste-management system of the City of Beijing, China. Engineering Applications of Artificial Intelligence, 23(4), pp. 620-631. Zhang, Q., Wei, L. & Hu, . R., 2014. A General Transfer Station Location Model in Relay Delivery Considering Carbon Footprint, IT Convergence and Security (ICITCS), pp. 1-4.