MODELING HUMAN REFERRING EXPRESSION GENERATION
Sahar Kazemzadeh
University of North Carolina at Chapel-Hill
Abstract
Referring generation expression is a natural language processing task that involves creating noun phrases that identify a referent object to a listener. We evaluate the state-of-the-art Visible Objects Algorithm for referring expression generation presented by Mitchell et. al (2012), and find that it does not perform as well with our natural image set than with the computer-generated image set that was originally used. Further, we analyze over 7,000 referring expressions
generated by players of ReferIt Game, an online game that we developed, and by Amazon Mechanical Turk workers to identify metrics with which to create an improved stochastic model that can be coupled with computer vision to mimic human referring expression generation from visual input.
1. Introduction
Referring expression generation is a natural language processing (NLP) task that involves creating noun phrases that identify a referent object to a listener. Such expressions include “the woman in the red shirt”, and “the red car on the left.” Research in referring expression generation (REG) mainly focuses on selecting attributes used to construct the final expression (i.e. <type: car, location: left, color: red>) rather than on generating the final expression. In 1995, Dale and Reiter introduced the now well-known Incremental Algorithm for referring expression
generation, and in 2003 Krahmer et. al introduced the Graph-Based Algorithm. In 2012, Mitchell et. al presented the non-deterministic Visible Objects Algorithm (VOA) for generating referring expressions based on parsed images with visual attributes provided in text form, which they found out-performs both the Incremental Algorithm and the Graph-Based Algorithm. However, one of the shortcomings of the Visible Objects Algorithm is that it was evaluated on the TUNA and GRE3D3 corpora, which entail sets of computer-generated images of artificial scenes, namely consisting of 3D geometric objects and furniture. Thus, the model was evaluated on corpora that represented artificial scenes rather than those that would realistically scene. Since the algorithm was created with the intent of being coupled with visual input from computer vision to mimic human referring expression generation, and such scenes are artificial, we wanted to study the algorithm’s performance on a more realistic corpora, and to study the algorithm’s shortcomings so that they can be addressed to create a more advanced algorithm.
2. Method
Data Collection
match. By having a second player select the object, we introduced a way of validating the expression and maintaining the integrity of our data.
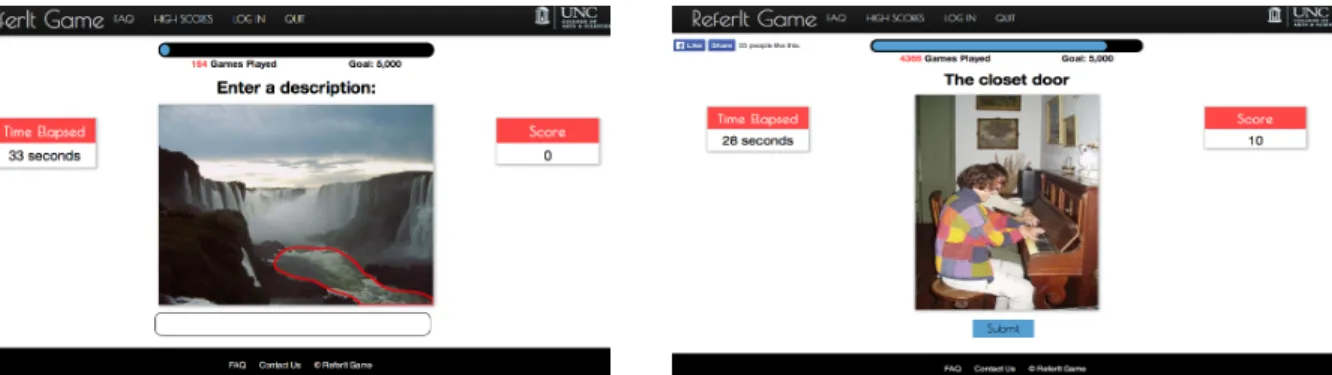
Figure 1. Screenshot of Player 1 and 2 screens during ReferIt game, respectively. Player 1 sees an image with a bounding box around a given object, while Player 2 sees the unmodified image with the expression generated by the other player.
After discounting the expressions that resulted in incorrect object matches, we collected over 3,000 viable expressions through ReferIt Game from over 200 players. We used the ImageCLEF data set to source our images, and of 20,000 available images with metadata featured over 2,300, with the images in ReferIt game prioritized for having at least two of the same type of object in the image, and those on Mechanical Turk selected for a roughly even representation of object size, object location, and object frequency (Grubinger 2007).
The Algorithm
The Visible Objects Algorithm has two stages: in the first stage, it iterates through a set of attribute, non-deterministically deciding whether to add the attribute to the final property set, which as we stated earlier, consists of a set such as <type: car, location: left, color: red>. In the first stage, it goes through the sets of given attributes and determines whether to select the attribute based on the following:
Figure 2. Example artificial scenes from the TUNA and GRE3D3 corpora originally used to evaluate the VOA.
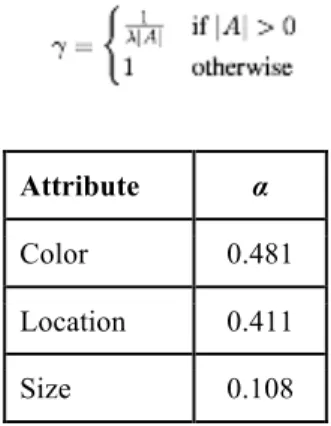
where A is the attribute set constructed so far, ɤis a length-based penalty, and αattribute is an empirically determined statistic for the attribute. It uses a length-based penalty because research suggests that more than three adjectives are rarely used in a visual noun phrase (Berg et al., 2011), and αattribute for each attribute was determined based on the relative frequencies with which the attributes occurred in the dataset. λ is an empirically determined weight; we used 3, since we found that to yield the best results.
Attribute α
Color 0.481
Location 0.411
Size 0.108
After calculating each value, the algorithm then generates a random number n, where 0 ≤ n ≤ 1. It adds the property if n < f( A ∪ {x} ) .
The second stage of the algorithm is executed only if there exists more than one object of the same type in the image. In this stage, the algorithm compares each attribute for each such object, and adds the attribute to the generated property set if the value of the attribute is unique for the original object, based on the length penalty ɤ alone.
In their implementation, Mitchell et. al assume that absolute and relative properties (like color and size, respectively) are used mutually exclusively. However, since only three properties (color, location, and size) in addition to type were relevant to our data set, we did not make this assumption since doing so would have yielded very minimal expressions. This difference in implementation should be noted, for had we treated absolute and relative properties as mutually exclusive, the VOA would have drastically underperformed.
3. Results
Algorithm Performance
In order to determine the performance of the Visible Objects Algorithm on our data set, we compared the expressions generated for a subset of the images in ReferIt Game with the set of expressions that the algorithm created for the same images. We calculated the Dice metric outlined in Mitchell et. al.’s VOA paper over boolean values for each attribute D, as follows:
| DS ∩ DH | / |D|,
where DS is the generated property set and DH is the human-produced property set for the
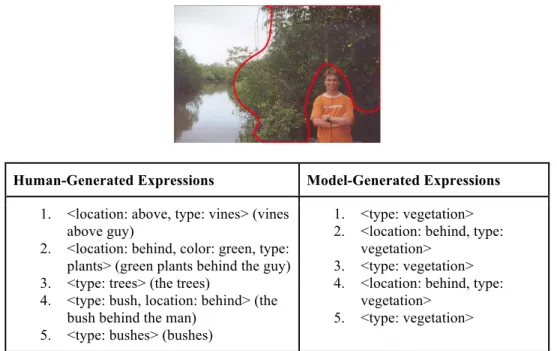
attributes D. For the subset of 100 images we evaluated, we hand-labeled the size, location, and color attributes to determine the ground-truth properties. We ran the VOA 100 times across the 100 images in order to generate 100 sets of model-generated expressions for each image, and computed the average Dice metric across the 100 iterations to be 82.7%, such that the Visible Objects Algorithm generated almost 85% of the human-produced expressions for the images. This is slightly lower than the metrics that were calculated for the GRE3D3 and Tuna corpora, which ranged from 86.1% to 90.1%. This discrepancy may be due to the difference in nature of the image sets, as alluded to earlier, since the VOA was initially evaluated on an artificial image set unlike the realistic one used here. Figure 4 below shows a comparison between the human-generated expressions and closest-match model-human-generated expressions for one of the evaluated images. As shown, for this image it was able to generate an exact match for the property set for only the simple 3rd and 5th images. Note that the model output always generated the same type value of “vegetation” because that is what we had set as the ground-truth value for the object type. A more accurate model would take into account the variation in object types that people use, as in the case here, where all but two of the users used a different noun to refer to the object.
Correlation Between Use and Value of Attributes
We then calculated some key statistics on the 7,000+ expression set in order to find correlation between the use of attributes with the values of the attributes. We created distributions for each of the attributes.
We created a distribution of the color words used, and found, unsurprisingly, that the primary colors are used most often, with the color “white” used significantly most often.
Human-Generated Expressions Model-Generated Expressions
1. <location: above, type: vines> (vines above guy)
2. <location: behind, color: green, type: plants> (green plants behind the guy) 3. <type: trees> (the trees)
4. <type: bush, location: behind> (the bush behind the man)
5. <type: bushes> (bushes)
1. <type: vegetation> 2. <location: behind, type:
vegetation> 3. <type: vegetation> 4. <location: behind, type:
vegetation> 5. <type: vegetation>
Likewise, the distribution of location words showed that direction words like “right”, “left,” “low,” “top, and “bottom” were used most frequently, with order words like “first,” “second,” and “third” also being used, though less commonly.
The distribution of size words showed that “small” and “large” were used most commonly, with “tiny” and “big,” words which convey the same meaning, being used significantly less
We also studied how the presence of other objects of the same type impacted the referring expression by calculating P(number word used | number of objects of the same type). The figure below shows the results, which roughly follow a skewed normal distribution. When there were 8-10 objects of the same type, the probability of using a number word peaked at 33%, while the probability troughed at less than 5% when the referent object was one of only 1-2 of that type in the image, as to be expected.
We also calculated P(size word used | relative size of the object in the image), and found that this yielded an interesting distribution with two peaks–one when the object was very small, or
image. When the object was very large, constituting greater than 80% of the image, the
probability of using a size word was about 1%. This is to be expected, since such large objects tended to be objects that are expected to be large, such as the sky and bodies of water; thus, this may suggest that size words are more likely to be used when they convey interesting, unexpected information about the object.
We also studied the impact of the object’s 2D-location in the image on the selection of a location word by calculating P({specific size word} | object’s x,y location) for each of the size words. There were interesting correlations for specific size words, but not all, so here we highlight the charts that conveyed the most interesting information.
bottom bunk”) rather than to the absolute position within the image and also possibly due to the loss of precision due to the fact that an image is a 2-D representation of a 3-D scene.
As to be expected, the points of the plot for use of the words “left” and “right” were for the most part clustered towards the left and right halves of the image, respectively; points that did not meet this trend were again likely due to the location words being used with reference to another object (i.e. “car to the right of the tree”) rather than to the absolute position within the image. This suggests that an advanced algorithm would pay attention to the use of other objects as points of reference.
The use of the word “middle”, on the other hand, did indeed correlate strongly with the object being near the middle of the picture. This suggests that location words are used differently, some such as “middle” more often being used with respect to the object’s absolute location in the image and others such as “top” and “bottom” with respect to other objects in the image.
4. Conclusion and Future Work
evaluation. One of the shortcomings of the Visible Objects Algorithm is that it assigns the same weight, αattribute , for each attribute. Thus, it adds a size word to the generated property set with the same likelihood for objects of all different sizes, and for instance, does not discern between using a size word given that the object is large and given that the object is small. However, with the analysis of the data we generated through ReferIt Game and Amazon Mechanical Turk, we found that this blind approach is not a good approximation of human referring expression generation. Thus, this algorithm can be improved by taking into account the set of statistics we identified pertaining to the probability of a certain attribute being used by humans given the actual visible value of the attribute.
One of the key takeaways from the statistics we generated is that often, other objects are used in order to refer to the target object, such that the referring expression is based on attributes relative to another object rather than the object’s independent attributes. A next step for creating a more intelligent algorithm would be to take this into consideration, and also to identify which such objects have high rank and are most likely to be used in such a way. For instance, one question to explore is how the presence of objects with high significance, such as humans, impact the
generated expression for non-human objects. How likely is it that the human-generated expression describes the referent with respect to the person/people? Since knowing the spatial relations between objects would be needed in order to implement this, introducing a graph-based component similar to the Graph-Based Algorithm or the LongestFirst Algorithm for REG may be a good starting point (Viethen 2013).
Another angle of approach would be to consider the frequency with which people pair two different types of attributes, in order to determine whether two attributes, such as color and size, are typically used together or mutually exclusively.
Other studies have noted frequent occurrences of part-whole modularity, where speakers refer to parts of an object within reference to the whole. This has received little attention in REG
research, and this is an indication that it should be studied further (Mitchell 2013).
Furthermore, although perhaps this is the more difficult step, this algorithm only generates the property set, and does not actually create the expression in the form of a noun phrase. In order for a referring expression generation algorithm to be viably used in a computer vision setting, it would need to be able to form coherent noun phrases, taking into consideration the ordering of words and the addition of articles such as “the.” Thus, this issue needs to be addressed.
Lastly, the visual attributes used in evaluating this algorithm were already provided as text input. In order to create a truly artificially intelligent model, such a referring expression generation algorithm would need to be coupled with computer vision and image classifiers that can parse visual attributes such as color, size, and location.
5. Acknowledgements
6. References
Berg, Alexander C., Tamara L. Berg, Hal daume III, Jesse Dodge, Amit Goyal, Xufeng Han, Alyssa Mensch, Margaret Mitchell, Karl Stratos, and Kota Yamaguchi. 2011. An
exploration of how to learn from visually descriptive text. JHU-CLSP Summer Workshop Whitepaper.
FitzGerald, N. and ARtzi, Y., and Zettlemoyer, L. (2013). Learning Distributions over Logical Forms for Referring Expression Generation.
The IAPR Benchmark: A New Evaluation Resource for Visual Information Systems, Grubinger, Michael, Clough Paul D., Müller Henning, and Deselaers Thomas ,
International Conference on Language Resources and Evaluation, 24/05/2006, Genoa, Italy, (2006).
Michael Grubinger. Analysis and Evaluation of Visual Information Systems Performance. PhD Thesis. School of Computer Science and Mathematics, Faculty of Health, Engineering and Science, Victoria University, Melbourne, Australia, 2007.
Mitchell, M., and van Deemter, K., and Reiter, E. (2013). Attributes in Visual Reference.
Proceedings of PRE-CogSci 2013.
Mitchell, M. and van Deemter, K., and Reiter, E. (2013). Generating Expressions that Refer to Visible Objects. Proceedings of NAACL 2013.