INNOVATION IN THE OIL FUTURES MARKET:
EXPANDING FIXED-RATE CONTRACTS INTO THE CONSUMER FACING RETAIL MARKET
Shane I. Goronkin
An honors thesis submitted to the faculty of the Kenan-Flagler Business School at the University of North Carolina at Chapel Hill
Chapel Hill 2016
Approved by:
___________________________ (Riccardo Colacito, Ph. D., Thesis Advisor)
___________________________ (Venkat Kuppuswamy, Ph. D.,Reader)
___________________________
iii ABSTRACT Shane I. Goronkin
Innovation in the Oil Futures Market: Expanding Fixed-Rate Contracts into the Consumer Facing Retail Market
(Under the direction of Riccardo Colacito, Ph.D.)
The oil industry is constantly plagued by radical shifts in supply and volatile fluctuations in prices. Many of the industry’s largest consumers will adopt price
iv
ACKNOWLEDGEMENTS
The successful completion of this thesis could not have been accomplished alone, and for that reason I would like to recognize some of the key individuals who have contributed to this work. Thank you.
To Dr. Riccardo Colacito, advisor, for the constant support and guidance
at all times in the midst of executing your own research
To Dr. Patricia Harms, Proposal Director, for your passion and dedication
to your students’ pursuit of excellence
To Travis Sheetz, Executive Vice President of Operations at Sheetz, Inc.,
for offering his assistance in the testing of this research and for generously providing the necessary information to execute the test model
To Patti Carlson, Chief Operating Officer at First Fuel Banks, for offering a
considerable amount of time in meetings and on the phone to share a great deal of information about the FFB organization
v
TABLE OF CONTENTS
ABSTRACT ... ii
ACKNOWLEDGEMENTS ... iv
LIST OF TABLES ... vii
LIST OF FIGURES ... viii
LITERATURE REVIEW ... 1
Introduction ... 1
The consumer market for gasoline and its pricing system issues ... 2
Innovations in the gasoline retail industry ... 5
History, current uses, and potential development of crude oil futures contracts ... 7
RESEARCH METHODOLOGY ... 12
Introduction, Research Question, and Terminology ... 12
Research Method 1: Case Study ... 13
Reasoning behind methodology selection ... 13
Overview of the case study ... 13
Objectives of the case study ... 14
vi
Research Method 2: Financial Model ... 18
Reasoning behind methodology selection ... 18
Overview of the financial model ... 18
Objectives of the financial model... 19
Components of the financial model ... 19
RESEARCH ... 21
Section 1: Case Study ... 21
Overview ... 21
Stakeholder Interview ... 21
Customer Interviews ... 24
Financial Analysis of Contract Profitability ... 27
Interpretation ... 29
Section 2: Financial Analysis of Sheetz, Inc. Model Adaptation ... 30
Overview ... 30
Analysis ... 30
Results ... 36
Additional Insights ... 42
RECOMMENDATION, RISKS, AND CHALLENGES ... 45
Recommendation ... 45
Risks and Challenges ... 47
FUTURE RESEARCH OPPORTUNITIES ... 53
APPENDIX ... 57
vii
LIST OF TABLES
Table 2.1 First Fuel Banks Financial Profitability Results... 29
Table 2.2 UGA & Sheetz Correlation ... 31
Table 2.3 UGA & Sheetz Regression Output ... 32
Table 2.4 Variables and Computations for Sheetz Financials ... 35
Table 2.5 Sheetz Financial Results ... 36
Table 2.6 Sheetz Contract Profitability per Period ($) ... 37
Table 2.7 Sheetz Contract Profitability per Period (%) ... 37
Table 2.8 Customer Financial Results ... 39
Table 2.9 Customer contract Profitability per Period ($) ... 40
Table 2.10 Customer contract Profitability per Period (%) ... 40
viii
LIST OF FIGURES
Figure 2.1 UGA & Sheetz Historical Prices ... 31
Figure 2.2 Contract Profitability Levels for Sheetz ... 38
Figure 2.3 Sheetz’ Contract Types between 2008-2016 ... 38
Figure 2.4 Contract Profitability Levels for Customers ... 41
Figure 2.5 Customer Contract Types between 2008-2016 ... 41
Figure 2.6 Maximum Contract Return Potential ... 42
Figure 2.7 Duration of Contracts at Maximum Return ... 42
Figure 2.8 Price Ceiling Protection for Sheetz and Customers ... 43
Figure 2.9 Contract Durations at Exercise Thresholds ... 44
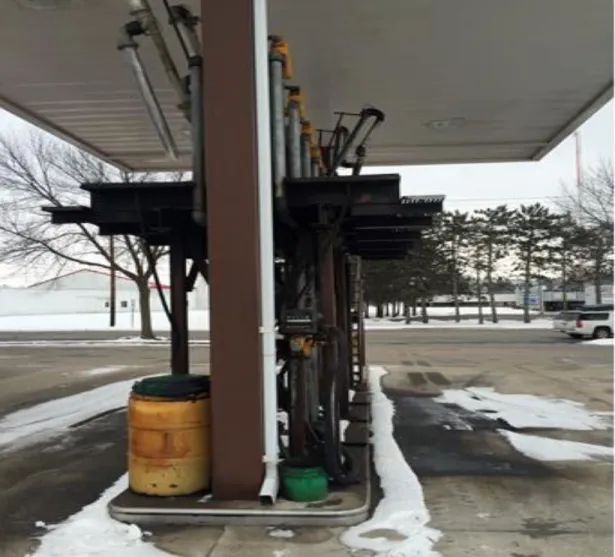
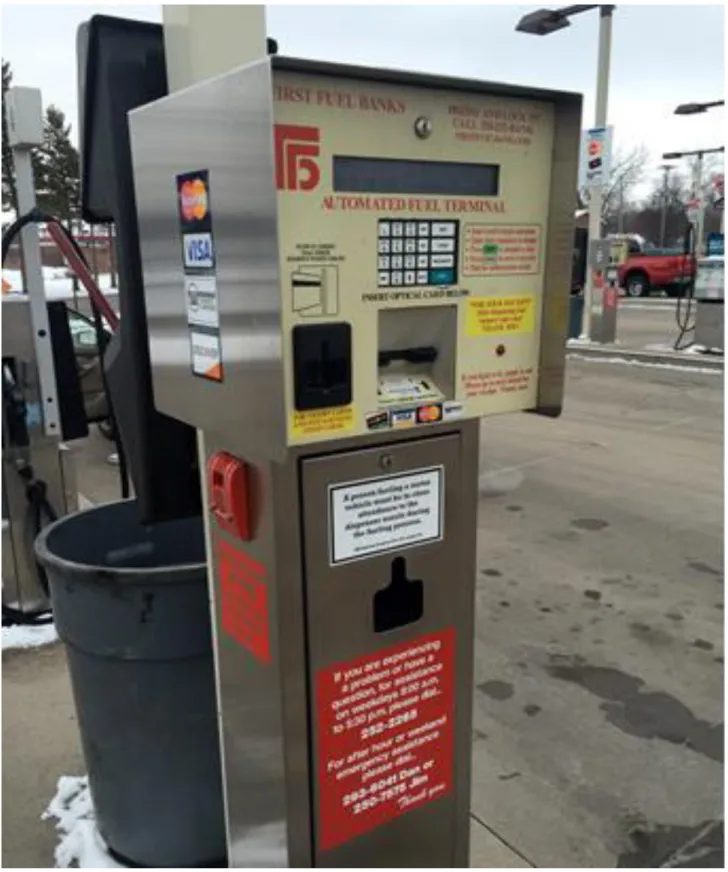
Figure 3.1 Retail Fueling Stations at FFB ... 56
Figure 3.2 Bulk Fueling Stations at FFB ... 57
Figure 3.3 FFB Membership Explanation Signage ... 58
1
LITERATURE REVIEW
Introduction
In order to find success in the ever-changing business arena, companies must find new ways to innovate and differentiate themselves from their
competitors. One industry in particular, however, has neglected to adapt itself, resulting in a hyper-commoditized marketplace. The retail gasoline market has been labeled by some researchers as “too close to be similar,” which is
exemplified through the intense price competition seen among players (Iyer & Seetharaman, 2008). Some gasoline retailers have attempted to differentiate themselves through experience differentiation or by offering auxiliary goods and services—ample research has analyzed the effectiveness of these activities. As
few as one consumer retailer has implemented a differentiation strategy through a fixed-price gasoline contract. Interestingly, while much research has been published on the general use of futures contracts in price hedging strategies, minimal analysis exists on the use of futures contracts for consumer gasoline consumption. This thesis serves as a means to fill this apparent void in academic knowledge.
2
innovations in the gasoline retail industry, and (3) the history, current uses, and potential development of crude oil futures contracts.
The consumer market for gasoline and its pricing system issues
Gasoline usage characterizes the typical American lifestyle, and the volatile price of the fuel source has far-reaching effects on the entire population. The United States is responsible for a significant amount of gasoline
consumption compared to its peer countries. With the population of about 315M, or only 5% of the global population, the U.S. consumes 20% of all global energy. Indeed, the U.S. gasoline consumption surpasses that of South America, Europe, Africa, and Asia combined (Hassan & Regassa, 2012). Although a significant portion of gasoline is used commercially, the average U.S. household spends nearly $1,000 each year on gasoline (Wadud, Noland, & Graham, 2010). With the global market liberalization of oil and gasoline prices, retailers must
constantly modify prices, which transfers price risk onto the consumers. Beyond the traditional concept of free-market supply and demand, however, research suggests that pricing is affected by many more factors.
The U.S. Energy Information Administration (2015) segments the retail price for gasoline into four divisions: Crude Oil, Federal & State Taxes,
3
as the secondary cost component. As a bi-product of crude oil, gasoline prices are strongly correlated with the fluctuations of crude oil prices. A macro-level viewpoint suggests that major shocks to gasoline supply and demand will be the driving factors that move gas prices. For example, a refinery fire, presidential party changes (Ahmadian, 2011), or a natural disaster could all create a supply shock and price increases that are not market driven (Kilian, 2010). These price changes are largely uninfluenced and unavoidable by the average consumer. Research at a micro-level perspective, however, suggests that statistically significant differences in pricing techniques occur within individual geographic markets.
Gas supply and demand vary greatly between markets as well as within markets. In 2010, Wadud, Noland, and Graham researched the correlation between U.S. gasoline demand and socio-economic differences among households. The findings demonstrate that price responses indeed vary with demographic variables such as income, multiple vehicle holding, presence of multiple wage earners, or rural or urban residential locations. Wadud et al. further argue that regions of certain demographics will have micro-demand shifts that are significantly different from other regions. While Wadud et al. (2010)
4
unleaded. He also notes that stations with additional goods and services
offerings—such as a convenience store or service bay—actually charge less for
gasoline. Ngo believes this pricing strategy is an effort to attract customers to purchase higher-margin items such as beverages or cigarettes. The variety of micro-level gas price factors along with the constant influence of macro-level moves creates a very unpredictable market.
Massive fluctuations have become normal when considering gas prices, and the U.S. economy is strongly affected by such movements (Godeck &
Murray, 2012). Research by Godeck and Murray (2012) suggests that Americans extrapolate movements in gas prices to be reflective of the overall status of the economy and price spikes create far-reaching effects on disposable spending. The researchers conducted a number of experiments that revealed gas prices as the common mental meter for personal spending allowances; increased gas prices strongly resulted in the decrease of overall spending. Consumers typically decreased spending by eating out less and the shift in gas prices increased the likelihood of canceling trips, using alternative transportation, or moving closer to work or school.
5
competitive pressures. Although this increased competition could be of benefit to the consumer through lower prices of the goods, the added value is offset by the spike in gas price spending. These academic works reveal that the highly volatile gasoline marketplace places a heavy burden on the average American.
Removing the constant shifts and spikes in this industry could be immensely valuable by providing the ability to accurately plan and prepare for future
expenditures and stabilizing current expenses— innovations in the gasoline retail
market may exploit this opportunity, particularly through the use of futures contracts.
Innovations in the gasoline retail industry
6
(2) pay-at-pump option, (3) car wash facility, (4) convenience store, (5) service bay, (6) full-service pumps, (7) recognized brand-name, and (8) 24-hour
operations. These additional offerings allow gas retailers to differentiate themselves and in turn seek higher margins on gasoline. Additionally, in the research done by Ngo in 2003, he found that a strongly recognized brand name allows the retailer to sell gasoline at a significantly higher price.
Companies can also use the sale of gasoline to attract customers into higher margin shopping. For example, Costco often decreases gasoline margins in an effort to drive more traffic into the stores (Wohl, 2012). The company claims that nearly a third of all gasoline customers will also enter the store. The strategy employed by Costco, however, only further suggests that consumers are
attracted to the lowest priced gasoline—a validation of the hyper-commoditized
industry. By altering the pricing model currently adopted by all gas retailers, a company could realize significant differentiation amongst its competitors.
One gasoline retail company in St. Cloud, Minnesota claims that their offering of fixed-rate gasoline contracts has never before been offered to the mass consumer market. This company, First Fuel Banks, has a differentiation strategy that allows customers to purchase bulk amounts of gasoline at current market prices for later withdrawal at one of their six 24-hour stations (Krieger, 2006). This family-run business had well over 10,000 accounts in 2006, 300 of whom were currently paying less than $1 per gallon of gasoline with a market rate of $3.27 (Huffstutter, 2006). First Fuel Banks’ success demonstrates the
7
offering fixed-rate gasoline contracts. An analysis of this business model could fill a void area of academic knowledge and may have an effect on the entire
consumer gasoline retail business model.
History, current uses, and potential development of crude oil futures
contracts
In her book Futures, Emily Lambert (2010) accounts the creation of the futures derivative.Located in the heart of America, Chicago became a
centralized business hub in the 1830s after a man-made canal connected the Great Lakes to the Mississippi River. In the springtime, ice would thaw and farmers could transport their goods by water or across muddied roads. Local merchants purchased the farmed goods and would in turn find final buyers to use the crop. This system of trading faced many issues largely attributed to the highly sporadic weather conditions; buyers and sellers were unable to accurately
forecast future season productions and prices. Therefore, on March 13th, 1851, a seller signed the first documented contract to deliver three thousand bushels of corn the following June for a price that was $.01 cheaper per bushel from the current March price. This type of contract quickly spread to grain in the mid 1850’s and the contracts were often traded numerous times before finally
8
The futures market continued to evolve and expanded; a new futures trading floor soon opened in New York City. Beyond corn and grain, the market traded pork, cattle, currencies, mortgages, stocks, bonds, and even energy—
such as oil. During a potato shortage in May of 1976, however, two traders artificially inflated the price of an already surging potato futures contract that lead to the default of over 1,900 contracts representing 100 million pounds of
potatoes. This default resulted in stringent regulations placed on the New York Mercantile Exchange and heightened the fears of traders. The president of the exchange, Michel Marks, decided to explore alternative types of contracts. Knowing that a volatile price was a necessary element for a futures contract, he considered crude oil. In the 1980s, Iran’s Ayatollah Khomeini incited the political
interest of Americans by spiking oil prices. Soon, heating oil retailers became increasingly interested in securing a locked price for their products. In 1986, gas prices plummeted due to an unexpected amount of crude oil imports, which created a strong desire for major consumers of the product to lock in low-rates. Specifically, airlines, heating oil companies, and retail gas station owners
purchased these contracts at the exchange. Following, crude oil trading became the most recognized and speculative type of contract within futures trading.
Today, the use of futures contracts has been adopted beyond farmers and financial institutions. These contracts are frequently exchanged until a final buyer purchases them—airlines and the U.S. military are two such buyers. In his
9
expenditures. Further, total output and consumption rose modestly, which lead to significant profit increases for adopters. The underlying premise for the benefit of these contracts is the ability to match individual risk profiles of the producer with the appropriate buyer’s risk profile. Additional research suggests that the
adoption of futures contracts by farmers in deregulated developing countries would substantially benefit the producers as well as the individuals or companies that offer the contracts (Kumar, 2007).
In the United States, futures contracts have historically provided significant value to the institutions that purchase them. Airline companies as well as the country’s military have adopted fuel hedging practices through the use of futures
contracts. Numerous airlines have adopted general hedging practices, some, such as Southwest or American Airlines, employ selective hedging to purchase contracts during opportune market movements (Sturm, 2009).
Carter, Rogers, and Simkins (2006) set out to determine the amount of value that hedging provides to airline companies and discovered that this
“hedging premium” returned to companies could be as large as 10%. According
10
price volatility, smooth the budget, improve cash management, and reduce price distortion caused from internal energy transfers. Spinetta argues that DoD adoption would return significant value to the military organization. These types of contracts, however, are specific to crude oil or jet fuel, which can actually have a strong predictability factor towards gasoline prices.
James Hamilton is an academic expert in finance, with a specific focus on energy markets related to crude oil and gasoline. He has published a
significant amount of work related to futures contracts including Understanding
Crude Oil Prices (2009) and Risk premia in crude oil futures prices (Hamilton &
Wu, 2014). The first mentioned work claims that historic causes for price
fluctuations can be attributed to low price-elasticity, supply vulnerabilities, and the increased production of oil in the U.S. His second mentioned work demonstrates how crude oil futures demonstrate accurate perceptions of future price
11
demonstrate the viability of using crude oil futures as a strong predictive instrument for gasoline futures.
This thesis’ objective is to evaluate the opportunity to offer gasoline
futures contracts to the average consumer, and will seek to determine the best means for gasoline futures prices. The average American is seriously influenced by the changing gasoline prices, which creates far-reaching effects on the larger economy. Beyond the impact on discretionary spending abilities, volatile gasoline prices reduce American’s confidence in market stability (Godeck & Murray,
2012). With annual gasoline purchases surpassing $1,000 per household, the unpredictable prices create widespread forecasting difficulties for the average consumer (Wadud et al., 2010) The offering of fixed-rate gasoline contracts could mitigate the undesired effects of the volatile market. By researching this apparent void, this thesis seeks to offer critical insights and recommendations regarding an alternative use of futures contracts for the retail gasoline market. This new
12
RESEARCH METHODOLOGY
Introduction
The purpose of this section is to outline the research methods that will be
required for the successful examination of this topic. The research methodology will seek to answer the research question stated below by (1) a qualitative case study analysis and (2) a financial model to examine the historical performance of the proposed instrument. This study will incorporate stakeholder interviews, informal customer interactions, as well as various other means of data collection and analysis.
Research Question
Does an unexploited opportunity exist for the average gasoline
consumer in the marketplace of oil futures contracts? If so, how might
this opportunity be exploited?
Terminology
Futures Contract: A binding agreement to make a future trade for a
13
are often used for commodities (such as gold, corn, or oil) to lock-in the future price of the goods at a present time.
Price Hedging: Hedging practices can be understood as an insurance instrument
which protects the user from potential downside risk of the underlying asset. A user can “hedge” away certain risk (such as the risk of price increases for
gasoline) through various price hedging strategies. One strategy to hedge the risk of gas price changes could be achieved through the purchase of a futures contract.
Research Method 1: Case Study
Reasoning behind methodology selection
Currently, minimal published research exists on the topic of general
consumer use of futures contracts for gasoline. However, one organization has been identified which currently sells a fixed-price gasoline product. The use of a case study on this company will leverage its historic
performance and existing business model to produce an evaluation of the market opportunity.
Overview of the case study
14
located in St. Cloud, MN, allows customers to purchase fixed-price contracts for gasoline at their retail stations. Although it has been established for over 30 years, minimal attention has been given to their unique product.
A case study of FFB will offer insights into both the feasibility of entering the market as well as an understanding of the market demand for the product. The study will consist of research into the minimal amount of publications on the company as well as a multi-day site visit to the organization. The site visit will include personal interviews with
management as well as customers. These discussions will aim to illustrate the market potential and feasibility for a larger exploitation opportunity. Further, the case study will incorporate a variety of research techniques including interviews, observational studies, as well as pure data analysis.
Objectives of the case study
15 Components of the case study
1. Key Stakeholder Interview
On-site interviews will take place in late December or early January. Preliminary scheduling and introductions will take place through phone and email communication during November and early December. I will work with the leadership team to organize individual interviews with Key Stakeholders including Jim and Dan Feneis. Jim and Dan are the sons of the founder, Denis, and are currently in charge of the business’ day-to-day
operations. Following the preliminary discussions with Jim and Dan, I will determine the necessity of speaking with other individuals in the
organization.
Interviews will be conducted on-site and the audio will be recorded
electronically with the permission of the interviewee. The broad aim of the stakeholder interviews will be the gaining of a holistic understanding of the business history, products, and management. Each discussion will
specifically analyze the operational aspects of the business which includes the topic of price setting, contracts, memberships, and risk hedging among other topics that arise during the discussions.
2. Informal Customer Surveys
16
transferred or recorded during these interviews. Following discussions with FFB management, I will conduct verbal interviews. The sample pool of individuals to be interviewed will be randomized based on time of interaction and location of FFB site.
Customer interviews will offer valuable insight regarding the second case study objective: evaluate market demand for this marketspace. These interviews will attempt to analyze the following topics through written or oral questions:
A. History of relationship with FFB B. Reasoning for using FFB C. Price sensitivity
D. Typical demand
E. Alternate sources of gasoline F. Issues/pain points
3. Financial Analysis (if possible)
17
This information would be extremely valuable in assessing both objectives and would allow me to determine the profitability likelihood of this business model. Further, this data would enable me to create an end-to-end
process map for the businesses supply chain through a cash flow analysis.
4. Relevant Publications
Although minimal published research exists on First Fuel Banks, some media attention has covered this business. A complete case study will offer a balanced viewpoint from all publication sources. All publications will be examined and described in the Literary Review section of this
document. Below are two examples of newspaper articles covering FFB’s
business model:
Huffstutter, P. J. (2006, May 28). Minnesota gas-club members cash in amid rising fuel prices. Orlando Sentinel, p. A2. Orlando, Fla., United States.
Krieger, Michael. (2006). First Fuel Banks in St. Cloud seeing results of rising gas prices, media coverage. Finance & Commerce
(Minneapolis, MN): Newspaper Source Plus. Retrieved from:
18
Research Method 2: Financial Model
Reasoning behind methodology selection
In conjunction with the case study, a financial analysis of this new
opportunity will yield insights into the degree of profitability for a fixed-rate product. While the lasting history of First Fuel Banks and their lack of debt suggests a profitable business model, a more in-depth analysis will be able to offer a more convincing representation of the financial opportunity.
Overview of the financial model
This model will seek to represent the business opportunity in question in an effort to determine the size of financial opportunity. It will be based on the historical performance of a target company in the hypothetical situation of offering this fixed-rate product to their customers. Leadership from the Sheetz, Inc. has agreed to participate in this study and will offer data and insight in order to create an accurate and predictive model.
Based on the amount of existing data available, the model will analyze the time on a weekly basis between March of 2008 and the end of January 2016. The primary source of data will be from Sheetz, Inc. and a
19
key insights from the model will be included in the main body of the
research section, while much more information will be included in the end section of this document.
Objectives of the financial model
1. Amount of value creation for target company: Sheetz, Inc. 2. Amount of value creation for target company customers
Components of the financial model
The model will be designed in order to create a flexible and adaptable system through which many different scenarios can be easily depicted. A few of the key inputs and outputs of the model are listed below:
Inputs:
Starting date of contract
Ending date of contract Premium paid per gallon
Size of contract (in gallons)
Number of purchases (monthly)
Outputs:
Length of contract Beginning price at retail
20
Beginning price of depository instrument Ending price of depository instrument
Logical exercise (yes/no)
Sheetz Profit ($) Sheetz Return (%)
Customer Profit ($)
21 RESEARCH
Section 1: Case Study
Overview
Currently, only one company in the United State has commercialized the offering of fixed-price gasoline contracts to the general public. This company, First Fuel Banks, is a family business based out of St. Cloud, MN with six retail locations which all offer the ability for customers to lock in a current gasoline price. Minimal publications have analyzed this company, and therefore a case study is a necessary step in the effort to evaluate this largely unexploited opportunity.
This case study encompasses a number of elements including:
Stakeholder Interview
Customer Interviews
Financial Analysis of Contract Profitability
Stakeholder Interview
In 2016, First Fuel Banks (FFB) experienced a significant amount of change. The changes, led primarily by the passing of a long-time company executive, come after more than 30 years have been spent building this successful company. On Jan 7th, 2016, I met with Patti Carlson who serves as the Chief Operating Officer of the
22
presented in this section, unless otherwise noted, comes from the conversations with the
COO.
East Side Oil Companies (ESOC) first began operating in the mid-1970s and has expanded into four main lines of operations: (1) Sand Blasting, (2) Bulk Fuels, (3) Commercial Oil Recycling, and (4) First Fuel Banks. The oi recycling line of business has been noted as the most profitable line and was classified as the “cash cow” of operations—the profit generated by this division helps cover any losses that may occur
in the other three divisions. Furthermore, the oil recycling line is the oldest and most established line of revenue for the company.
Technological developments in the 80s allowed FFB to offer the first fully automated fueling station—this meant that an attendant was not necessary for the dispensing of
gasoline and the company was therefore able to reduce the retail price for its customers. At the time, a two-cent movement in gasoline prices was considered a significant price change. The owners, Jim and Dan Feneis, attempted to address this concern by further developing the automated station to allow their oil-dependent customers to lock-in a current gas price. Some of the early adapters were able to lock-in rates of $.78/gallon and continue to benefit from this investment today.
The company places a significant amount of trust in people—Although possible, it doesn’t believe that customers will exploit the fuel bank products. While customers could
use the FFB fixed price products as an opportunity to make a long-term financial investment, the typical (and expected) customer uses the product for a short- and mid-term operational investment; the difference between the investments is that an
23
benefit a local transportation company that needs to accurately predict fuel prices over
the course of several months or years.
Along with the company’s belief in trust, ESOC is committed to offering the lowest and
most transparent pricing model to its customers. Company leaders have a strong dislike for credit cards, added fees, debt, and taxes. Pricing, therefore, is based entirely on the cost of the input gasoline instead of other factors such as demand or competitor prices. The daily price of gasoline is simply the price at the refinery (RAC), transportation costs, and taxes. The only addition is a few cents to cover operating costs.
A clear competitive advantage and distinction with the FFB operating model is that the company has significant storage capacity. Instead of hedging price fluctuations with various financial instruments, the company will actually store the physical gasoline that has been purchased on a fixed-rate contract; FFB has over a million gallons of gasoline storage capacity. Therefore, when a customer wants to lock in 1,000 gallons at the current price of $2.00/gallon, then FFB will physically store the 1,000 gallons in its own tank and will deposit the $2,000 in low-risk and highly liquid investments until the customer decides to exercise the right to purchase the gasoline at the stated rate.
While the company has explored the option of using futures contracts to better hedge themselves against significant movements in gasoline prices, the leaders have noted the volatility and inaccuracy of contract prices to be dissuading.
24
simple $1.00 initiation fee which limits the local government’s ability to regulate these
interactions.
A noted opportunity for FFB would be to limit the duration of the contracted fixed-rate products. Currently, no time expiration is set for the contracts—this results in the
opportunity for some customers to exploit the system and use the deposit as a long-term financial investment which causes a significant amount of increased time and
management effort to be spent.
Customer Interviews
Following the guidance of FFB leaders, I spoke with a number of customers at various fuel bank locations regarding their experiences with the company and the fixed-rate product. While no personal information was recorded, a number of insightful elements were presented during these discussions. Over 40 customers between two fuel bank locations contributed to the following compilation of information which has been extrapolated to make interpretations about the typical customer of First Fuel Banks.
Demographics
A very diverse range of demographics was represented during the site visits. While some customers were in their late 20s, others were in their upper 60s. All of the customers either live or work in the greater St. Cloud area. An estimated 2/3 of the customers were retail customers while 1/3 of the customers were purchasing gasoline for business purposes. Notably, a police officer typically fills
25 History of relationship with FFB
Out of all customer interactions, not a single individual was, at the time, visiting the FFB location for the first time. Furthermore, one of the older customers noted that she had been purchasing fuel from FFB for over 20 years. A surprising amount of customers were very familiar with the business model and product offerings from the company; very few were unaware of the fixed-price contracts available. When asked about their first interaction or motivation to come to FFB, customers were typically unclear or cited a friend’s referral. Many customers also
mentioned their personal loyalty and suggested that they had referred others to the station and see themselves continuing to purchase fuel from FFB.
Reasons for using FFB
While the majority of customers have been loyal to FFB for a long time, the relationship was not the primary driver in purchasing from FFB. Rather, price was overwhelmingly stated as the primary reason for using FFB. Price was stated by both individuals using the rolling (variable) priced gasoline as well as the Locked (fixed) gasoline. First Fuel Banks was noted to have significantly cheaper
gasoline than the rest of the St. Cloud-area retailers. In fact, one customer in particular stated that he is a lumber sales representative and his manager requests that he and his co-workers use FFB gasoline before they leave to drive to client locations due to the low-priced fixed contracts that the company has
entered.
Pricing, demand, and competitors
26
comparing the price to competitors. Nearly a quarter of the customers stated that they will also purchase gasoline at Sam’s Club because prices are comparable
and they can shop at the club while FFB does not offer a convenience store. When asked about general demand and consumption, few had confident answers but feel into a range of $50-$150/month on fuel for the individual retail customer. Business customers, however, spend considerably higher amounts on fuel. One customer stated that he uses a locked account for his business fuel and could tell me the exact amount he spends since FFB tracks the usage on his membership card—he was unsuccessful, however, in retrieving
Issues
During these conversations, three issues arose that are worth noting. First, the company does not have a convenience store, as mentioned, which some
customers desire. Patti Carlson, COO, stated that they have decided not to build a store because it is out of their core competency and could end up with the price of gasoline increasing to make up for the additional costs. Second, customers regularly mentioned that the gas stations are not conveniently located and have a very limited geographic reach. Patti mentioned that their dedication to remaining debt free has limited their ability to grow quickly to new areas and open new stations. Third, in regards to the fixed-price contracts, two purchasers noted the risk that comes with the contracts. One lightheartedly said that she feels the urge to drive more when she has a low locked-price in order to use up the cheap
27 Financial Analysis of Contract Profitability
Data
The amount of reliable data provided by the FFB management team has been extremely limited. During the interview with COO Patti Carlson, the following information was provided in a “guestimation” maner:
Annual gasoline revenue per station: $2M
Percentage of fixed and pre-paid transactions: 66%
Storage cost per gallon for 1 year: $.10 (well below industry average of
$.25)
Profit mark-up per gallon: $.03-.05
Typical duration of fixed-price contracts: 1-7 years
Typical return on deposits: 3-4%
Per request to FFB accountant Danette K. Burlet, I received external pricing data
for the following three products from 2008-2015:
Prepaid Locked Account: customers purchase gasoline at the stated
discounted price and can choose when to redeem the product
Prepaid Rolling Account: customers deposit cash funds in advance and
receive a discounted from the current market price
Pay at Pump: customers can purchase gasoline without the pre-payment
28 Computations
By analyzing the provided information, the fixed-price contracts demonstrate profitability within a certain time frame. The following section describes the yearly incremental profit that one fixed-price gallon of gasoline can yield.
Formula:
𝜋
𝑛
= 𝜋
𝑛−1
∗ (1 + 𝑟)
𝑛
− 𝐶
Where:
𝜋 @ 𝑌𝑟 0 = $. 541
Profit at the time of contract origination is considered to be the premium paid compared to the market-priced rolling product. Between 2008-2015 the average premium paid is $.541 with a minimum of $.15 and a maximum of $1.11. The full comparison of prices is included at the end of this section.
Defined:
Π=profit per gallon
n=years since contrat origination
r=expected annual return on deposits
C=Annual storage cost per gallon
Assumptions:
29
Expected annual return on deposits is between 3-4% (I use 3.5%)
All inputs are constant (i.e. premium, storage, return)
Contracts end at the end of year and therefore incurr an entire year of
costs and returns
Results:
(Table 2.1)
Interpretation
First Fuel Banks can expect to make an incremental profit by offering
fixed-rate contracts with durations up to 10 years and through physically
storing the prepaid gasoline until usage.
Year 0 1 2 3 4 5 6 7 8 9 10
Profit
Per
Gallon
30
Section 2: Financial Analysis of Sheetz, Inc. Model Adaptation
Overview
The objective of this research section is to determine the amount of value creation that a fixed-rate contract could provide to the retailers and consumers of the product. Sheetz, Inc. is one of the largest privately-held retailers of gasoline in the United States and has agreed to serve as the model organization for this analysis. The company has offered the necessary data to perform this analysis, which has included the weekly retail gas prices for Altoona, PA and Richmond, VA between 2005-2016.
Compared to the case study research which considered the price-fixing method through the physical storage of gasoline, this section will analyze the possibility of adopting the practice through the use of futures contracts. Similar to crude oil, gasoline has futures contracts that are traded on the New York Mercantile Exchange in massive quantities. An exchange-traded-fund (ETF) with the ticker UGA was created to match the
percentage-based price movements of the futures contracts of gasoline. The ETF is highly liquid and has a relatively low expense. This research will use UGA as the investment vehicle for gasoline futures.
Analysis
This research will perform a retrospective analysis between 2008-2016 considering the use of UGA-priced gasoline futures as a price hedging strategy for Sheetz, Inc. to sell
fixed-price contracts.
Data & Inputs
Weekly UGA closing price 2/28/08-2-29/16 (via Yahoo! Finance)
31 Data trends and relationships
Graphed movements (scaled):
Correlation:
UGA Adj Close
Date Match Altoona
UGA Adj Close 1
Date Match
Altoona 0.936134949 1
(Table 2.2) $0 $10 $20 $30 $40 $50 $60 $70
UGA Adj Close
14 gal of Altoona-Sheetz
32 Regression:
Regression Statistics Multiple R 0.936134949 R Square 0.876348642 Adjusted R
Square 0.876052116
Standard Error 4.390209197
Observations 419
ANOVA
df SS MS F
Significance F Regression 1 56961.90605 56961.91 2955.385 2.206E-191
Residual 417 8037.231641 19.27394
Total 418 64999.13769
Coefficients
Standard
Error t Stat P-value Lower 95%
Upper 95% Intercept -16.08824 1.146422 -13.9865 1.01E-36 -18.295819 -13.78633 Date Match
Altoona 19.46338 0.35709 54.36345 2.2E-191 18.757827 20.165219
33 Data trend and relationship interpretation
By considering the graphed movements over time, the correlation, and the regression between Sheetz’ Altoona Market and the UGA index, many important
inferences can be made. To begin, an extremely strong relationship exists between the two data sets. Demonstrated by the correlation analyses, the two data sets have a very strong linear relationship with an r of .936. Similarly demonstrated through the adjusted r square of .876 through the regression analysis, movements between Sheetz’ Altoona gas price and the UGA price are
extremely strongly correlated with statistical significance.
The chart depicting the movements of both instruments over time yields additional information. Most notably, the UGA index moves at a greater
magnitude and volatility compared to Sheetz’ Altoona market. During downward
trend movements, UGA will quickly surpass Altoona in a negative price change. Inversely, upward trends movements are demonstrated by a much faster
recovery through the UGA index. This relationship can be clearly seen during the highly volatile period between 3/1/11 and 8/1/14. Sheetz, as demonstrated in the Altoona market prices, offers gasoline prices that move in a more stable and controlled manner than the market’s perceived futures prices as demonstrated
34 Assumptions & Parameters
In order to model the financial landscape of the fixed-contract implementation, a number of important assumptions and parameters were included. In general, assumptions follow conservative predictions and are based on the current business situation for Sheetz, Inc.
The primary assumptions are stated as follows:
Customers exercise contracts on a logical basis (i.e. exercise only if market
price is above contract price)
Fixed-price premium will be 3% over stated current market price
Gas prices are similar throughout all retail outlets in Altoona Market
All UGA positions are entered at the end of the week
UGA trading expenses are considered immaterial
Sheetz’ pricing behaviors will not be influenced by UGA movements or
contract purchases
Altoona market prices are representative of the entire Sheetz’ pricing strategy
The primary parameters are stated as follows:
Average contract purchase size is 100 gallons
A period is any combination of months between March 2008 and January
2016
Each store sells two contracts for each period
Contracts are exercised in full during the month of exercise
Contracts will be exercised when market price is above contracted price
Contracts cannot be exercised during the same month of purchase
35
All contracts are entered on the 1st day of every month
Customer value will be considered to be the difference between market price
and contracted price
Variables and Computations
Name Description Formula
Start_Date: Starting date of contract =[MM/01/YYYY]
End_Date: Ending date of contract =[MM/01/YYYY] Length: Contract duration in
months
=(End_Date)-(Start_Date)
Beg_UGA UGA price at start date =match(Start_Date)
Beg_ATL Sheetz’ Altoona price at start date
=match(Start_Date)
Premium Contract premium price =.05*Beg_ATL
UGA _Shares # of UGA shares purchased
=(Premium+Beg_ATL)/Beg_UGA
UGA _Inv_Beg Value of UGA investment =UGA_Shares*Beg_UGA End_UGA UGA price at end date =match(End_Date)
End_ATL Sheetz Altoona price at end date
=match(End_Date)
UGA _Inv_End Value of UGA investment =(UGA_Shares)*(End_UGA) Inc. Profit Incremental Profit =(UGA_Inc_End)-(End_ATL)
Logical Exercised? Contracts will be used only when logical
36
Sheetz Profit % Relative to market price =(End_UGA)/End_ATL
Customer Profit % Relative to market price
=(End_ATL-Beg_ATL-Premium)/(Beg_ATL+Premium)
(Table 2.4)
Formulas
When End_ATL>(Beg_ATL+Premium), Sheetz Profit ($) =
𝜋 = [𝐸𝑛𝑑𝑈𝐺𝐴∗ (
𝐵𝑒𝑔𝐴𝑇𝐿+ 𝑃𝑟𝑒𝑚𝑖𝑢𝑚
𝐵𝑒𝑔𝑈𝐺𝐴 )] − 𝐸𝑛𝑑𝐴𝑇𝐿
When End_ATL>(Beg_ATL+Premium), Customer Profit ($) =
𝜋 = 𝐸𝑛𝑑𝐴𝑇𝐿− 𝐵𝑒𝑔𝐴𝑇𝐿
Results
Sheetz:
Total Incremental Profit $167,000,000
Avg π Per Year $20,900,000
Avg π Per Exercised
Period
$76,000
Avg π Per All Periods $37,400
Avg π Per Exercised
Contract
$60.91
Avg π Per Exercised
Gallon
$0.61
37 Snapshot of per-period profitability ($)
Snapshot of per-period profitability (%)
Oct-08 Nov-08 Dec-08 Jan-09 Feb-09 Mar-09 Apr-09 May-09 Jun-09 Jul-09 Aug-09 Sep-09 Oct-09 Nov-09 Dec-09 Jan-10 Feb-10 Oct-10* * 158K 22K 24K 54K 21K 41K -5K* -15K* 23K * * * * Nov-10* 71K 155K 11K 14K 45K 10K 31K -17K 49K -28K 27K 13K -14K -1K -24K 24K Dec-10* 106K 198K 40K 43K 78K 40K 63K 10K 82K -2K 58K 42K 12K 27K 2K 54K Jan-11* 105K 200K 37K 40K 76K 37K 60K 6K 80K -7K 55K 39K 8K 23K -2K 52K Feb-11* 92K 186K 23K 26K 62K 23K 47K -8K 67K -20K 41K 26K -5K 10K -16K 38K Mar-11* 176K 288K 96K 99K 142K 95K 123K 59K 147K 44K 117K 98K 62K 79K 49K 113K Apr-11* 149K 265K 66K 70K 114K 66K 94K 28K 119K 13K 88K 69K 31K 49K 18K 84K May-11 105K 179K 305K 89K 92K 140K 88K 119K 47K 146K 31K 112K 91K 50K 70K 36K 108K Jun-11 40K 106K 218K 25K 29K 71K 25K 53K -12K 76K -26K 47K 28K -9K 9K -21K 43K Jul-11* 123K 236K 42K 46K 89K 41K 70K 5K 93K -10K 64K 45K 8K 26K -5K 60K Aug-11 30K 94K 202K 16K 19K 60K 15K 42K -20K 65K -34K 36K 18K -17K 0K -29K 32K Sep-11* 146K 261K 64K 67K 111K 63K 92K 26K 116K 11K 85K 66K 29K 47K 16K 81K Oct-11* 88K 191K 13K 17K 56K 13K 39K -21K 60K -34K 33K 16K -18K -2K -30K 29K Nov-11* 135K 246K 56K 59K 101K 55K 83K 19K 106K 5K 77K 58K 22K 40K 10K 73K Dec-11* 130K 239K 52K 56K 97K 52K 79K 16K 102K 2K 73K 55K 19K 36K 7K 69K Jan-12* 145K 254K 67K 70K 112K 66K 93K 31K 116K 16K 87K 69K 34K 51K 22K 84K Feb-12* 179K 299K 94K 97K 143K 93K 123K 54K 148K 39K 116K 96K 57K 76K 44K 112K Mar-12* 198K 326K 107K 111K 159K 106K 138K 65K 165K 48K 131K 110K 68K 88K 54K 126K Apr-12 109K 184K 313K 92K 96K 145K 91K 123K 49K 150K 32K 116K 95K 52K 73K 38K 112K May-12 52K 121K 239K 37K 40K 85K 36K 65K -2K 90K -18K 59K 39K 1K 19K -12K 55K Jun-12* 96K 203K 18K 22K 63K 18K 45K -17K 67K -31K 39K 21K -14K 3K -26K 35K Jul-12* 131K 240K 52K 56K 97K 52K 79K 16K 102K 2K 73K 55K 19K 36K 7K 69K Aug-12* 219K 346K 128K 132K 180K 127K 159K 86K 186K 70K 152K 131K 90K 110K 76K 148K Sep-12 160K 239K 375K 142K 146K 198K 141K 175K 97K 204K 79K 168K 145K 101K 122K 86K 163K Oct-12 143K 224K 363K 125K 129K 182K 124K 159K 79K 188K 61K 151K 128K 83K 104K 67K 146K Nov-12 84K 155K 276K 67K 71K 117K 67K 97K 27K 123K 11K 90K 70K 30K 50K 17K 86K Dec-12* 213K 343K 119K 123K 173K 119K 151K 76K 178K 59K 144K 122K 80K 100K 65K 139K Jan-13* 249K 381K 154K 159K 209K 154K 187K 111K 214K 94K 179K 157K 114K 135K 100K 175K Feb-13* 301K 445K 197K 202K 256K 196K 232K 149K 263K 130K 224K 200K 153K 176K 137K 219K
Oct-08 Nov-08 Dec-08 Jan-09 Feb-09 Mar-09 Apr-09 May-09 Jun-09 Jul-09 Aug-09 Sep-09 Oct-09 Nov-09 Dec-09 Jan-10 Feb-10 Oct-10* * 47% 6% 7% 16% 6% 12% -1%* -5%* 7% * * * * Nov-10* 20% 43% 3% 4% 13% 3% 9% -5% 14% -8% 7% 4% -4% 0% -7% 7% Dec-10* 29% 54% 11% 12% 21% 11% 17% 3% 22% -1% 16% 11% 3% 7% 1% 15% Jan-11* 27% 52% 10% 10% 20% 9% 16% 2% 21% -2% 14% 10% 2% 6% -1% 13% Feb-11* 23% 47% 6% 7% 16% 6% 12% -2% 17% -5% 10% 6% -1% 2% -4% 10% Mar-11* 44% 71% 24% 25% 35% 24% 30% 15% 36% 11% 29% 24% 15% 20% 12% 28% Apr-11* 33% 59% 15% 16% 25% 15% 21% 6% 26% 3% 20% 15% 7% 11% 4% 19% May-11 22% 38% 64% 19% 20% 30% 19% 25% 10% 31% 6% 24% 19% 11% 15% 8% 23% Jun-11 8% 22% 46% 5% 6% 15% 5% 11% -2% 16% -6% 10% 6% -2% 2% -4% 9% Jul-11* 27% 51% 9% 10% 19% 9% 15% 1% 20% -2% 14% 10% 2% 6% -1% 13% Aug-11 6% 20% 43% 3% 4% 13% 3% 9% -4% 14% -7% 8% 4% -4% 0% -6% 7% Sep-11* 33% 58% 14% 15% 25% 14% 20% 6% 26% 2% 19% 15% 6% 10% 4% 18% Oct-11* 20% 43% 3% 4% 12% 3% 9% -5% 13% -8% 7% 3% -4% 0% -7% 7% Nov-11* 31% 56% 13% 14% 23% 13% 19% 4% 24% 1% 18% 13% 5% 9% 2% 17% Dec-11* 30% 55% 12% 13% 22% 12% 18% 4% 23% 1% 17% 13% 4% 8% 2% 16% Jan-12* 35% 61% 16% 17% 27% 16% 22% 7% 28% 4% 21% 16% 8% 12% 5% 20% Feb-12* 41% 68% 21% 22% 33% 21% 28% 12% 34% 9% 26% 22% 13% 17% 10% 26% Mar-12* 43% 70% 23% 24% 34% 23% 30% 14% 36% 10% 28% 24% 15% 19% 12% 27% Apr-12 23% 38% 65% 19% 20% 30% 19% 25% 10% 31% 7% 24% 20% 11% 15% 8% 23% May-12 11% 25% 49% 7% 8% 17% 7% 13% 0% 18% -4% 12% 8% 0% 4% -2% 11% Jun-12* 21% 44% 4% 5% 14% 4% 10% -4% 15% -7% 8% 4% -3% 1% -6% 8% Jul-12* 30% 55% 12% 13% 22% 12% 18% 4% 23% 0% 17% 13% 4% 8% 2% 16% Aug-12* 50% 79% 29% 30% 41% 29% 36% 20% 42% 16% 35% 30% 21% 25% 17% 34% Sep-12 35% 52% 81% 31% 32% 43% 30% 38% 21% 44% 17% 36% 31% 22% 26% 18% 35% Oct-12 29% 45% 73% 25% 26% 37% 25% 32% 16% 38% 12% 31% 26% 17% 21% 14% 30% Nov-12 18% 33% 58% 14% 15% 25% 14% 20% 6% 26% 2% 19% 15% 6% 10% 4% 18% Dec-12* 46% 74% 26% 27% 37% 26% 33% 17% 39% 13% 31% 27% 17% 22% 14% 30% Jan-13* 57% 88% 36% 37% 48% 35% 43% 26% 49% 22% 41% 36% 26% 31% 23% 40% Feb-13* 67% 99% 44% 45% 57% 44% 52% 33% 59% 29% 50% 45% 34% 39% 31% 49%
Unexercised Profitable Unprofitable Start Date of Contract
End D at e o f C o n tract
Start Date of Contract
38
0 500 1000 1500 2000 2500
Unexercised <0% >0% >5% >15% >30% >50%
N
u
m
b
e
r
o
f Per
io
d
s
Incremental Return to Sheetz
Contract profitability levels for Sheetz
51%
7% 42%
Sheetz' contract types between 2008-2016
Unexercised
Profitable
Unprofitable
(Figure 2.2)
39 Customers:
Total Incremental Profit $191,000,000
Avg π Per Year $23,800,000 Avg π Per Exercised
Period
$86,800
Avg π Per All Periods $42,700
Avg π Per Exercised
Contract
$69.58
Avg π Per Exercised
Gallon
$0.70
40 (Table 2.10)
(Table 2.9)
Snapshot of per-period profitability ($)
Snapshot of per-period profitability ($)
Nov-08 Dec-08 Jan-09 Feb-09 Mar-09 Apr-09 May-09 Jun-09 Jul-09 Aug-09 Sep-09 Oct-09 Nov-09 Dec-09 Jan-10 Feb-10 Jul-10* 87K 132K 107K 87K 90K 75K 34K 3K 31K 2K 21K 8K * 10K * Aug-10* 79K 124K 99K 79K 82K 67K 26K * 23K * 13K 0K * 2K * Sep-10* 80K 124K 99K 80K 82K 67K 27K * 24K * 14K 1K * 3K * Oct-10* 75K 119K 94K 75K 77K 62K 22K * 19K * 9K * * * * Nov-10 4K 105K 149K 124K 105K 107K 92K 52K 21K 49K 20K 39K 26K 15K 28K 13K Dec-10 12K 112K 157K 132K 112K 115K 100K 59K 28K 56K 27K 46K 33K 22K 35K 20K Jan-11 29K 130K 174K 149K 130K 132K 117K 77K 45K 74K 45K 63K 51K 40K 53K 38K Feb-11 43K 143K 187K 162K 143K 145K 130K 90K 59K 87K 58K 77K 64K 53K 66K 51K Mar-11 47K 147K 191K 167K 147K 149K 134K 94K 63K 91K 62K 81K 68K 57K 70K 55K Apr-11 92K 192K 237K 212K 192K 195K 179K 139K 108K 136K 107K 126K 113K 102K 115K 100K May-11 115K 216K 260K 235K 216K 218K 203K 163K 131K 160K 131K 149K 137K 126K 139K 124K Jun-11 118K 219K 263K 238K 218K 221K 206K 166K 134K 162K 133K 152K 139K 128K 141K 126K Jul-11 104K 205K 249K 224K 205K 207K 192K 152K 120K 149K 120K 138K 125K 115K 127K 113K Aug-11 112K 212K 257K 232K 212K 214K 199K 159K 128K 156K 127K 146K 133K 122K 135K 120K Sep-11 92K 192K 237K 212K 192K 195K 179K 139K 108K 136K 107K 126K 113K 102K 115K 100K Oct-11 92K 192K 237K 212K 192K 195K 179K 139K 108K 136K 107K 126K 113K 102K 115K 100K Nov-11 81K 181K 225K 201K 181K 183K 168K 128K 97K 125K 96K 115K 102K 91K 104K 89K Dec-11 75K 175K 220K 195K 175K 178K 162K 122K 91K 119K 90K 109K 96K 85K 98K 83K Jan-12 62K 163K 207K 182K 163K 165K 150K 110K 78K 107K 78K 96K 84K 73K 86K 71K Feb-12 82K 182K 226K 202K 182K 184K 169K 129K 98K 126K 97K 116K 103K 92K 105K 90K Mar-12 105K 205K 249K 224K 205K 207K 192K 152K 121K 149K 120K 139K 126K 115K 128K 113K Apr-12 126K 227K 271K 246K 227K 229K 214K 174K 142K 171K 142K 160K 148K 137K 150K 135K May-12 132K 233K 277K 252K 233K 235K 220K 180K 148K 177K 148K 166K 153K 143K 155K 141K Jun-12 104K 205K 249K 224K 205K 207K 192K 152K 120K 149K 120K 138K 126K 115K 128K 113K Jul-12 78K 179K 223K 198K 178K 181K 166K 126K 94K 123K 94K 112K 99K 88K 101K 87K Aug-12 79K 180K 224K 199K 180K 182K 167K 127K 95K 124K 95K 113K 101K 90K 103K 88K Sep-12 106K 207K 251K 226K 207K 209K 194K 154K 122K 151K 122K 140K 128K 117K 130K 115K Oct-12 136K 237K 281K 256K 237K 239K 224K 184K 152K 181K 152K 170K 158K 147K 160K 145K Nov-12 117K 218K 262K 237K 218K 220K 205K 165K 133K 162K 133K 151K 139K 128K 141K 126K Dec-12 104K 205K 249K 224K 204K 207K 192K 152K 120K 149K 119K 138K 125K 114K 127K 113K Jan-13 76K 177K 221K 196K 177K 179K 164K 124K 92K 121K 92K 110K 97K 87K 99K 85K Feb-13 91K 191K 235K 210K 191K 193K 178K 138K 107K 135K 106K 125K 112K 101K 114K 99K
Nov-08 Dec-08 Jan-09 Feb-09 Mar-09 Apr-09 May-09 Jun-09 Jul-09 Aug-09 Sep-09 Oct-09 Nov-09 Dec-09 Jan-10 Feb-10 Jul-10* 34% 62% 45% 34% 35% 28% 11% 1% 10% 1% 6% 2% * 3% * Aug-10* 31% 58% 42% 31% 32% 25% 9% * 7% * 4% 0% * 1% * Sep-10* 31% 58% 42% 31% 32% 25% 9% * 8% * 4% 0% * 1% * Oct-10* 29% 56% 40% 29% 30% 23% 7% * 6% * 3% * * * * Nov-10 1% 41% 70% 52% 41% 42% 34% 17% 6% 16% 6% 12% 8% 4% 8% 4% Dec-10 3% 44% 74% 56% 44% 45% 37% 19% 8% 18% 8% 14% 10% 6% 11% 6% Jan-11 8% 51% 82% 63% 51% 52% 43% 25% 13% 24% 13% 20% 15% 11% 16% 11% Feb-11 12% 56% 88% 68% 56% 57% 48% 29% 17% 28% 17% 24% 19% 15% 20% 15% Mar-11 13% 57% 90% 70% 57% 59% 50% 30% 18% 29% 18% 25% 20% 16% 21% 16% Apr-11 26% 75% 111% 89% 75% 76% 67% 45% 32% 44% 31% 39% 34% 29% 34% 29% May-11 32% 84% 122% 99% 84% 86% 75% 53% 38% 51% 38% 46% 41% 36% 41% 35% Jun-11 33% 85% 124% 100% 85% 87% 76% 53% 39% 52% 39% 47% 41% 37% 42% 36% Jul-11 29% 80% 117% 94% 80% 81% 71% 49% 35% 48% 35% 43% 37% 33% 38% 32% Aug-11 31% 83% 121% 98% 83% 84% 74% 51% 37% 50% 37% 45% 40% 35% 40% 34% Sep-11 26% 75% 111% 89% 75% 76% 67% 45% 32% 44% 31% 39% 34% 29% 34% 29% Oct-11 26% 75% 111% 89% 75% 76% 67% 45% 32% 44% 31% 39% 34% 29% 34% 29% Nov-11 23% 71% 106% 84% 70% 72% 62% 41% 28% 40% 28% 35% 30% 26% 31% 26% Dec-11 21% 68% 103% 82% 68% 70% 60% 40% 27% 38% 26% 34% 29% 25% 29% 24% Jan-12 17% 63% 97% 77% 63% 65% 56% 35% 23% 34% 23% 30% 25% 21% 26% 20% Feb-12 23% 71% 107% 85% 71% 72% 63% 42% 29% 40% 28% 36% 31% 27% 31% 26% Mar-12 29% 80% 117% 95% 80% 81% 71% 49% 35% 48% 35% 43% 37% 33% 38% 32% Apr-12 35% 88% 128% 104% 88% 90% 79% 56% 42% 55% 41% 50% 44% 39% 45% 39% May-12 37% 91% 130% 106% 90% 92% 81% 58% 43% 56% 43% 51% 46% 41% 47% 40% Jun-12 29% 80% 117% 94% 80% 81% 71% 49% 35% 48% 35% 43% 37% 33% 38% 32% Jul-12 22% 70% 105% 83% 69% 71% 61% 41% 28% 39% 27% 35% 30% 26% 30% 25% Aug-12 22% 70% 105% 84% 70% 71% 62% 41% 28% 40% 28% 35% 30% 26% 31% 25% Sep-12 30% 81% 118% 95% 80% 82% 72% 50% 36% 48% 36% 43% 38% 34% 39% 33% Oct-12 38% 92% 132% 108% 92% 94% 83% 59% 45% 58% 44% 53% 47% 42% 48% 42% Nov-12 33% 85% 123% 100% 85% 86% 76% 53% 39% 52% 39% 47% 41% 37% 42% 36% Dec-12 29% 80% 117% 94% 80% 81% 71% 49% 35% 47% 35% 43% 37% 33% 38% 32% Jan-13 21% 69% 104% 83% 69% 70% 61% 40% 27% 39% 27% 34% 29% 25% 30% 24% Feb-13 25% 74% 111% 89% 74% 76% 66% 45% 31% 43% 31% 39% 33% 29% 34% 28%
End D at e o f C o n tract End D at e o f C o n tract
Start Date of Contract
41
0 500 1000 1500 2000 2500
N
u
m
b
e
r
o
f Per
io
d
s
Return to Customers
Contract profitability levels for customers
51% 49%
Customer contract types between 2008-2016
Unexercised
Profitable
Unprofitable
(Figure 2.4)
42 Additional Insights 0% 20% 40% 60% 80% 100% 120% 140% Ma r-08 Ju l-08 N o v-08 Ma r-09 Ju l-09 N o v-09 Ma r-10 Ju l-10 N o v-10 Ma r-11 Ju l-11 N o v-11 Ma r-12 Ju l-12 N o v-12 Ma r-13 Ju l-13 N o v-13 Ma r-14 Ju l-14 N o v-14 Ma r-15 Ju l-15 N o v-15 R e tu rn
Contract Start Date
Maximum return potential
Sheetz Customer 0 10 20 30 40 50 60
Oct-06 Feb-08 Jul-09 Nov-10 Apr-12 Aug-13 Dec-14 May-16 Sep-17
D u ration ( m o n th s)
Contract Start Date
Duration of contracts at maximum return
Average
duration is
19.4
(Figure 2.6)
45
RECOMMENDATION, RISKS, AND CHALLENGES
Recommendation
The two areas of research analyzed through this thesis offer important insights into the opportunity of offering fixed rate gasoline contracts to the general public. First Fuel Banks offers fixed-price contracts through efficiencies in storage that are combined with a volatile price market while the Sheetz model suggests that price-stabilization can be achieved through the use of a certain future contract derivative tied to the moving price of gasoline.
While comparing the two profitable models for fixed-price contracts, three primary factors suggest that the Sheetz’ model is the recommended design for this new opportunity;
value potential, scalability, and relatively low risk.
Value potential
The Sheetz’ model has the ability to create significant value for both the retailer
as well as the consumer. While at the start date of the contract the customer will pay a 3% premium for the fixed price, on average, each customer with an
46
average of $.61 per gallon that is sold through a fixed price contract. A major benefit of this arrangement is that the two parties involved (i.e. Sheetz and their customers) receive proportional value—in other words, Sheetz makes more
money when the customers are saving more money.
Scalability
By using the highly liquid and frequently traded futures contract ETF, an adapter to the model could very easily test and implement this product. Compared to the alternative model which requires the physical storing of the pre-purchased gasoline, this design does not have any significant fixed costs. In fact, the only true cost that would result is the usage expense of the ETF, which is a very insignificant amount. By implementing this strategy, a company would be able to quickly and inexpensively expand the markets for this fixed-rate product. An important factor to consider, however, is the pricing differences that will result of offering the same product in different markets and through different retail stores of the same organization.
Low risk
47
further reduce the potential impact of such a contract, many contract adaptations,
such as the described price ceiling, could be implemented.
Since a major element of this product is the logical consumeristic behavior of the customers, an alignment of incentives is established between the company and its customers. This relationship creates a situation where each party is seeking a mutually beneficial outcome since the amount of value creation for each party is heavily dependent on the other party’s outcome. The incentive alignment
reinforces the low risk profile as the opportunity for customers to exploit this product is strongly diminished.
In addition, since no maximum duration is necessary for these contracts, there is not a point of diminishing returns for the profitability. Compared to the 10 year duration for profitable contracts at First Fuel Banks, the contracts in this
arrangement do not need to be exercised immediately to create the most profit. Finally, the liquidity of the ETF offers an extreme amount of flexibility and freedom to exercise the contract at whatever moment is deemed appropriate.
Risks and Challenges
Although this new opportunity suggests significant value creation, many risks must be considered in order to offer a holistic evaluation. Since general use of fixed-rate
48 Cost of carry
In the research conducted with the Sheetz Model, a relationship has been examined which considers the UGA ETF to be a representation of the future price for gasoline while the retail price at Sheetz is the spot price of the same underlying asset. For an asset that involves storage costs and a convenience yield, the futures/spot price parity can be defined as:
𝐹
𝑇= 𝑆
0∙ (1 + 𝑟
𝑓+ 𝑢 − 𝑦)
𝑇Where u=storage cost and y=convenience yield. Under the zero-arbitrage theory, the value creation identified through the Sheetz model must come as a result of the organizations advantage through storage costs or the convenience yield. This research, however, does not identify the driver responsible for the value creation and leaves a possible risk for the identified value to be an irregular occurrence that will not be found in other contexts. By identifying the primary factor that is creating the value-producing relationship between Sheetz’ spot price and the
UGA futures price, an organization will be able to mitigate the potential risk that is
accompanied by the cost of carry valuation formula.
Pricing integrity
49
change the price of gasoline as a result. Instead, the company must continue to price the gasoline in the same manner in which it has priced gasoline between 2008-2016. The failure to do so could create significant conflict of interest for the organization.
As a remedy for this issue, I propose that an independent institution should be created to manage the entire fixed-rate product. The responsibilities of this organization should include the pricing, promotion, execution, and any additional management needs that come along with the new product. This independent organization should not provide any information to the actual retailer until the contract has been fully executed—this practice will ensure that no transfer of
information will occur and will therefore prevent any malpractice of pricing for the overall retail market.
Cross-store transferability
Depending on the way the organization determines the retail price (spot price) for a given market, the ability for customers to transfer a contract between locations may create tension and additional issues. For instance, if a station will change its price based on the amount and type of competition in close proximity, then a fixed-rate contract from another market should not transfer identically to this market—this situation could create an exploitation opportunity for the customer
that would not necessarily benefit the gas retail organization that has adopted the
product offering.
50
Altoona market to use their contracts interchangeably within the market as long as all of the stores in this particular market have an identical pricing strategy. This practice was adopted by First Fuel Banks and was regarded with high success and usage by the consumer. A second option is for the ability to add a certain premium or discount to each store relative to the location of origin where the contract was first created. This option, however, would create additional decision making criteria for the consumer and has the opportunity for causing confusion and misunderstanding.
Illogical usage
In the Sheetz model, the organization receives a significant amount of value when the customers exercise their contracts in a logical way—that is to say the
customer would only exercise the contract if s/he has locked in a rate that is below the current market rate (including the premium paid). Since the pre-paid money has been invested in the relatively volatile gasoline ETF, exercising the contract in an illogical way could have major negative consequences on the organization. When the market is in a downward trending move, the ETF outpaces the market and loses value more quickly—the opposite is true for an
upward trending movement in the market. Due to this relationship, an illogical exercising of the contract could hurt both the consumer as well as the retailer.
51
impacted by the illogical usage. A second remedy option is the usage of a price ceiling that would, in effect, prevent customers from locking in gas prices at too high of a gas price—this option is further described through the “unexercised contract” remedy.
Unexercised contracts
A significant amount of contracts that have been analyzed in the contract timing scenario analyses have been unexercised. Part of this situation is due to the comparatively low market price of gasoline that is currently for sale. However, some contracts, such as those that began in July or August of 2008, were started at the top of the market and therefore have not yet come to a point of logical exercise. The adopters of these contracts are at a major disadvantage and offer no value to the organization—furthermore, they will likely pursue an early usage of these contracts and take the loss as a “sunk cost” which would likely create a
value reduction for the organization.
In order to both protect the organization as well as the consumers from locking in gas contracts at too high of a price, the organization can implement a “price ceiling” strategy. This strategy would determine a certain market price of gasoline
that would be the trigger for the organization to stop selling the contracts until the prices return below the ceiling price. The Sheetz pricing data between 2008-2016 suggests that the average price has been around $3.15 per gallon with a
maximum price of $4.00 in June of 2008. Therefore, a ceiling between this price range could prevent consumers from locking in gas prices at unattractive rates in addition to insuring the organization against long duration, loss-creating
52 Legality
A final risk to mention is the legality of offering this product to the general consumer. While no company has been identified that has been unlawful for offering fixed-price contracts, there is a significant amount of regulation that surrounds any type of financial instrument usage on a retail scale. In the beginning stages of a market implementation test, it is crucial that the organization practices full disclosure and honest relations that informs the customer to the highest degree.
As the “low risk” portion of the “recommendations” section describes the
53
FUTURE RESEARCH OPPORTUNITIES
The research performed through this thesis is the apparent first of its kind. Although the two models that have been analyzed at a high level suggest a significant opportunity exists for value creation, many other opportunities exist and much research can continue to be analyzed regarding the fixed-price gasoline opportunity. Apart from analysis done for the physical storage model used by First Fuel Banks and the ETF hedging model analyzed through Sheetz’, some of the other areas of relevant research are described as
follows:
Analysis of logical consumption
A crucial element to this research is the assumption that consumers will exercise their locked-in price contracts in a logical way—that is to say that customers will
only exercise when the market price is above the pre-paid locked-in price. In theory, the assumption of logical usage does not create significant issues, but practice has revealed that individuals rarely act through pure logical and rational means.
By studying the behaviors of the type of customer that would use this product, an organization would be able to validate or nullify the assumption of logical