pages. Advisor: Gary Marchionini.
This research describes an eye tracking study conducted at the Interaction Design Laboratory of the University of North Carolina at Chapel Hill. This experiment focused on identifying and analyzing user behavior and patterns when processing numeric table data in PDF and Table Browser formats. The Table Browser is an experimental tool for browsing statistical tables on the World Wide Web (WWW). Eleven sets of eye data were collected using the ASL 504 eye tracking system, and raw data were analyzed using EYENAL and FIXPLOT software.
Compared to the traditional PDF format, the Table Browser provided more choices for viewing and manipulating data. The table Browser was extremely useful, compared to the static PDF format, to deal with a difficult task in a large and complex table. For complex tasks such as comparing data or looking for trends, the Table Browser improves
efficiency as measured by far less eye movement effort. For a simple task in a simple table, there is no obvious difference between these two formats.
Headings: Eye tracking
Eye movement patterns Statistical tables
PROCESSING NUMERIC TABLE DATA IN ELECTRONIC FORMATS: EYE MOVEMENT PATTERNS AND SEARCHING EFFICIENCY
by Tao Gao
A Master’s paper submitted to the faculty of the School of Information and Library Science of the University of North Carolina at Chapel Hill
in partial fulfillment of the requirements for the degree of Master of Science in
Information Science.
Chapel Hill, North Carolina July, 2001
Approved by:
Table of contents
CHAPTER 1: INTRODUCTION... 1
CHAPTER 2: BACKGROUND AND RELATED STUDIES ... 3
2.1 PDF and Statistical Data ... 3
2.2 Table Browser ... 4
2.3 Eye Movements ... 6
2.4 Eye tracking study ... 7
2.4.1 Functions of Eye Tracking... 7
2.4.2 Eye Movements Measurement Techniques ... 8
2.5 Related Studies ... 9
CHAPTER 3: METHOD ... 11
3.1 General Process... 11
3.2 Subjects ... 12
3.2.1 Subject Selection Criteria ... 12
3.2.2 Expert and Non-expert... 12
3.3 Facilities ... 13
3.4 How the Eye Tracker Works ... 14
3.5 PDF & Table Browser ... 15
3.7 Measure Procedure... 17
3.8 Data Processing and Image capture... 18
CHAPTER 4: RESULTS ... 20
4.1 Pre-test survey... 20
4.11 General Information about Subjects ... 20
4.12 Computer literacy... 20
4.1.3 Expert user and non-expert user ... 21
4.2 Eye Tracking Test ... 23
4.2.1 Eye Movements Pattern ... 23
4.2.2 Searching Efficiency... 27
4.2.2.1.1 Expert vs. Non-Expert... 27
4.2.1.1.2 PDF vs. Table Browser Format... 30
4.2.2.2 Mean Fixation Time... 31
4.2.2.3 Fixation duration in Row/Column header area... 33
4.3 Post-test Survey... 34
4.3.1 User Preferences ... 34
4.3.2 Comments and Suggestions ... 35
CHAPTER 5: DISCUSSION ... 37
5.1 Table Issue ... 37
5.2 PDF and Table Browser ... 39
5.3 Functions and Limitations of the Table Browser ... 41
5.4 Limitations of this Study ... 43
6.1 Conclusion ... 44
6.2 Acknowledgement... 44
BIBLIOGRAPHY ... 45
APPENDIX A: CONSENT FORM ... 47
APPENDIX B: PRE-TEST DEMOGRAPHIC QUESTIONNAIRE ... 49
APPENDIX C: POST-TASKS SURVEY ... 51
Chapter 1: Introduction
As the Internet becomes more pervasive, more and more statistical information is being made available to public users. Government agencies aim to improve citizen access and usage of statistics by making these data available via the World Wide Web (WWW). So far the most popular format to present statistical information on Web is the PDF table, which is a static table in that the layout can not be changed except by using a scroll bar to move vertically or horizontally. In order to broaden access and use, user interfaces should be user-oriented and serve the needs of wide ranges of people. Toward these goals, a new table interface -- the Table Browser (TB) -- was developed at the Interaction Design Laboratory of the University of North Carolina at Chapel Hill. The Table Browser allows basic manipulation of data and tables in terms of ordering, placement, hiding (temporary deletion), and highlighting (selection), as well as providing extended contextual
information (metadata) for the variables. Any manipulation performed on the data or table by the user within the Table Browser is temporary and only applies to the particular user's view -- i.e., users do not manipulate data on agency servers.
Chapter 2: Background and Related Studies
2.1 PDF and Statistical Data
Statistical information is important to everybody. People want faster, more natural, and more convenient, and less expensive access to statistical information through electronic media. As the Internet develops, the WWW offers an effective approach -- Electronic-table. For example, the U.S. Census Bureau provides a full range of statistics and information related to the National Population Census. For WWW access, the statistical information is stored in the PDF standard format table. The primary advantage of the PDF format is simplicity and standardization. It is easy to learn and use PDF files. Training is not necessary. With software called Acrobat Reader, all user needs to read a PDF table is to learn how to scroll horizontally and vertically. PDF is also a format used by a variety of computing platforms. However, the PDF format has some limitations (Mu, 2000):
• PDF format prohibits people from doing any manipulations on the table and its data.
• Another problem is the heavy Network traffic caused by browsing multiple aspects of a large table, which is stored in the server, and the user has to go back and forth repeatedly.
Because of these limitations, a user-oriented interface is recommended to meet the users’ needs. The user-oriented interface needs to bridge user knowledge gaps and help the user obtain information from his/her natural eye movements while reading the screen, rather than requiring the user to make specific trained eye movements to actuate the system (Jacob, 1995). More specifically, In a user-oriented interface, “the data (in a table) must both be easy to find and easy to interpret and use” (Marchionini & Greene, 1997), and the software used to retrieve and display the data from the electronic media must meet the need of information-seeking behavior and the cognitive frames of a diversity of users. Based on these ideas, Marchionini and Mu developed the Table Browser through research, with the goal of exploring and understanding the nature of statistical e-tables, and developing and testing the new interface-- Table Browser.
2.2 Table Browser
The Table Browser is developed by Marchionini and Mu in 2000. Compared to the traditional PDF format, the Table Browser allows people to manipulate data and tables in specific ways. Below are the main features of the Table Browser that are different from the PDF format (see figures 1 and 2):
• Metadata is provided -- extended contextual information for the variables and table itself.
• Row/column highlight, selection and hide functions. • Moveable columns.
• Basic functions to manipulate data, such as maximum, minimum and average functions.
Figure2: Some manipulations available in the Table Browser. The red frame shows the main function area, these functions are helpful to manipulate data and the table; the black frames show fixed row header and lockable column header; the pink circle and frame show metadata; the blue circle shows the dragging function, which helps put two separated columns together; the brown circle shows row/column highlight function, which conveniently allows user to find data at the crossing cell.
2.3 Eye Movements
Eye positions and movements are the results of activities of the visual muscular system, which is controlled by the central nervous system. Eye movements during reading activity and picture identification provide a positive indication about the processes by which people understand visual input and integrate it with knowledge and memory. Among all types of eye movements, three types of eye movements are important and useful in human-computer interaction behaviors studies: (1) Saccade: The rapid visional (conjugate) eye movements are under both voluntary and reflex control. Saccades
represent the ability to change fixation quickly and accurately from one target to the next, as in the act of reading. (2) Fixation maintenance: represents the ability to maintain steady, accurate fixation. This is important for concentration. It can be influenced by a binocular vision problem. (3) Pursuit: represents the ability to maintain fixation on a moving target, such as a moving mouse symbol (Agape, 1999).
For this study, subject is seated before a computer monitor and reads table data on the computer screen. We expected to see steady or jittery fixations connected by sudden, rapid saccades during the test period. A series of saccadic eye movements and points of fixations were collected to describe the eye movements.
2.4 Eye tracking study
Eye tracking is a technique used to provide precise and concrete information to determine where a person is looking. The concepts underlying eye tracking are simple: track the movements of the user's eyes and note what the pupils are doing while the user is looking at a particular feature.
2.4.1 Functions of Eye Tracking
Eye tracking is widely used in different fields to provide human behavior information. In Information Technology field, eye tracking is a good way to study the human-computer interaction. Will Schroeder (1998) described its main functions as follow:
1. Tell whether users are even looking at the screen. Without an eye tracker, it is difficult to determine exactly where users are looking. But with an eye tracker, it is quite easy to tell whether users are looking at anything and what it is.
3. Learn the relative intensity of a user’s attention to various parts of a screen. By dividing the screen into distinct AOIs (Area of Interesting), such as row and column header, we can determine when a user gazes at each area, and for how long.
4. Determine whether a user is searching for a specific item. Pupil diameter appears to increase when users are not sure what words they are looking for. When a user focuses on a specific part, pupil diameter always decreases.
5. Compare user scan or searching patterns. Counting how long each user looked at each area, and in what order, let us compare user strategies. General people share the same overall scan patterns. So we could learn how scan strategies apply to interface design by testing a few users’ searching pattern.
2.4.2 Eye Movements Measurement Techniques
The most accurate, but the least user-friendly technology is called eye coil. A non-slipping contact lens is ground to fit precisely over the corneal bulge, and then slight suction is applied (mechanically or chemically) to hold the lens in place. The lens may have a small mechanical lever, a magnetic coil, or a mirror, all of which can be tracked reliably. This method is obviously practical only for laboratory studies, as it is very awkward, uncomfortable, and interferes with blinking (Jacob, 1995).
Current eye trackers eliminate subject’s immobilization by measuring eye gaze in a head-free condition. The corneal reflection-plus-pupil outline approach is appropriate for normal computer users, since nothing contacts the subject and the device permits his or her head to remain unclamped (Jacob, 1995). Computer based systems can track head motions and have auto focus function. Data is easily processed, and linearity is improved. But the temporal resolution is generally limited to the video frame rate. So the speed is limited. And accuracies are not so good as contact lens (Young & Sheena, 1975).
2.5 Related Studies
experience could help users to understand the table format and improve users’ searching efficiency. Laura Chessman (2000) has done a Table Browser usability study. It is surprising to see that subjects show preference to the Table Browser over the PDF format, while no difference exists in their searching efficiency.
Chapter 3: Method
3.1 General Process
3.2 Subjects
11 subjects were recruited from students at the University of North Carolina based on email advertisements. Subjects were randomly divided into two groups by a coin method. Subjects in one group used the PDF format table and those in the other group used the Table Browser format tables. Within each group, they were further divided into two sub-groups: expert and non-expert based on their statistical experiences. Subjects participated individually and took about one hour for the full test.
3.2.1 Subject Selection Criteria
• Subjects need to know basic computer manipulations, such as clicking, scrolling and dragging.
• Subjects should have no binocular vision problem.
• Subjects should be able to read at least 18 inches away from computer screen without glasses (Contact lens is fine).
• Subjects should be able to understand and speak English.
3.2.2 Expert and Non-expert
Based on the subjects’ statistical experience, a SEI (Statistical Experience Index) was computed to indicate whether a subject is an expert user or not. The SEI is calculated in the following way:
1. If the subject has ever taken any statistical course, SEI is increased by 3 points per course.
2. If the subject has ever used statistical software listed below, SEI is increased by 1 point per software.
Software: Excel SPSS SAS Other
3. If the subject has experience with the following tables more than 6 times, SEI is increased by 1 point per table category.
Tables:
• Stock market tables/listings
• Time schedule tables (e.g. bus, airline, class schedule) • Consumer information tables (e.g. cost comparison tables) • Nutritional labels (e.g. cereal box)
• Research results in articles
• Government statistics on the Web (e.g. health, demographic tables) • Tax tables
If the total SEI score is higher than 8, the subject is regarded as an expert user, otherwise is classified as a non-expert user.
3.3 Facilities
The Applied Science Laboratories (ASL) model 504 eye tracking system is used to study people’s searching and browsing behaviors on table data. Its components include:
• Flock of Birds Head tracker electronics unit, magnetic transmitter, head mounted sensor & halo
• Two black and white video monitors (eye monitor and scene monitor)
• Scan-Do 1024 Video Scan Converter (resolution up to 1024x768 in 16 million colors, replaces remote scene camera)
• 90MHz Dell Pentium 90 with MS-DOS 6.0 for interfacing with eye & head tracking equipment
• Software
a. The E5000 EYEPOS software package to operate the eye tracker and record data.
b. EYENAL data analysis software, which can convert binary data files to ASCII, and ACCESS software to access binary data files from user written C programs.
c. FIXPLOT image capture software, which is used to capture screen image.
3.4 How the Eye Tracker Works
The eye tracking data will be recorded digitally on the eye tracker interface PC. Additional software such as EYENAL and Fixplot were used to process data.
3.5 PDF & Table Browser
A PDF statistical table is a static table, and the table layout can not be changed, except to use scroll bars to move vertically or horizontally. In this study, 4 PDF tables from the Centers for Disease Control and Prevention (table 3 and 5) andthe Bureau of the Census (table14 and 26) were used as a searching interface. The Table Browser is a new table interface (http://idl66.ils.unc.edu/table/current/jTBX.html), which is a Java application. The Table Browser provides some functions, which allows the table layout to be changed for searching efficiency. The functions include fixed table header, moveable column, lockable column header, row & column highlight and so on. In this study, subjects were encouraged, but not required to use these functions.
3.6 Tables and Tasks
Four tables were used in the test: two life expectancy tables (table 3, 5), and two population tables (table 14, 26).
1. The life tables show the life expectancy and survivorship by age, race, and sex. The principal source of these data is the Bureau of the Census. Table 3 contains data for expectation of life at every single year of age (from 0 to 85), by race and sex. Estimated average length of life in years, by race and sex is shown in table 5.
Bureau of the Census. Table 14 is about resident population by age and sex, from 1980 to 1997. Table 26 has the resident population data ordered by states from 1970 to 1997.
During the test, either a PDF or TB format table was displayed on the monitor. The same tables in the two formats were the same size and show the same mount of information* in the first screen. The major difference between two format tables is that the Table Browser provides many functions, which can be used to manipulate the data/table, while PDF does not.
There were three levels of tasks assigned to subjects: Task level 1: simple search questions.
Questions:
1. (Table 3) In 1996 how many more years was a 50-year-old woman expected to live?
2. (Table 14) In 1997 what was the resident population of all females?
3. (Table 14) In 1988 what was the resident population of the 15-19 years age group? 4. (Table 26) What was the population of Utah in 1994?
Task level 2: requires the user to perform trend analysis. Questions:
2. (Table 5) What happened to the difference in age expectancy of males and females between 1929 and 1996?
Task level 3: requires the user to perform a simple calculation and compare information from separated columns.
Questions:
1. (Table 26) By how much did the overall population increase between the (April) 1970 and (April) 1990?
2. (Table 26) Compared to the population information from 1997, which two states have decreased in population size since 1970?
3.7 Measure Procedure
The steps for the eye tracking process can be grouped into three sets.
System Calibration: (needs to be done only once for any given physical setup of the components)
1. Setting up calibration target points 2. Set and check calibration target points 3. MHT pan/tilt tracking calibration
• Transmitter to optics calibration • Sensor to mirror calibration
Subject calibration: (needs to be done for each subject with the system) 1. Set the offset value between the subject’s eye and the sensor attached to the
2. Pupil and corneal reflection discrimination 3.MHT pan/tilt tracking
4.Subject eye calibration 5.Calibration test
Data recording:
1. Select “New” from File menu 2. Enter file name “sample.eyd”
3. Select “Begin” form File menu, type number (0-9) to insert event marks, or use “Event Mark” form File menu.
4. Type “S” to suspend, “R” to resume 5. Select “Close” to stop.
3.8 Data Processing and Image capture
After the raw data is recorded as “sample.eyd” file in the eye test, the EYENAL program is used to process data. Based on the sample.eyd file, the EYENAL program is used to generate three files: FIX file has all the information to identify fixations, inter-fixation time, and angular distance between fixations. AOI (Area of Interest) file defines scene areas of interest in meaningful coordinates. FSQ (Fixation Sequence) file produces statistics on the viewing sequence of Areas of Interest based on FIX file and AOI file.
fixation plot shows the scan paths of a subject’s eye movements during browsing and searching table data on the computer screen.
NOTE
Chapter 4: Results
4.1 Pre-test survey
4.11 General Information about Subjects
Subjects included 3 males and 8 females, all of them students at UNC-CH. Their ages ranged from 21 to 43. Five of them wore contact lens. Five subjects (45.45%) had never used table data from government Web sites. Five of them use these data occasionally and only one uses government Web sites more frequently-- weekly. For statistical data on Web, one third (33.33%) had never used them, five of them occasionally used it, and three of them were more frequently users. Only one (9.9%) of the eleven subjects had ever used Fedstats (www.fedstats.gov).
4.12 Computer literacy
Almost all subjects use computers daily, except one subject who reported using
Application Number of Valid
Respondents Percentage
Database 10 90.91
Email 11 100.00
Games 7 63.64
Multimedia 5 45.45
Programming 7 63.64
Web Surfing 11 100.00
Word Processing 11 100.00
Table 1: Subjects computer literacy. Responses to Pre-test Question 2, “What applications do you use?”
4.1.3 Expert user and non-expert user
Subjects were divided into two groups -- expert user and non-expert user -- based on their statistical experiences. Statistical experiences were graded by table experiences,
statistical software experiences and statistical courses. Table experiences:
The frequency scale of table usage in Table 2, from left to right, can be explained as: no table knowledge, very limited table knowledge, moderate table knowledge and familiar with tables. It is clear that most of the subjects are very familiar with time schedule tables, nutritional labels and research result tables.
Number of Valid Respondents Table
None 1-5 6-15 >15
Stock market tables/listings 5 2 1 3
Time schedule tables 0 0 2 9
Consumer information tables 3 2 3 4
Nutritional labels 2 1 0 9
Research results in articles 1 2 2 6
Government statistics on the Web 3 3 2 3
Tax tables 3 3 3 2
Software experiences:
Table usage responses are listed in Table 3. All subjects had experiences with Excel. Only a few subjects have used SAS, SPSS or other statistical software.
Software Name Number of Valid Respondents Percentage (100%)
Excel/Other Spread Sheet 11 100.00
SAS 2 18.18
SPSS 5 45.45
Others 3 27.27
Table 3: subjects experience with statistical software. Responses to pre-test question 5, “Please select any statistical software package(s) you have used?”
Statistical Courses:
Among the subjects, only three subjects had ever taken any statistical courses. Two of them had taken a college statistical course and the other is a statistical professional.
Based on all three factors: statistical table experience, statistical courses and software experience, 7 subjects were classified as expert and 4 subjects were classified as non-expert. Table 4 provides the distribution of expertise and interface treatment. Since an earlier eye tracking study has been done on eye movements during processing numeric data in the PDF format table, only two subjects were selected to have tests using the PDF format table while five subjects using the Table Browser format table in this study.
Format Expert Non-expert
PDF 2 2
Table Browser 5 2
4.2 Eye Tracking Test 4.2.1 Eye Movements Pattern 4.2.1.1 Different task level
Since PDF format is the traditional format used widely on Web to present statistical table, it was used as the baseline standard in our experiments.
Task level 1: Simple search. Figure 3 shows a search pattern with the main focus on the row headers and column headers, plus scrolling vertically or horizontally (oblique trail across the screen) as needed.
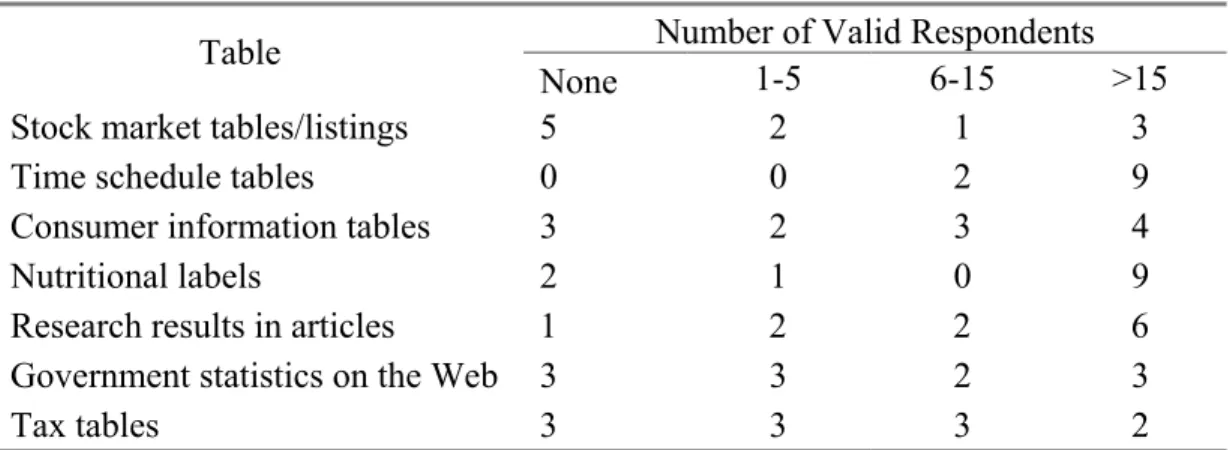
Figure 3: A search pattern for simple search. Main fixation points locate in the row/column header. Oblique scan path indicates a scrolling action. The question asked was: “In 1997 what was the resident population of all females?”
several rows, with few between them. Because all data follow a trend, there was no need to waste time on the middle part of table data.
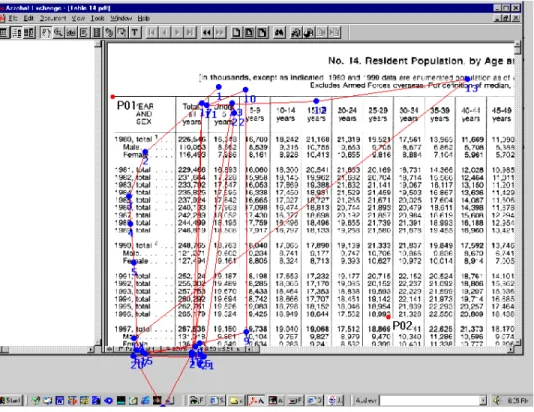
Figure 4: A search pattern for trend finding and comparing. The main fixation points locate in column header and two compared columns. The question asked was: “What happened to the difference in age expectancy of males and females between 1929 and 1996?”
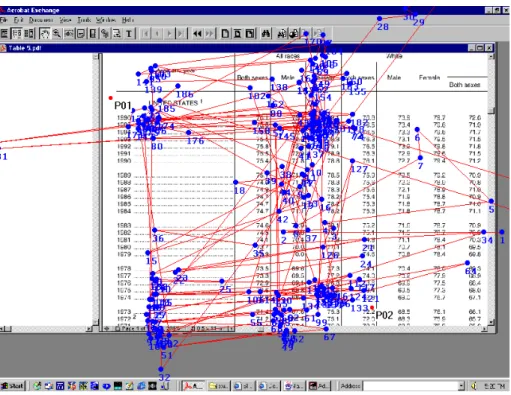
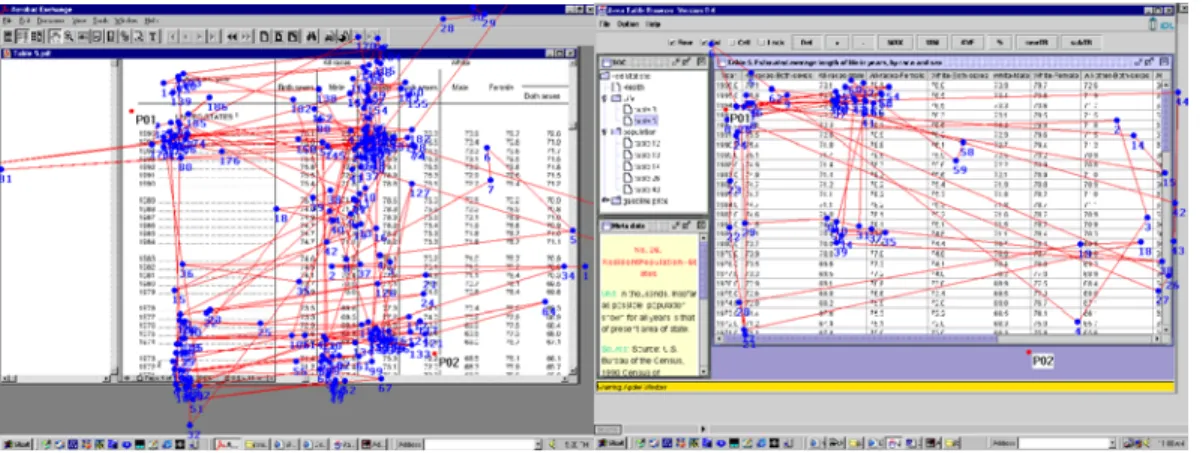
Figure 5: A search pattern for comparison between columns. The main fixation points densely locate in the two compared columns. The question asked was: “Compared to the population information from 1997, which two states have decreased in population size since 1970?”
4.2.1.2 Table Browser vs. PDF table format
Task level one: Simple search pattern comparison (see figure 6)
Figure 6: Simple search patterns in the PDF vs. TB formats. The same search pattern is shown in both formats, consisting of horizontal and vertical movements and oblique scrolling movement.
Task level two: a search pattern for trend finding and comparing (see figure 7)
There was no obvious difference between PDF and Table Browser format table search patterns. Both show vertical and horizontal movements in the row/column header areas and oblique scan paths (scrolling). However, far less fixation points are shown in the row header area in the Table Browser format, which means less vertical movements were required. This is due to the fixed column header used in the Table Browser format. In the PDF format, subjects had to move up and down to get information in the column header area because column header disappears when scrolling down the screen.
Figure 7: Search patterns for trend finding and comparing between columns in the PDF vs. TB formats. Both formats show the same overall search patterns. In the TB format, fixation points in the column header area decreased.
Task level three: a search pattern for comparison between columns (see figure 8) Differences of search patterns are obvious between the PDF and Table Browser format tables. In the PDF format table, it is obvious that the eye moved back and forth
However, compared to the PDF format, horizontal movements are relatively denser in the column header area in Table Browser format as the user spent some time to drag the columns.
Figure 8: Search patterns for column comparison are different in the PDF vs. TB formats. Subjects needed to compare two distantly separated columns in a table. With the TB format, the subject dragged and put the two columns together at the right side of the table. With the PDF format, the subject spent much more time to move back and forth horizontally.
4.2.2 Searching Efficiency
Several parameters were used to evaluate searching efficiency between the various groups. Total Searching Time and Fixation Points are used to as the main parameters, while mean fixation time and fixation duration in header areas are also used in the following results.
4.2.2.1 Total Searching Time and Fixation Points 4.2.2.1.1 Expert vs. Non-Expert
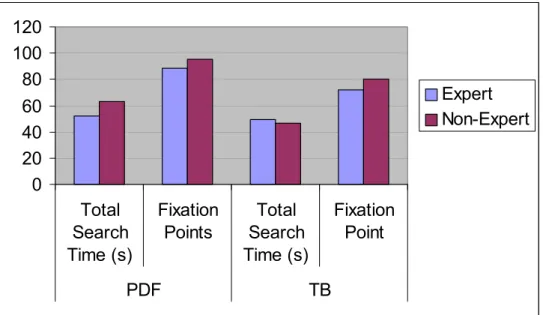
of expert and non-expert’s total search time for questions at different levels with the PDF and Table Browser formats. Experts spent slightly less time than non-experts in the PDF format, while non-experts spent no more time than experts in the Table Browser format. Although there were too few subjects to rigorously affirm any differences, these data suggest that the TB may assist non-experts in overcoming some deficiencies due to statistical experience. 0 20 40 60 80 100 120 Total Search Time (s) Fixation Points Total Search Time (s) Fixation Point PDF TB Expert Non-Expert
Figure 9: Searching efficiency comparison of experts and non-experts in the PDF and TB formats by Total Search Time and Fixation Point Number.
0.00 20.00 40.00 60.00 80.00 100.00 120.00
Level 1 Level 2 Level 3 Level 1 Level 2 Level 3
PDF TB
Total Search Time (s
)
Figure 10: Searching efficiency comparison of experts and non-experts by total search time with different level questions in the PDF and TB formats.
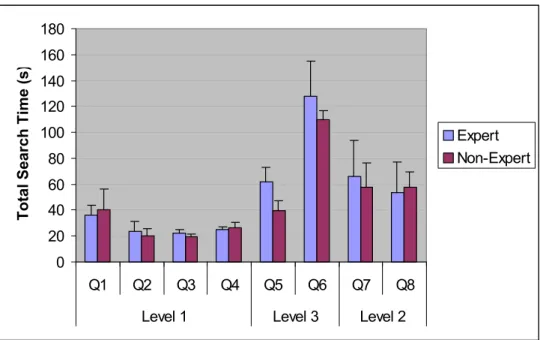
Figure 11 and 12 compare the total searching time of expert and non-expert users for each question with the Table Browser format. These data show little difference between experts and non-experts when using the Table Browser format.
0 20 40 60 80 100 120 140 160 180
Q1 Q2 Q3 Q4 Q5 Q6 Q7 Q8
Level 1 Level 3 Level 2
Total Search Time (s
)
Expert Non-Expert
Figure 11: Comparison of expert and non-expert users’ searching efficiency in the TB format by total search time shows there is no obvious difference.
0 50 100 150 200 250 300
Q1 Q2 Q3 Q4 Q5 Q6 Q7 Q8
Level 1 Level 3 Level 2
Fixation Point
s
Figure 12: Comparison of expert and non-expert users’ searching efficiency in the TB format by fixation point number shows there is no obvious difference.
4.2.1.1.2 PDF vs. Table Browser Format
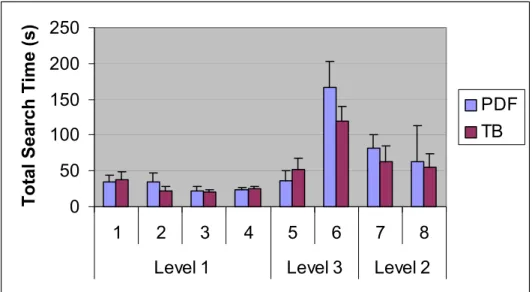
Figure 13 and 14 show total fixation points and total searching time for every question in both formats: PDF and Table Browser. There is no obvious difference between these two formats at level I questions. But as the difficulty level of questions increases, subjects spent fewer fixation points and less total search time with the Table Browser than the PDF format. * For level 3, question 5, see details in the discussion section.
0 50 100 150 200 250
1 2 3 4 5 6 7 8
Level 1 Level 3 Level 2
Total Search Time (s)
PDF TB
0 50 100 150 200 250 300 350 400
1 2 3 4 5 6 7 8
Level 1 Level 3 Level 2
Fixation Points
PDF TB
Figure 14: According to total fixation points at different question levels, there is no significant difference at level I questions. However, as the difficulty level of question increases, subjects spent fewer fixation points in the Table Browser than in the PDF format.
4.2.2.2 Mean Fixation Time
0 0.2 0.4 0.6 0.8 1 1.2
Q1 Q2 Q3 Q4 Q5 Q6 Q7 Q8
Level 1 Level 3 Level 2
Mean Fixation Time (s)
PDF TB
Figure 15: No difference in mean fixation time between the PDF and TB formats in each question.
According to user group, it seems that non-expert users use shorter mean fixation time than experts (see figure 16). But with a T test, no significant difference was found.
0 0.2 0.4 0.6 0.8 1 1.2
Q1 Q2 Q3 Q4 Q5 Q6 Q7 Q8
Level 1 Level 3 Level 2
Mean Fixation Time (s)
Expert Non-Expert
4.2.2.3 Fixation duration in Row/Column header area
Compared to the PDF format, users spent a slightly smaller percentage of fixation duration in both row and column header areas in the TB format (see figure 17). In the PDF format, 42.5% of total fixation durations were in the column/row header while in the TB format 37.9% of fixation durations were at these regions. More specifically, figure 18 shows that for level one questions, the percentage of fixation duration in header area are at the same level in both format, but as the difficulty level increases, fixation duration in table header areas was less in the TB format than the PDF format.
0 5 10 15 20 25 30 35 40 45
Row Header Column
Header
CH & RH
%
PDF TB
0 10 20 30 40 50 60
Q1 Q2 Q3 Q4 Q5 Q6 Q7 Q8
Level 1 Level 3 Level 2
%
PDF-T TB-T
Figure 18: Percentage of fixation duration in column/row header for different level question.
4.3 Post-test Survey
4.3.1 User Preferences
Most subjects gave high praise to the Table Browser, even though they pointed out that the Table Browser still has many functions that need to be improved or updated. Most subjects give a 7 of 9 points to express their satisfactions. The average score for the Table Browser format is 7.07 of 9 points. For the PDF format, simplicity is regarded as the most important feature, with the highest score, 5 of 9 points. Rigidity is the most unacceptable feature with 2.5 of 9 points.
User Satisfaction Table Browser PDF
Terrible/wonderful 7.29 3.50
Frustrating/satisfying 7.29 3.00
Difficult/easy 7.00 5.00
Rigid/flexible 6.71 2.50
Total preference 7.07 3.50
4.3.2 Comments and Suggestions
Subjects gave many comments and suggestions based on their experience: About the Table Browser:
• “Great program --much better than anything I've ever seen.”
• “It would have been easier to move rows up & down like columns. --Have commas.”
• “Delayed reaction to some commands --However, the table browser was impressive! Great experiment!”
• “The potential for this product is excellent. I can see how it would be useful in my current workplace, --the EPA. It was a little awkward to use at first but I'm sure with more experience it would be much easier. Some suggestions for additions to the product include being able to move the rows to sit next to each other and a reset/undo button or function on the menu bar would be very useful.”
• “I thought that the "." was a comma (table 26) difference between 1970-1997. I really enjoyed the ability to move an entire column anywhere on the table. I would have liked to do that to a row as well.”
• “I like fixed header & column dragging features! I wish you could drag rows too, thanks!”
• “I got lost somewhere in "compactness" of data and slow refresh rate of slide bars. Liked the quick tools for row, col., lock, etc. Browser was the best way I've viewed statistical data based on tool accessibility and functions.”
• “I hadn't used PDF file to read tables. I never know that this could be so terrible. I would rather read those data in a database table than PDF file.”
Chapter 5: Discussion
5.1 Table Issue
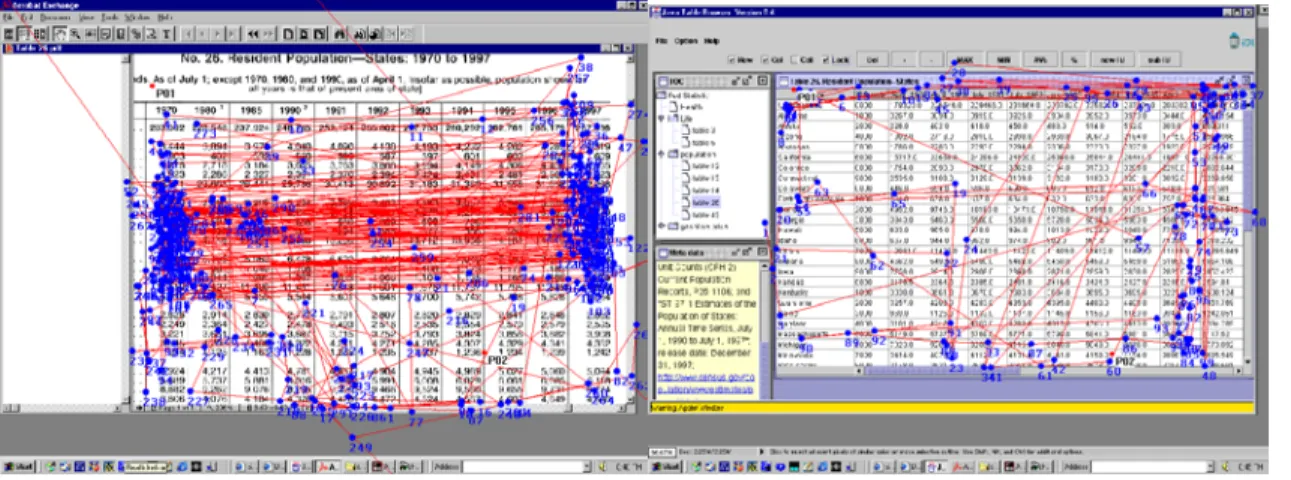
One aim of this study was to compare the searching efficiency. So we followed the rule: the same tables in both PDF and TB format are the same size and show the same amount of information in the first screen. But as pointed out earlier in the Method section, table 26 in the TB format is quite different from the table in the PDF format. Figure 19 shows the detail about table 26 in the PDF vs. in the TB format. Table 26 in the PDF format has 12 columns and 52 rows, totalling 624 cells. Table 26 in the TB format has 23 columns and 52 rows, totalling 1196 cells. So table 26 in the TB format is almost double the size of table 26 in the PDF format.
To answer our questions (question 5 and 6) using table 26 required subjects to scroll back and forth horizontally. So we can imagine that answering the same question in the TB format table takes almost double the effort needed in the PDF format table. For example, in question 6, (“Compared to the population information from 1997, which two states have decreased in population size since 1970?”) the two compared columns (in red
without using specific function. So now we are quite sure to say that it is more efficient to search in a TB format table than in a PDF table for level 3 questions.
Figure 19: comparison of table 26 in the PDF and TB format. The upper table shows table 26 in the PDF format and lower one is table 26 in the TB format. Two compared columns are highlight in red frames in both two tables. Blue frames shows that two compared columns can be showed on a single screen in the PDF format, while in the TB format it is impossible without specific function.
(interface) -- TB format. But now the PDF version of table 26 hasn’t been updated while the Table Browser uses a later version. Second, how to show and manipulate a large table (larger than one screen) is a big problem to all the table format designs. We can not avoid this problem to discuss or design an interface. In fact, this is one of the reasons the TB was created to better handle large tables. In the TB format, table manipulation becomes quite easy with functions such as “drag”, highlight and so on. Though table 26 is not exact same table in two formats, we can still get important information to test and improve our design.
5.2 PDF and Table Browser
Table Browser should have a prosperous application potential and it is a direction of the future interface design.
Another interesting thing is the searching efficiency difference between experts and non-experts. In the PDF format, experts spent less time and fixation points than non-experts, which indicates that statistical experience is helpful for user to learn how to search in the PDF format table. However, there is no big difference between experts and non-experts in the TB format table. We believe that the reason (still need to be further proved) is that the TB format fit the general users’ searching habits. In another word, the Table Browser, as a user-oriented design, may assist non-experts in overcoming some deficiencies due to statistical experience.
In summary, when searching large or complex statistical tables, the Table Browser provides more efficiency and a more user-friendly interface than the PDF format; when performing simple searches in a small and straightforward table, there is no obvious efficiency difference between the two formats.
5.3 Functions and Limitations of the Table Browser
In this study, most subjects expressed their appreciation for functions provided by the Table Browser. From our study, we found strong support for positive effects on table and data manipulation as a whole. Some functions are specifically promising for a table interface.
Dragging Function
Almost all subjects pointed out that they liked the column dragging function very much. By using the dragging function, it is quite easy to make huge table into a smaller one. So a difficult job can be easily changed into a simple one. At this point, the dragging
function works only on columns, and it is highly suggested that row dragging function can also be added as a useful function.
Highlight Function
detail.) Some subjects suggested that this function should always be set as a default function instead of selecting it.
Header Functions
In the Table Browser, the column header is fixed in the vertical direction (Y axis). So no matter how far you need to scroll up and down, the column header is always there. This increases the searching efficiency a lot by decreasing up and down movements to go back and get column header information. At the same time, the Table Browser provides a lockable row header giving a flexible way to manipulate tables. If needed, the row header can be locked, potentially avoiding use of the horizontal scrolling bar.
Limitations of the Table Browser
Although the Table Browser does improve the table and data manipulations, some limitations still exist and need to be improved.
• Row dragging function could be as useful as column dragging function if provided.
• When dragging a column more than one screen, the horizontal scrolling bar should automatically follow the drag movement linearly. The implementation tested here only allowing dragging on one screen, then use of the scroll bar to move to the next screen horizontally before continuing to drag the column again. • Making data presentation more consistent. For example in table 26, the number
• A “Reset” or “Undo” button/function will be helpful since any table or data manipulation is temporary.
5.4 Limitations of this Study
Even though our study presented interesting and useful information about the usability of the Table Browser, the study itself has its own limitations:
• Sample size is not big enough to evaluate statistical hypothesis, even though our study does give some useful information.
• Subjects should be randomly selected from the general population. In our study, subjects are all students at UNC-CH. So subjects are not good representatives of the general population. We selected subjects based on email-reply. It was not a random selection method.
• Another problem is the eye-tracking system itself. One of the advantages of the ASL 405 eye tracking system is head free, but we do find head free caused
problem some time. All subjects lost eye tracking for a (very) short period of time because of their head movements.
• During our test, subjects were required to finish tasks without help. No social communication (discussion), no verbal expression were used in this study. This may not exactly reflect the users’ actual environment.
Chapter 6: Conclusion and Acknowledgement
6.1 Conclusion
Eye movement is used to provide preliminary data and first hand information for the Table Browser design evaluation and improvement in this study. Users’ search patterns were recorded and searching efficiency was compared by parameters such as Total searching time, fixation points and fixation durations. Compared to the traditional PDF format, the Table Browser provided more choices for table/data manipulations. It was extremely useful to deal with a difficult search in a large and complex table by using the TB format table. The Table Browser improves the searching efficiency by making comparisons and alternative views useful in trend analysis more efficient. For a simple search in a simple table, there was no obvious difference between these two formats.
6.2 Acknowledgement
Bibliography
Chessman, L. (2000). Table Browser Usability Study. Master paper, School of Information and Library Science, UNC-CH, November, 2000.
Jacob R.J.K. (1991). The use of eye movements in human-computer interaction
techniques: What you look at is what you get. ACM Transactions on Information Systems, Vol. 9,No. 3, April 1991, 152-169.
Jacob R.J.K. (1995). Eye Tracking in Advanced Interface Design. In W.Barfield and T. Furness (eds.). Virtual environments and advanced interface design. Oxford University Press, Oxford, 1995.
Just, M.A. and Carpenter, P.A. (1976). Eye fixations and cognitive processes. Cognitive Psychology 8, 1976, 441-480.
Marchionini, G and Greene S. (1997). Public access and use of government statistical information. NSF Government Information Workshop White Paper.
http://ils.unc.edu/~march/govinfo_paper.html
Marchionini, G., Hert, C., Liddy, L & Shneiderman, B. (2000). Extending Understanding of Federal Statistics in Tables. Paper presented at the ACM Conference on
Universal Usability, November, 2000.
Mu, X. (2000). Java Table Browser: Transportation and Presentation of Large Statistical Tables Over Network. Master paper, School of Information and Library Science, UNC-CH, May, 2000.
Sibert L.E. & Jacob R.J.K. (2000). Evaluation of eye gaze interaction. Proceedings of the CHI 2000 conference on Human factors in computing systems, 2000, 281-288. Schroeder W. (1998). What is Eye Tracking Good For. Eye For Design, 1998.
http://world.std.com/~uieweb/eyetrack2.htm
Xu, A. (2000). Eye Tracking Study on Identifying and Analyzing User Behavior - Eye Movements, Eye Fixation Duration and Patterns - When Processing Numeric Table Data in Paper or PDF Format. Master paper, School of Information and Library Science, UNC-CH, November, 2000.
Appendix A: Consent Form
Consent Form for Table Browser Interfaces: Eye-tracking Study
Purpose of this Study
We are inviting you to take part in a research study on how people process tables. We will conduct eye-tracking studies of online table usage. Dr. Gary Marchionini is the Principal Investigator of this research project.
The eye-tracking methods
The pan/tilt optics module provided with the system is positioned more than one foot from your eyes. The module consists of an eye camera with a ring of near infrared LEDs around the lens opening. The LEDs emit an illumination beam that is trained on the retina; the optics module lens captures the light that is reflected back, resulting in a brightly lit image of the pupil. The optics module also captures the reflection of the illumination beam from the surface of the cornea - the corneal reflection. In addition, a magnetic head tracker is used in conjunction with the eye tracker to provide position data when the eyes are closed. The system measures the separation between the pupil and the corneal reflection and calculates the point of gaze.
Number of Participants
There will be approximately 10 participants. What Will Happen During the Study
As a participant you will be asked questions regarding your experience with statistics and searching for statistical information in an electronic environment. After this you will be asked to complete a series of information finding and question answering tasks. To accomplish this you will be presented with statistical tables on a computer screen. The investigator will give you verbal instructions, and will ask you 8 questions one by one. During your searching, you can ask the investigator to repeat the question as often as you like. Once you have completed the tasks, the investigator will ask you a few questions regarding your experience with the tasks and your comments about the eye-tracking system.
Your Privacy is Important
Risks and Discomforts
You will not be subjected to risks other than those experienced in a traditional office situation. The eye-tracking equipment uses a camera positioned more than one foot from the subject to track eye movement and reflects infrared light at a level at least an order of magnitude (ten times) lower than what is considered to be safe. The safe chronic ocular exposure estimates for near infrared exposure is 10 mW/sq.cm (David Sliney of US Army Environmental Hygiene Agency and Myron Worbarsht of Duke University Medical Center) and our ASL device uses between 0.1 and 0.3 mW/sq. cm on average. The head tracker receiver is positioned 12-24 inches from the transmitter that produces a magnetic field between one-eighth and one-quarter (depending on head position) of the normal earth field of 0.6 gauss (manufacturer specifications). This configuration of eye and head tracker supplied by ASL Laboratories has found wide applications in
government, university, and corporate laboratories. Your Rights
You will be paid $20 for your participation in the eye-tracking study, which should last approximately 1 hour. You are free to refuse to participate or to withdraw from the study at any time without penalty and without jeopardy. You will be paid for the time you have completed.
Institutional Review Board Approval
The Academic Affairs Institutional Review Board (AA-IRB) of the University of North Carolina at Chapel Hill has approved this study. If you have any concerns about your rights in this study you may contact the Chair of the AA-IRB:
Barbara Davis Goldman, Ph. D. AA-IRB Chair
CB# 4100, 201 Bynum Hall UNC-CH
Chapel Hill, NC 27599-4100 962-7761
I have had the chance to ask any questions I have about this study, and they have been answered for me.
I have read the information in this consent form, and I agree to be in the study. I understand I will get a copy of this consent form after I sign it.
Appendix B: Pre-test Demographic Questionnaire
Your answers to the following questions will help the study researchers to analyze the test results.
Participant ID ____________
Age ____ Gender Male _____
Female _____
To control for different levels of computer/software and statistical literacy, please help us with the following information:
1. How often do you use a computer?
Never Occasionally Monthly Weekly Daily
2. What applications do you use? (Please check all that apply) Email Word Processing Web Surfing Games Database Multimedia Programming
3. Have you ever taken a statistical course?
Yes No
If yes, when did you take it, choose all that apply:
High School College Graduate Study Professional Training 4. Please select any statistical software package(s) you have used:
We’d like to know how often you use statistical tables. Please check the response that best represents your experience.
5. Please tell us how many times you have used the following tables (including both paper and electronic formats):
Stock market tables/listings
None 1-5 6-15 >15
Time schedule tables (e.g. bus, airline, class schedule)
None 1-5 6-15 >15
Consumer information tables (e.g. cost comparison tables)
None 1-5 6-15 >15
Nutritional labels (e.g. cereal box)
None 1-5 6-15 >15
Research results in articles
None 1-5 6-15 >15
Government statistics on the Web (e.g. health, demographic tables)
None 1-5 6-15 >15
Tax tables
None 1-5 6-15 >15
6. Have you used Fedstats (www.fedstats.gov)?
Yes No
7. How often have you used data in tables from government Web sites? Never Occasionally Monthly Weekly Daily 8. How often have you used statistical tables on the Web?
Appendix C: Post-Tasks Survey
PID ____________
1. Please circle the numbers, which most appropriately reflect your impressions about using the PDF tables.
Not Applicable = NA. a. Overall reactions to the PDF tables: terrible wonderful
1 2 3 4 5 6 7 8 9 NA
b. frustrating satisfying
1 2 3 4 5 6 7 8 9 NA
c. difficult easy
1 2 3 4 5 6 7 8 9 NA
d. rigid flexible
1 2 3 4 5 6 7 8 9 NA 2. Please circle the numbers, which most appropriately reflect your impressions about using the Table Browser.
Not Applicable = NA. a. Overall reactions to the Table Browser: terrible wonderful
1 2 3 4 5 6 7 8 9 NA
b. frustrating satisfying
1 2 3 4 5 6 7 8 9 NA
c. difficult easy
1 2 3 4 5 6 7 8 9 NA
d. rigid flexible
1 2 3 4 5 6 7 8 9 NA
Please write your comments about the tables here:
Appendix D: Questions
Start time:
1. (Life table #3) In 1996 how many more years was a 50-year-old (or 40-year-old) woman expected to live?
2. (Population table #14) In 1997 what was the resident population of all females?
3. (Population table #14) In 1988 what was the resident population of the 15-19 years age group?
4. (Population table #26) What was the population of Utah (or New Jersey) in 1994?
5. (Table 26) By how much did the overall population increase between the (April) 1970 and (April) 1990?
6. (Population table #26) Compared to the population information from 1997, which two states have decreased in population size since 1970?
7. (Life table #3) Across all groups, what happens to the difference in life expectancy between males and females as people age?
8. (Life table #5) What happened to the difference in age expectancy of males and females between 1929 and 1996?

![Cytochrome P450 Monooxygenase Mediated Metabolic Utilization of Benzo[a]Pyrene by Aspergillus Species](data:image/gif;base64,R0lGODlhAQABAIAAAP///wAAACH5BAEAAAAALAAAAAABAAEAAAICRAEAOw==)