Emily E. Corbin. Comparing Video Tutorials and Slide Show Tutorials: A Library Usability Study. A Master’s Paper for the M.S. in L.S. degree. March, 2014. 87 pages. Advisor: Robert Capra.
This paper presents the results of a usability study comparing online video tutorials and online slide show tutorials. This study focused on four basic instructional library
tutorials: How to Request a Book from the Library Service Center, How to Recall a Book that is Checked out, How to Create a Document Delivery Account, and How to create a Refworks Account. Patrons were randomly shown two tutorials in video format and two tutorials in slide show format. The goal of this study was to determine whether patrons preferred viewing these tutorials in the video format or in the slide show format. The patrons’ ability to complete the specified task after watching the two types of tutorials was also measured. Results of this study identify areas where the online tutorials could be improved and suggest recommendations for changes.
Headings:
Library Instructional Design Usability Study
E-Learning
COMPARING VIDEO TUTORIALS AND SLIDE SHOW TUTORIALS: A LIBRARY USABILITY STUDY
by Emily E Corbin
A Master’s paper submitted to the faculty of the School of Information and Library Science of the University of North Carolina at Chapel Hill
in partial fulfillment of the requirements for the degree of Master of Science in
Library Science.
Chapel Hill, North Carolina April 2014
Approved by
Table of Contents
Introduction ... 3
Literature Review... 5
Methodology ... 12
Evaluation Measures ... 15
Results ... 17
Success Rate... 17
Time-On-Task ... 19
Error Rate ... 21
User Subjective Satisfaction ... 24
Mouse Clicks ... 33
Comparing the Results of Video Watchers vs. Slide Show Watchers ... 35
Comments, Responses, and Observation ... 41
Tutorial Preference... 41
Suggested Tutorial Improvements from Participant Comments ... 42
Pacing ... 42
Overall appeal/organization of content ... 43
Usefulness of Content ... 44
Finding Books in the catalog ... 45
Self- Confidence and Error Rate ... 46
Exit Questionnaire ... 47
Discussion ... 50
Recommendations ... 52
Conclusion ... 53
References ... 54
Appendix A ... 57
Appendix B ... 58
Appendix C ... 59
Appendix D ... 61
Appendix E ... 62
Appendix F... 66
Appendix G ... 68
Introduction
Online library instruction has become a common practice among academic libraries in the United States. With the increase of students both on campus and at a distance, academic libraries have been forced to expand beyond their physical walls. Because of this virtual expansion, librarians are often unable to meet face-to-face with every student. Online library tutorials allow librarians to meet patrons where they are, in their homes or across the county, and explain important library tasks and concepts. Online library tutorials can also assist patrons who attend physical library instruction sessions and miss important information. Each patron comes from a different
background with unique informational needs and it is difficult for a librarian to meet each and every need in a generalized instruction setting. Mestre (2012) and Bowles-Terry, Hensley, and Hinchliffe (2010) pointed out that online tutorials allow patrons to
individualize their learning and receive point of need assistance within the library website and thereby improve their researching skills.
include any voice over and they were published on YouTube. In comparison, slideshows are more like Power Point presentations that the user can view in a web-page. The patron can click through the slides at their own pace. For this study the slideshows included text bubbles, but they did not include mouse movements or a voice-over.
In the fall of 2013 Duke University Libraries updated their website. Along with this update, the online library tutorials were updated to Camtasia screencast tutorials. The main purpose of this study is to determine if one tutorial format is more effective than another at delivering library instruction. A secondary aspect of this study is to explore patron preferences for specific formats.
Literature Review
Most current undergraduate students do not remember a time when they did not have access to the Internet. These students are used to the instant access of information that the Internet can provide. Their experience with Google and other online searching tools has led to their increased sense of confidence that if something is available online; they will be able to find it. This overconfidence has slipped into their scholarly research as well. Often undergraduates’ prior familiarity and comfort with the internet causes them
schedules. Additionally, many librarians feel the pressure to meet a growing student population with limited resources; online tutorials allow librarians to provide resources to this wider population.
While online library tutorials have become a common theme for academic libraries, there is still some disagreement about what type of online tutorial is best for patrons. Tempelman-Kluit (2006) focused her studies on the dual-coding theory and the cognitive load theory in reference to online library instruction. She explained that according to the dual-coding theory, patrons learn best with more than one method of presentation; for example if the visual and verbal channels are paired together. She also explained that the cognitive load theory focuses on the fact that the working memory is finite. Therefore, it is best to engage two forms of presentation, such as visual and verbal, to minimize the demand on the working memory. Because of her research, Tempelman-Kluit (2006) concluded that screencasts, or videos, would be a better type of library tutorial. Screencasts can simultaneously include visual cues and audio narration, thereby lowering the cognitive load for patrons.
This is in contrast to the study performed by Lori Mestre (2012) comparing HTML tutorials and video tutorials. Mestre (2012) found that students performed better on post-tests after viewing still Web page tutorials with screenshots than they did after watching a screencast tutorial. Additionally, the students expressed a preference for the static Web page tutorials because it was easier for them to skim the information and find exactly what they needed.
cognitive load theory in their studies as well and they found that patrons perform better when illustrations and audio instructions are paired together rather than when illustrations and text instructions are paired together. Other studies by Kalyuga, Chandler, and
Sweller (1999) and Tindall-Ford, Chandler and Sweller (1997) reinforced the cognitive load theory and found that patrons perform better when they are provided with audio and visual learning, rather than just visual learning. When patrons were provided with audio and visual learning they spent less time on problems, they reported less effort when learning, and they achieved higher test scores.
Another important issue for online tutorials is interactivity. Tempelman-Kluit (2006) pointed out that video tutorials can decrease cognitive load by providing visual and auditory stimulation, but they do not have the capability for interactivity. In
comparison, web-based library tutorials using screenshots provide a text heavy learning environment that can increase the cognitive load, but they provide some interactivity by allowing the user to jump between slides. The question remains however, what does interactivity mean? Slebodnik and Riehle (2009) defined interactivity as the ability to click between slides, like in a web-based tutorial using screenshots. In contrast, Dewald (1999) determined that interactivity should include engaging games or simulations. Stwinter (2013) also pointed out that interactivity could include a quiz or self-assessment at the end of the tutorial. Sult et al., (2013) used tutorials that included a “Guide on the Side” to ensure that patrons would interact with the live library database on one side of
When considering interactive tutorials, it is important to take into consideration the length of time it takes to make them. Often, librarians are being asked to create these tutorials on top of their other responsibilities. Sult et al., (2013) found that especially when it came to interactive tutorials the librarians felt that the tutorial upkeep was not maintainable. Sult et al., (2013) also found out that while interactivity is important, librarians need to be able to see specific topics or areas where patrons are struggling. Silver and Nickel (2006) and Crowther, Keller, and Waddoups (2004) also pointed out the down side to online tutorials. Even though online library tutorials have many benefits they require constant maintenance and upkeep, which could take up additional time and money.
With online tutorials becoming an important trend in the academic library world, it is essential to ensure that these tutorials are actually effective. Battleson, Booth, and Weintrop (2001) and Sobel and Sugimoto (2012) emphasized the importance of assessing patron progress after receiving library instruction. Crowther et al., (2004) pointed out that usability testing should be done as early in the process of creating a tutorial as possible. This would allow for any kinks and technical problems to be fixed early on. These usability tests can be beneficial when trying to determine what type of tutorial patrons find easier to use and are therefore more likely to utilize. Nielson (2006) identified four usability measures when looking at online resources. These are:
Success rate (whether users can perform the task at all) The time a task requires
The error rate
One can evaluate the effectiveness of the online instruction tutorials for a given task by using these four usability measure to analyze patrons’ ability to perform the task after
watching the tutorial.
Another important aspect to consider when creating usable tutorials is patron preference. Patron preference can be determined through studies. Bowles-Terry et al., (2010) examined the usability, findability, and instructional effectiveness of instructional videos at the University of Illinois by employing usability studies. Their findings
indicated several best practices for instructional videos as a whole. Bowles-Terry et al., (2010) found that in online screencast library tutorials the pace should be slow, the length should be short, the most important information should be put at the beginning of the tutorial, and they should be linked at the point of need. Mestre (2012) studied patron preference for tutorial design using the standards effectiveness, efficiency, and satisfaction and found that patrons preferred static web pages over videos. She also pointed out that patrons found static web pages easier to navigate and they did not like searching through video tutorials to find a specific step. Mestre (2012) also suggested that to be successful, tutorials need to be consistent and task- and concept- based so that patrons can transfer what they have learned to other contexts. Crowther et al., (2004) also studied the effectiveness of online tutorials and they found that patrons preferred the interactive aspects of the tutorials. Crowther et al., (2004) emphasized that the majority of patrons saw online library tutorials as a supplement to classroom instruction as opposed to a replacement. Paechter and Maier (2010) performed a study that supported
Crowther’s combination of classroom and online instruction session. They found that
need. However, Lindsay, Cummings, and Johnson (2006) pointed out that just because patrons like a tutorial does not mean that they actually learn from it.
It is important to consider patron preferences when creating online tutorials. There are many different approaches to creating online library tutorials. Blevins & Elton (2009) compared three different tutorial-creating software programs: Camtasia, PowerPoint, and MediaSite. They evaluated the software using four criteria: usability, accessibility, cost, and time to create the tutorial. Blevins & Elton (2013) found that Camtasia delivered the best results for database instruction, it was low-cost, it provided high-usability, and it required relatively little time to create a tutorial. Charnigo (2009) also evaluated
Camtasia software for library instruction use. She felt that Camtasia was flexible and easy to use, supported the creation of brief and to the point tutorials, but that it was only
effective when being used to demonstrate how something works. Charnigo (2009) pointed out that Camtasia is not as successful in supporting the explanation of concepts.
Faculty involvement is another important part of the creation of instructional tutorials. Appelt & Pendell (2010) found that faculty involvement in the creation of library tutorials can increase patron use of the tutorials, especially if faculty members require the tutorials for their class. Additionally, faculty input during tutorial creation can ensure that the tutorial covers relevant topics for the class. Appelt & Pendell (2010) point out that faculty appreciated being involved in library tutorials, and when faculty were included, the librarians and faculty members created a more successful tutorial.
content, use of language, and tests. Bury and Oud (2005) emphasized the value of performing usability testing to provide insights into how to improve the tutorial in the future.
Methodology
The goal of this study is to determine through usability testing whether patrons prefer and perform more efficiently after viewing a screencast tutorial or a slide-show tutorial. A total of 20 UNC-CH students were recruited as participants for this study (non-probability convenience sampling). Participants viewed four tutorials from the Duke Library website. Following their participation, participants were each offered a $10 Amazon gift card. The funding for this study was provided by the UNC School of Information and Library Science.
Participants were asked to work through four library tutorials. They completed the study in approximately 15-20 minutes. The participants were asked to view the tutorial and then complete the corresponding task. The tutorials included:
Requesting a Book from the Library Service Center (an off-site storage facility)
Recalling a Book that is Checked Out Creating a Document Delivery Account
Creating a RefWorks Account
After viewing the Library Service Center (LSC) tutorial patrons were asked to
find and request Little Women, by Louisa May Alcott with the call number 813.41 A355LS c.1. This version of the book was located in the LSC. Since UNC-CH patrons do not have Duke I.D.’s they were not able to officially request the book, but they began the process and were stopped by the experimenter when they were asked to input their I.D. and password.
After viewing the tutorial on “How to recall a book that is checked out” patrons
were asked to find and recall To Kill a Mockingbird by Harper Lee with the call number PS3562 .E353 T6 1999. During the study this book was checked out. Since UNC-CH patrons do not have Duke I.D.’s they were not able to officially recall the book, but they began the process and were stopped by the experimenter when they were asked to input their I.D. and password.
After viewing how to create a document delivery account patrons were asked to
follow the tutorial instructions and begin the process of creating a delivery account. Since UNC-CH patrons do not have Duke I.D.’s they were not able to officially create an account, but they began the process and stopped when they were asked to input their I.D. and password.
After viewing how to create a RefWorks account participants were asked to
After completing each task participants filled out a Post-Task Survey. The
participants were asked to respond to questions to determine their personal satisfaction with the previous tutorial.
After viewing the tutorials, completing the tasks, and finishing the Post-Task surveys, the participants were then asked to complete a Post-Test Questionnaire to compare the two types of tutorials and rate their confidence level.
Evaluation Measures
Participants were randomly given two screen cast tutorials and two screenshot web-based tutorials from the previously described set of topics. After viewing each tutorial participants performed the associated task on a computer that recorded their interactions using Camtasia Software.
The following measures, gathered from Stroscio (2010) and Nielsen (2001), were used to assess how efficiently participants were able to complete the tasks after viewing the tutorials.
Success Rate: Whether users can perform the task explained in the tutorial. This is
a binary response; participants either complete the task assigned, or they do not complete it. The Success Rate only looks at the end result. If the participant was able to complete the task that was described in the online tutorial, then they succeeded. Any missteps during the completion of the task were recorded using the Error Rate below.
Time on task: The length of time spent completing a task
Error Rate: This is considered a deviation from the optimal navigation path. For
binary response; either the participant deviated from the optimal path or they did not. Duplicate errors for each task are not recorded. Even if the participant was able to complete the task, if they deviated from the optimal path at any point while completing the task, then an error was recorded. The participants were not alerted to the fact that they had committed an error and they were allowed to continue with the task after they had committed an error.
User Subjective Satisfaction: measured by the survey questions answered after
each task.
Mouse Clicks: The number of times the participants clicked the mouse during
each task.
Comments, Responses, and Observations: These were gathered from the
participants’ comments as they “thought aloud” while performing the tasks and
Results
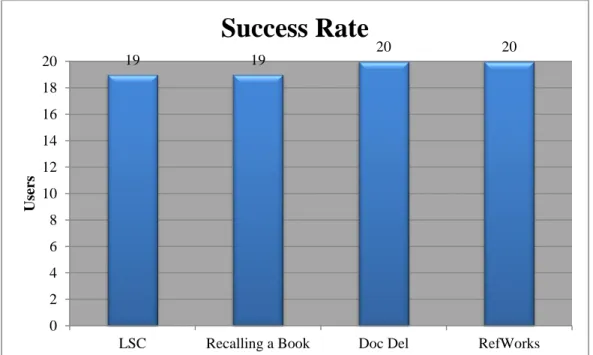
Figure 1: Success Rate
Success Rate
Figure 1: Success Rate shows the number of participants who were able to complete each of the four tasks assigned. 19 out of 20 participants were able to complete the first task of locating a specified book that was in the Library Service Center and beginning the process of requesting it through the process explained in the tutorial. The participant who did not complete the task could not find the correct book in the catalog and ended up giving up the search.
19 19 20 20
0 2 4 6 8 10 12 14 16 18 20
LSC Recalling a Book Doc Del RefWorks
Users
Task 1, “Requesting a Book from the Library Service Center” entailed two main
parts. First participants had to find the book, and then they had to request the book from the Library Service. The tutorial that participants watched gave explicit instructions on how to request the book from the LSC, but it did not provide any guidance on how to find the book in the catalog. The fact that the tutorial did not explain how to find books in the catalog is the most likely reason why this participant had trouble locating the book.
Time-On-Tas
k
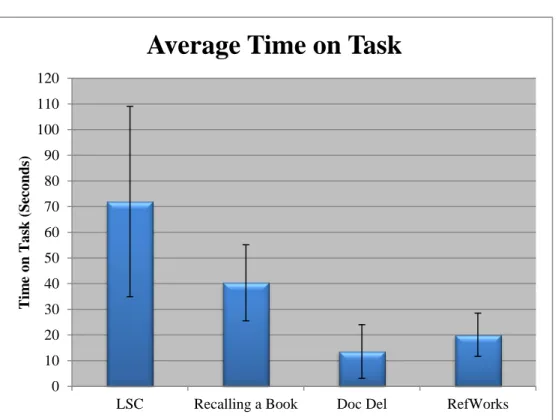
Figure 2: Average Time on Task
Times that users took to complete each of the four tasks were averaged together and are shown in Figure 2, along with error bars indicating plus and minus one standard deviation. Task 1, “Requesting a book at the Library Service Center” had the largest disparity in time. The longest a participant spent on Task 1 was 144.03 seconds. Viewed as a whole, Task 1 took participants the longest to complete, with Task 1’s average
(71.98 seconds) at 30.64 seconds above the next closest time, Task 2 (40.34). Task 1 most likely took the longest amount of time on average because participants had the most difficulty locating the book associated with this task. Task 2, “Recalling a Book that is Checked Out”, took participants the second longest average time to complete at 40.34
0 10 20 30 40 50 60 70 80 90 100 110 120
LSC Recalling a Book Doc Del RefWorks
T im e o n T a sk ( Seco nd s)
seconds. This is most likely because participants also had to locate a book in the catalog to complete this task and they had difficulty searching for the book.
Error Rate
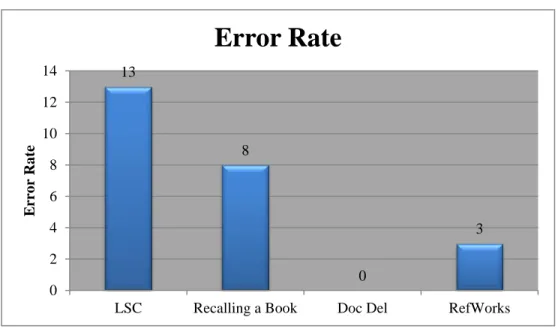
Figure 3: Error Rate
The Error Rate is defined as a deviation from the predetermined optimal
navigation path. For example, if there are two ways to perform a task, in this study, the most efficient path is considered optimal, and any other paths are defined as an error. Any deviation from the optimal path is considered an error. The Error Rate is a binary response; either the student deviated from the optimal path or they did not. Duplicate errors for each task are not recorded. Even if the participant was able to complete the task, if they deviated from the optimal path at any point while completing the task, then an error was recorded. The participants were not alerted to the fact that they had
committed an error and they were allowed to continue with the task after they had committed the error.
It is important to note that there were two very distinct portions of the tasks for Task 1, “Requesting a Book from the Library Service Center”, and Task 2, “Recalling a
13 8 0 3 0 2 4 6 8 10 12 14
LSC Recalling a Book Doc Del RefWorks
Book that has been Checked Out”. For these two tasks students first had to find a book in
the library catalog and then secondly they had to request or recall this book. The tutorial that they had just seen described how to request or recall the book, but it did not describe how to find the book in the library catalog. As a result, 12 of the 13 recorded errors for Task 1, “Requesting a Book from the Library Service Center”, were associated with
selecting the wrong book in the catalog. For Task 2, “Recalling a Book that has been Checked Out”, 7 out of the 8 errors recorded were associated with selecting the wrong book in the library catalog. Even though these errors were not associated with the tasks explained in the tutorials, they were maintained in the data because they reveal a need. Also, these errors indicate that there should either be a separate tutorial about catalog searching, or the tutorials in this study should have included how to find books as well.
from the Library Service Center, or not completing the task. Figure 3 shows that thirteen participants deviated from the optimal path while completing Task 1. As stated earlier, one of the participants was unable to complete the task, resulting in an error. Twelve of the participants chose the wrong version of the book they instructed to find. All twelve of these participants were able to correctly request the book from the Library Service
Center, which is what the tutorial explained. However, since the book they chose was not the book they were prompted to search for, it resulted in an error. The participants would often click on the first book that appeared in the catalog and had the same name as the book they were instructed to find. Their ability to complete the act of requesting the book was recorded in Figure 1: Success Rate. Only one participant found the correct book, but incorrectly requested the book from the Library Service Center. When this participant found the correct book they clicked on “Research Support”, the drop down tab at the top of the page, instead of selecting the “Get This Title” button. This participant
was not alerted to the fact that they had committed an error and they were allowed to complete the task.
these participants were able to successfully recall the book that had been checked out, which is what the tutorial explained, but since they selected the wrong book, it was listed as an error. Their ability to recall the book is recorded in Figure 1: Success Rate.
For Task 3, “Creating a Document Delivery Account”, there was a 0% error rate during the completion of the task.
Figure 3 shows that three participants deviated from the optimal navigation path while completing Task 4, “Creating a RefWorks Account”. For Task 4 any deviation from the exact path laid out in the tutorial was considered an error. All three of the
participants who deviated from the optimal path were ultimately able to complete the task and create a RefWorks Account. Their ability to ultimately create a RefWorks account is recorded in Figure 1: Success Rate. Two of the participants chose the wrong drop down tab at the top of the page when they started their search for “Citation Tools”, and the third
User Subjective Satisfaction
In assessing the users’ subjective satisfaction with the library tutorials, their
responses to the Post-Task surveys, seen in Appendix G, were evaluated. Values were assigned to their responses as follows: 1 = strongly disagree, 2 = disagree, 3 = neither agree nor disagree, 4 = agree, and 5 = strongly agree. Subjects were asked to rate their level of agreement with each of the questions in the Post-Task survey after watching each library tutorial and performing the associated task. There were eight questions in the Post-Task Survey. The following charts were created from the participants’ Post-Task survey ratings. Those ratings were averaged and the 95% confidence interval was calculated.
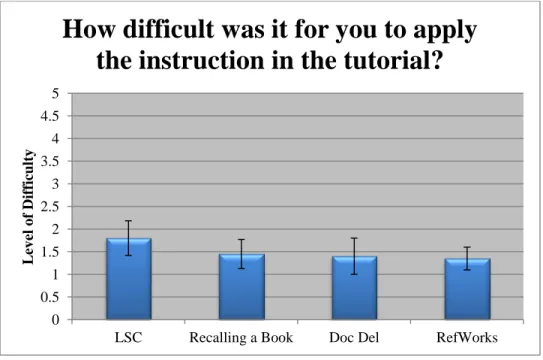
Figure 4: Difficulty of Tutorial Application 0 0.5 1 1.5 2 2.5 3 3.5 4 4.5 5
LSC Recalling a Book Doc Del RefWorks
L ev el o f Dif ficulty
Figure 4: Difficulty of Tutorial Application represents the first question “How difficult was it for you to apply the instructions in the tutorial?” and includes error bars that represent the 95% confidence interval. In all four tasks the mode was 1 meaning that the average participant strongly disagreed that it was difficult to apply the instructions in the tutorial.
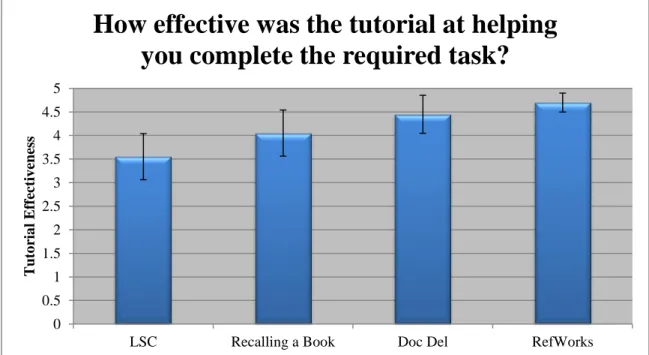
Figure 5: Tutorial Effectiveness
Figure 5: Tutorial Effectiveness represents the responses to the second question, “How effective was the tutorials at helping you complete the required task?” and includes
error bars representing the 95% confidence interval. For the first task, “Request a Book from the Library Service Center”, the mode was 4, meaning that the participants agreed that the tutorial was helpful at completing the task. For “Recalling a Book that has been Checked Out”, “Creating a Document Delivery Account”, and “Creating a RefWorks
0 0.5 1 1.5 2 2.5 3 3.5 4 4.5 5
LSC Recalling a Book Doc Del RefWorks
T uto ria l Eff ec tiv eness
Account”, the mode was 5, meaning that the average participant strongly agreed that the
tutorial was helpful at completing the task. The participants seemed to think that the tutorials for “Creating a Document Delivery Account”, Task 3, and “Creating a RefWorks Account”, Task 4, were more helpful. This could be because it took
participants less time to complete Task 3 and Task 4 and they associated that with tutorial effectiveness, or it could be related to the fact that Task 3 and Task 4 did not require participants to locate books, which was something that many participants struggled with in Task 1 and Task 2.
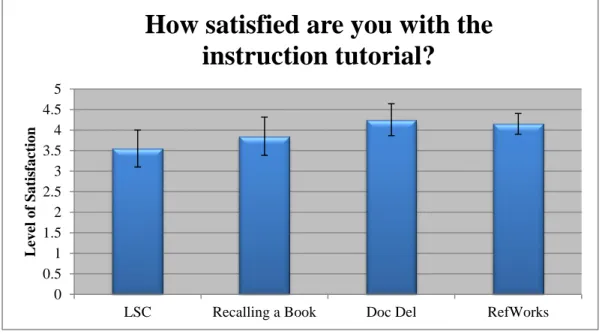
Figure 6: Level of Satisfaction
Figure 6: Level of Satisfaction represents the responses to the question, “How satisfied are you with the instructional tutorial?” and includes error bars representing the
95% confidence interval. “Requesting a Book from the LSC”, “Creating a Document 0 0.5 1 1.5 2 2.5 3 3.5 4 4.5 5
LSC Recalling a Book Doc Del RefWorks
L ev el o f Sa tis fa ct io n
Delivery Account”, and “Creating a RefWorks Account” all resulted in a mode of 4,
meaning that the average participant agreed that they were satisfied with the instructional tutorial. “Recalling a Book that has been Checked Out” resulted in a mode of 5, meaning
that average participant strongly agreed that they were satisfied with the instructional tutorial.
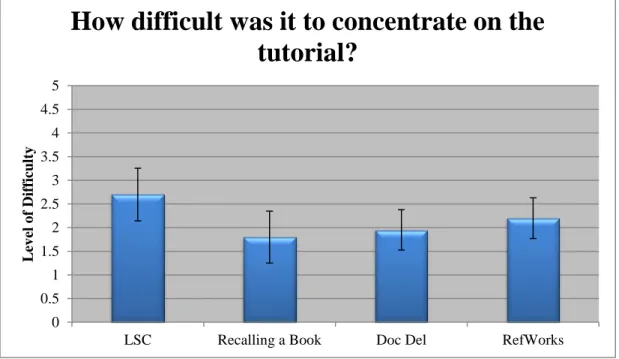
Figure 7: Level of Difficulty
Figure 7: Level of Difficulty represents the participant responses to the question, “How difficult was it to concentrate on the tutorial?” and includes error bars that
represent the 95% confidence interval. “Requesting a Book from the LSC” resulted in a mode of 4, meaning that the average participant agreed that it was difficult to concentrate on the tutorial. However, “Recalling a Book that has been Checked Out” and “Creating a Document Delivery Account” resulted in a mode of 1, meaning that the average
participant strongly disagreed that it was difficult to concentrate on the tutorial. While 0 0.5 1 1.5 2 2.5 3 3.5 4 4.5 5
LSC Recalling a Book Doc Del RefWorks
L ev el o f Dif ficulty
“Creating a RefWorks Account” resulted in a mode of 3, meaning that the average
participant neither agreed nor disagreed that it was difficult to concentrate on the tutorial. The fact that Task 1, “Requesting a Book from the Library Service Center”, took students
the longest amount of time to complete most likely contributed to the higher difficulty rating for that task.
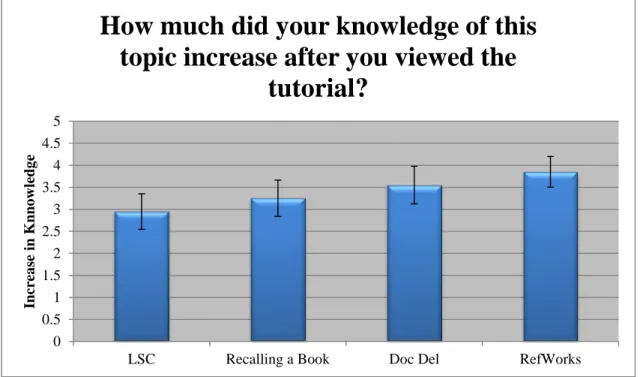
Figure 8: Increase in Knowledge
Figure 8: Increase in Knowledge represents the results from the question, “How much did your knowledge of the topic increase after you viewed the tutorial?” and
includes error bars representing the 95% confidence interval. All four tasks had a mode of 4. This means the average participant agreed that the tutorial increased their
knowledge of the corresponding topic a great deal.
Figure 8: Increase in Knowledge, also relates to Figure 5: Tutorial Effectiveness. For Figure 5 the average participant felt that Task 3, “Creating a Document Delivery
0 0.5 1 1.5 2 2.5 3 3.5 4 4.5 5
LSC Recalling a Book Doc Del RefWorks
Incre a se in K nn o w ledg e
How much did your knowledge of this
topic increase after you viewed the
Account”, and Task 4, “Creating a RefWorks Account”, were more effective than Task 1, “Requesting a Book from the Library Service Center”, and Task 2, “Recalling a Book that is Checked Out”. This data correlates to the Figure 8: Increase in Knowledge graph
where participants felt that the tutorials for Task 3 and Task 4 were more effective at increasing their knowledge of how to perform the task.
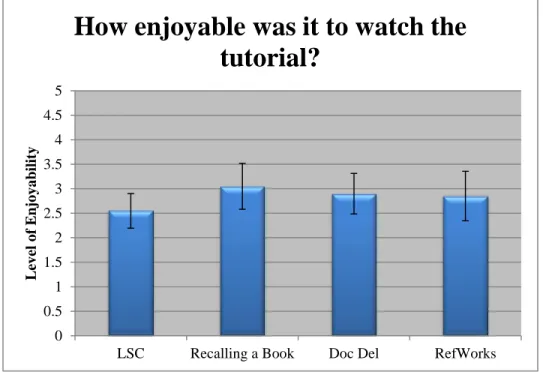
Figure 9: Level of Enjoyability
Figure 9: Level of Enjoyability displays the results from the question, “How enjoyable was it to watch the tutorial?” and includes error bars that represent the 95%
confidence interval. Task 1, “Requesting a Book from the LSC” resulted in a mode of 2. This means that the average participant disagreed that the tutorial was enjoyable to watch. Task 2 had a mode of 4. This means that the average participant agreed that the tutorial was enjoyable to watch. And Tasks 3 and 4 had a mode of 3, meaning that the average participant neither agreed nor disagreed that the tutorial was enjoyable to watch.
0 0.5 1 1.5 2 2.5 3 3.5 4 4.5 5
LSC Recalling a Book Doc Del RefWorks
L ev el o f E njo y a bil it y
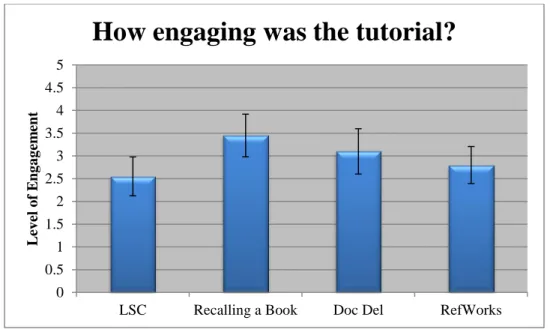
Figure 10: Level of Engagement
Figure 10: Level of Engagement represents the participants’ responses to the question, “How engaging was the tutorial?” and includes error bars that represent the
95% confidence interval. Tasks 1, “Requesting a Book from the LSC” and Task 3, “Creating a Document Delivery Account” resulted in a mode of 2, meaning that the
average participant disagreed that the tutorial was engaging. Task 2, “Recalling a book that has been Checked Out” had a mode of 4, meaning that the average participant agreed
that the tutorial was very engaging. While Task 4, “Creating a RefWorks Account”, resulted in a mode of 3, meaning that the average participant neither agreed nor disagreed that the tutorial was very engaging. The fact that “Requesting a Book from the Library Service Center” took students the longest to complete might have played a role in lowering the participant’s level of engagement for that task.
0 0.5 1 1.5 2 2.5 3 3.5 4 4.5 5
LSC Recalling a Book Doc Del RefWorks
L ev el o f E ng a g em ent
Figure 11: Level of Confidence
Figure 11: Level of confidence displays the participants’ responses to the question, “How confident are you that you performed the task correctly?” and includes
error bars that represent the 95% confidence interval. All five tasks results in a mode of 5, meaning that the average participant for every task strongly agreed that they performed the task correctly.
0 1 2 3 4 5 6
LSC Recalling a Book Doc Del RefWorks
L
ev
el
o
f
Co
nfidence
Mouse Clicks
Figure 12: Average Mouse Clicks Comparison
Figure 12: Average Mouse Clicks Comparison displays the participants’ average number of mouse clicks by task and divided by the type of tutorial the participant viewed. Figure 12 also includes the minimum number of clicks possible to complete each task and error bars that representing plus and minus one standard deviation. Task 1, “Requesting a Book from the Library Service Center”, required the most mouse clicks, an average of 6.68. Task 4, “Creating a RefWorks Account”, required the second most mouse clicks with an average of 4.53. The minimum number of mouse clicks possible for Task 4 was
0 2 4 6 8 10 12
LSC Recalling a
Book
Doc Del RefWorks
Av er a g e M o us e Click s
Average mouse clicks by task: Comparison
Videos
Slide Shows
Comparing the Results of Video Watchers vs. Slide Show
Watchers
One way to compare the results of this study is to compare the Average Time on Task, Success Rate, Error Rate, and Average Mouse Clicks for participants who viewed the videos versus participants who viewed the slideshows. The following charts were created from the recordings of participants’ completion of the tasks. Those ratings were
averaged and the standard deviation was calculated.
Figure 13: Time on Task Comparison
Figure 13: Time on Task Comparison displays the average Time on Task for participants who viewed the video tutorials and participants who viewed the slideshow
0 20 40 60 80 100 120 140
LSC Recalling a
Book
Doc Del RefWorks
T im e o n T a sk ( Seco nd s)
Average Time on Task: Comparison
with Std. Dev.
Videos
tutorials and it contains error bars that represent the standard deviation. Participants who viewed the slide show tutorials took longer to complete Task 1, “Requesting a Book from the LSC”, and Task 2, “Recalling a Book that is Checked Out”. But participants who
viewed the video tutorials took longer to complete Task 3, “Creating a Document Delivery Account” and Task 4, “Creating a RefWorks Account”.
Figure 14: Success Rate Comparison
Figures 14: Success Rate Comparison displays the comparison of participants’ ability to successfully complete each task. The results are divided by the type of tutorial each participant viewed before completing the task. The Success Rate is defined as whether users can perform the task explained in the tutorial. This is a binary response; participants either complete the task assigned, or they do not complete it.
0% 10% 20% 30% 40% 50% 60% 70% 80% 90% 100%
LSC Recalling a
Book
Doc Del RefWorks
A total of 11 participants viewed the video tutorials and 9 participants viewed the slide show tutorials. One of the participants who viewed the video tutorials failed at Task 2, Recalling a Book that has been Checked Out, and one of the participants who viewed the slide show tutorials failed at Task 1, Requesting a book from the LSC.
Ultimately, the type of tutorial that the patron viewed before completely a task does not seem to affect their success rate.
Figure 15: Error Rate Percentage Comparison
Figure 15: Error Rate Percentage Comparison displays the difference in the percentage of errors for participants who viewed the video tutorials and the slide show tutorials. The participants who viewed the video tutorials for Task 4, “Creating a
0 10 20 30 40 50 60 70 80 90 100
LSC Recalling a Book Doc Del RefWorks
Er
ro
rs
Error Rate Percentage: Comparison
Videos
RefWorks Account”, had a higher percentage of error on that task. The participants who
viewed the slideshow tutorials for Task 1, “Requesting a Book from the LSC”, and Task 2, “Recalling a Book that has been Checked Out”, had a higher percentage of error for those tasks. There was a 0% Error Rate for Task 3 for both the video and slide show tutorials.
It is important to note that there were two very distinct portions of the tasks for Task 1, “Requesting a Book from the Library Service Center”, and Task 2, “Recalling a Book that has been Checked Out”. For these two tasks students first had to find a book in
the library catalog and then secondly they had to request or recall this book. The tutorial that they had just seen described how to request or recall the book, but it did not describe how to find the book in the library catalog. As a result, 12 of the 13 recorded errors for Task 1, “Requesting a Book from the Library Service Center”, were associated with
selecting the wrong book in the catalog. The one participant who committed an error other than selecting the wrong book viewed the Slide Shows and was not able to
There is a noticeable difference in the percentage of errors for Task 2, “Recalling a Book that has Been Checked Out”. Participants who viewed the videos had a 27.27%
Error Rate, while the participants who viewed the Slide Shows had a 55.56% error rate. Further research is needed to determine why the discrepancy in Error Rate for Task 2 is so large.
Figure 16: Comparison of Average Mouse Clicks by Task
Figures 16: Comparison of Average Mouse Clicks by Task compares the average mouse clicks by task for participants who viewed the video tutorials and the slide show tutorials. Participants who viewed the video tutorial for Tasks 1”Requsting a Book from the LSC”, Task 2, “Recalling a Book that has been Checked Out”, and Task 3, “Creating a Document Delivery Account”, had a higher number of mouse clicks. However,
6.36 5.09 2.45 4.91 7.13 3.50 2.25 4.00 0 1 2 3 4 5 6 7 8
LSC Recalling a Book Doc Del RefWorks
Av er a g e M o us e Click s
Average Mouse Clicks by Task
Videos
Comments, Responses, and Observations
Tutorial Preference
Participant’s responses to the Exit Survey were analyzed to determine their
preference for either the Slide Show tutorials or Video tutorials. Participants were asked the following question: “Did you prefer the video tutorial or the slideshow tutorial? Please explain why.” The twenty participants were evenly split with 10 preferring video
tutorials and 10 preferring slideshow tutorials.
When referring to the video tutorials one participant stated, “It was more clear and easy to follow and the movement kept me focused. The slide show was harder to
concentrate on and there was more distraction”. This seemed to be the general consensus among the patrons who preferred the video tutorials. They claimed that the videos kept them focused because of the mouse movements and they liked being able to see exactly where to click on the screen. Another participant noted, “I preferred the video tutorials over the slide shows because it showed explicit mouse movements, and it made me pay more attention since I was not in control”.
For the students who preferred the slide show tutorials many noted that they liked being able to control the pace of the video and click backwards if they missed any
Another participant noted, “I preferred slide show because of the pacing. I could learn and go back as I pleased”.
Suggested Tutorial Improvements from Participant Comments
Five participants, two who preferred the video tutorials, and three who preferred the slideshow tutorials, wanted the video tutorials to include audio. All five of these participants stated that they had trouble reading the words and following the arrows all while the video was playing. Additionally, five separate participants, two who preferred the video tutorials and three who preferred the slideshow tutorials, suggested the video tutorials should be slowed down so that it is easier to both read the text bubble and follow the mouse movements. For this study the participants could not control the speed of the video. However, since the video was on YouTube They could playback the entire video or rewind it to a specific point. Many of participants had trouble finding the exact information they were searching for when they tried rewinding the video.
Pacing
All ten of the participants who preferred the slideshow tutorials and two of the participants who preferred the video tutorials said they found the ability to control the tutorial’s pace the main benefit of the slideshows. They enjoyed being able to learn at
Overall appeal/organization of content
When discussing the slideshow tutorials several of the participants mentioned that they felt the slides, as seen in Appendix I, felt cluttered and it was difficult to understand where to click. They also mentioned that the font did not draw them in and they felt that the mascot on the slide was distracting. Some users said that there was too much
information crammed into each slide. One participant even noted, “The slideshow does
not seem professional and it is really boring”. However, in comparison, when talking about the slideshow tutorial, a different participant stated, “It was very viewer friendly”. Overall participants seemed to find the slideshow tutorials visually unappealing and somewhat boring, but they enjoyed the ability to control the pace and to be in charge of how quickly they received information.
When discussing the video tutorials many participants noted that they felt rushed and it was hard to comprehend all of the information. One participant requested that in the future the tutorials, “break down the information into more digestible pieces” and another noted, “I felt like I wasn’t keeping up”. A few participants indicated that the
movement of the video kept them focused, but one participant said, “It was very boring and did not engage my attention”. In general, the participants once again found the
Usefulness of Content
Figure 17: Usefulness of Tutorials
In the Exit Questionnaire participants answered the following question about the usefulness of the tutorial content, “I felt better prepared to complete the associated task after watching this tutorial”. In the Exit Questionnaire 1=strongly agree, 2=agree,
3=neither agree nor disagree, 4=disagree, and 5=strongly disagree. Figure 17: Usefulness of Tutorials displays the average ratings for the video and slide show tutorials.When discussing the video tutorials nine participants selected strongly agree, nine selected agree, and two selected neither agree nor disagree. The mean number chosen was 1.65. When talking about the slideshow tutorials nine participants selected strongly agree, nine selected agree, one selected neither agree nor disagree, and one selected strongly
disagree. The mean number chosen was 1.75. Thus, the two types of tutorials had similar 0 1 2 3 4 5 6 7 8 9 10
Strongly Agree Agree Neither Agree
Nor Disagree Disagree Strongly Disagree Num ber o f Student s
Ratings for Usefulness of Tutorials
Video
usefulness ratings.
In the comments section for the video tutorials several participants noted that the moving mouse and the red arrows were helpful and easy to follow. Additionally for the slideshow tutorials several participants noted that the ability to click backwards and revisit a previous slide was particularly helpful when learning the new task. Overall, even though many of the participants did not find the tutorials very appealing or interesting, they did find the content very useful.
Finding Books in the catalog
There were two tasks that required that participants find specific books in the library catalog. These tasks were “Requesting a Book from the Library Service Center” (Task 1) and “Recalling a Book that has been Checked Out” (Task 2). For Task 1 twelve of the thirteen participants who committed an error requested the wrong book. For Task 2 seven out of the eight participants who committed an error during their search recalled the wrong book. Additionally in the Exit Questionnaire two of the participants
Self- Confidence and Error Rate
One interesting thing to note is the participant’s high self-confidence ratings
related to the task completion as compared to the error rates associated with those tasks. As seen in the Users’ Subjective Satisfaction section the average participant strongly agreed that they performed the task correctly for all four tasks. This can be compared to the Error Rate. For Task 1, “Requesting a Book from the LSC”, thirteen participants committed an error, for Task 2, “Recalling a Book that has been Checked Out”, eight participants committed an error, and for Task 4, “Creating a RefWorks Account”, three participants committed an error. The error rate for Task 3 was zero. There appears to be a discrepancy between how well the participants believe they performed and their actual performance.
It should be noted for Task 1, “Requesting a Book from the Library Service Center”, 12 out of 13 of the errors were due to the participants’ inability to find the correct book. Also, 7 out of 8 of the errors for Task 2, “Recalling a Book that has been Checked Out” were due to the participants’ inability to find the correct book. They would
Exit Questionnaire
Figure 18: Exit Questionnaire User Satisfaction Comparison Part 1
In assessing the users’ subjective satisfaction with the library tutorials, their
responses to the Exit Questionnaire, seen in Appendix H, were evaluated. Values were assigned to their responses as follows: 1 = strongly disagree, 2 = disagree, 3 = neither agree nor disagree, 4 = agree, and 5 = strongly agree. Subjects were asked to rate their level of agreement with each of the questions in the Exit Questionnaire at the end of study. There were five questions in the first part of the User Satisfaction section of the Exit Questionnaire. Figure 18: Exit Questionnaire User Satisfaction Comparison Part 1 display participants’ Post-Task survey ratings. Those ratings were averaged and the 95%
confidence interval was calculated. Figure 18 reveals that participants had similar 0 0.5 1 1.5 2 2.5 3 3.5 4 4.5 5 5.5 6 Tutorials were easy to use
I would have organized the
tutorials differently
The length was appropriate
The terminology was clear and
precise
I felt better prepared to perform the task after watching the
tutorial
Exit Questionnaire: User Satisfaction
Comparison Part 1
Videos
feelings about the video and slide show tutorials for all five questions.
Figure 19: Exit Questionnaire User Satisfaction Comparison Part 2
Figure 19 displays the participants’ responses to the comparison questions for the video and slide show tutorials in the Exit Questionnaire, as seen in Appendix H. For Figure 19 values one through five were assigned to responses. Lower numbers were associated with more favorable responses for this question. For example, using the first question from Figure 19, simple = 1, somewhat simple = 2, neither simple nor complex = 3, somewhat complex = 4, and complex = 5. Therefore, lower average numbers for each question indicate a more favorable response from the tutorials.
Figure 19 reveals that participants generally felt the same about both the video and slide show tutorials. It is interesting to note that the average participant felt that video
0 0.5 1 1.5 2 2.5 3 3.5 4 4.5 5
Exit Questionnaire: Average User
Satisfaction Comparison Part 2
Videos
Discussion
Users had the most trouble with Task 1, “Requesting a Book from the Library Service Center”: one user failed to complete the task; this task had the most errors (7); users spent the most time on this task (71.98 seconds); this task required the most mouse click (6.68); and this task tied with Task 2, “Recalling a Book that has been Checked Out” for users’ lowest confidence that they performed the task correctly.
Task 2, “Recalling a Book that has been Checked Out”, also resulted in one failure to complete the task. It required the second longest time (40.34 seconds), and it elicited the second highest number of errors (7). This task ranked third in average number of mouse clicks (4.42).
Task 1 and Task 2 most likely consistently caused participants more trouble because they required the participant to locate a book the catalog before
completing the task described in the tutorial. To solve this problem participants should have either been shown a tutorial about catalog searching prior to the tutorials used in this study, or the tutorials in this study should have included a segment about catalog
searching.
users’ confidence that the performed the task correctly. Task 3 was probably the easier
for participants to complete because there was no catalog searching involved and the task followed the tutorial instructions exactly.
Even though Task 4, “Creating a RefWorks Account”, required the second highest number of average mouse clicks at 4.53, this task required the second shortest average time at 20.09 seconds, and it resulted in a 0% failure rate. This task also had the second lowest number of errors with only 3 participants deviating from the optimal navigation path and participants gave this task the highest rating in regards to their confidence that they performed the task correctly.
Task 3 and Task 4 were probably the easier for participants to complete because there was no catalog searching involved and the tasks followed the tutorial instructions exactly. The participants’ ability to follow the instructions in the tutorials proves that tutorials can be effective. However, the participants’ inability to search the catalog and
Recommendations
Given the difficulty that participants had navigating the library catalog to find a
specified book, and the fact that two participants specifically asked for more training on how to search for books, it is recommended that a tutorial be developed that explains how to search for books by their title, author, and call number.
In the light that five participants noted that they felt they would better understand
the tutorial instructions if there was a voice-over for the video tutorials, it is recommended that all future video tutorials include optional audio as well. As some users had difficulty keeping pace with the current video tutorials, it is
recommended that future video tutorials be slowed down or allow for adjustable speed.
Provide easy-to-use controls that allow the patron to rewind or replay the video.
To cut down on the amount of distracting text in the background of the slideshow
tutorials, it is recommended that all content that is not relevant to the current slide be blurred out of the picture to avoid distraction and confusion.
Since the number of participants preferring video tutorials and slideshow tutorials
Conclusion
The usability study of slideshow and video tutorials has revealed several design issues that should be addressed to ensure the maximum number of patrons view and learn basic library tasks from these tutorials. Analysis of this data will hopefully lead academic libraries to: 1) make it a priority to provide online library tutorials for patrons; 2)
References
Appelt, K. M., & Pendell, K. (2010). Assess and invest: Faculty feedback on library tutorials. College & Research Libraries, 71(3), 245-253.
Alexander, K. P. (2013). The usability of print and online video instructions. Technical Communication Quarterly, 22(3), 237-259.
Battleson, B., Booth, A., & Weintrop, J. (2001). Usability testing of an academic library web site: A case study. The Journal of Academic Librarianship, 27(3), 188-198. Blevins, A., & Elton, C. W. (2009). An evaluation of three tutorial-creating software
programs: Camtasia, PowerPoint, and MediaSite. Journal of Electronic Resources in Medical Libraries, 6(1), 1-7.
Bowles-Terry, M., Hensley, M. K., & Hinchliffe, L. J. (2010). Best practices for online video tutorials in academic libraries: A study of student preferences and
understanding. Communications in Information Literacy, 4(1), 17-28.
Bury, S., & Oud, J. (2005). Usability testing of an online information literacy tutorial.
Reference Services Review, 33(1), 54-65.
Charnigo, L. (2009). Lights! camera! action! producing library instruction video tutorials using camtasia studio. Journal of Library & Information Services in Distance Learning, 3(1), 23-30.
Craig, C. L., & Friehs, C. G. (2013). Video and HTML: Testing online tutorial formats with biology students. Journal of Web Librarianship, 7(3), 292.
Crowther, M. S., Keller, C. C., & Waddoups, G. L. (2004). Improving the quality and effectiveness of computer-mediated instruction through usability evaluations.
British Journal of Education Technology, 35 (3), 289-303.
Dewald, N. H. (1999). Web-based library instruction: What is good pedagogy?
Information Technology & Libraries, 18(1), 26-31.
Head, A.J. (2007). Beyond Google: How do students conduct academic research? First Monday, 12(8), n.
Kalyuga, S., Chandler, P., & Sweller, J. (1999). Managing split-attention and redundancy in multimedia instruction. Applied Cognitive Psychology, 13(4), 351-371.
Lindsay, E. B., Cummings, L., & Johnson, C. M. (2006). If you build it, will they learn? Assessing online information literacy tutorials. College & Research Libraries, 67(5), 429-445.
Mestre, L. S. (2012). Student preference for tutorial design: A usability study. Reference Services Review, 40(2), 258-276.
Mousavi, S. Y., Low, R., & Sweller, J. (1995). Reducing cognitive load by mixing auditory and visual presentation modes. Journal of Educational Psychology, 87(2), 319-334.
Nielson, J. (2001). Usability Metrics (Jacob Nielsen’s Alertbox). Alertbox. Retrieved October 28, 2013, from http://www.useit.com/alertbox/20010121.html.
Paechter, M., & Maier, B. (2010). Online or face-to-face? students' experiences and preferences in e-learning. The Internet and Higher Education, 13(4), 292-297. Silver, S. L., & Nickel, L. T. (2005). Are online tutorials effective? A comparison of
online and classroom library instruction methods. Research Strategies, 20(4), 389-396.
Slebodnik, M., & Riehle, C. (2009). Creating online tutorials at your libraries software choices and practical implications. Reference & User Services Quarterly, 49(1), 33-33.
Sobel, K., & Sugimoto, C. R. (2012). Assessment of learning during library instruction: Practices, prevalence, and preparation. Journal of Academic Librarianship, 38(4), 191-204.
Stiwinter, K., (2013). Using an interactive online tutorial to expand library instruction.
Internet Reference Services Quarterly, 18(1), 15-41.
Stroscio, C. M. (2012) The state of academic library websites: A usability study. University of North Carolina at Chapel Hill
Tempelman-Kluit, N. (2006). Multimedia learning theories and online instruction.
College & Research Libraries, 67(4), 364-369.
Appendix A
Recruiting Script
Hello, my name is Emily Corbin. I’m a graduate student at UNC. I’m conducting a research study to fulfill a requirement for my Master’s degree in Library Science and I
Appendix B
Email or Listserv Recruitment
Hello, my name is Emily Corbin, and I’m a graduate student at the University of North Carolina at Chapel Hill. I’m doing research to fulfill a requirement for my Master’s
degree in Library Science and I am evaluating different types of online library tutorials.
I am recruiting people to participate in this research study. If you participate, it would take approximately twenty minutes of your time. You would need to schedule a time that is convenient for you to come to the lab in the Garden Level of Manning Hall to complete the study. As part of the study, you would be asked to view four tutorials about library services and perform four tasks on the library website. We are offering a $10 gift certificate to Amazon as compensation for your time.
If you are interested in this study please email me at [email protected].
Thank you!
Appendix C
Observation Script
Hi, my name is Emily Corbin and I’m a Master’s student at UNC Chapel Hill. This study is part of my Master’s research. I am conducting this study under the supervision of my faculty advisor in the Information and Library Science Department, Dr. Rob Capra. I’m going to be reading from my script to ensure that we uniformly administer this research study for all subjects.
Thanks for agreeing to take part. During this session you will be asked to
complete tasks and fill out questionnaires about online library tutorials. There are no right or wrong answers. Please feel free to stop me at any time for a question or concern.
We are using software called Camtasia to record this session. All notes, screen capture, and screen recordings are for me to review the session so that I don’t have to write everything down and will not be release to the general public; however, I will be including my general findings regarding whether students preferred video or slide show tutorials in my Master’s Paper. Your personal information will in no way be associated with the results of this study.
In this study you will be given four tutorials to view. Two will be video tutorials and two will be slide show tutorials. You will be asked to complete a corresponding task after each tutorial. We will record the screen while you complete the task. After
completing each task, you will be asked to fill out a post-task questionnaire. At the end of the study you will be asked to fill out an exit questionnaire.
Before we start the test, there’s some paperwork I’m going to ask you to fill out [Hands subject 2 copies of consent form]. This is a consent form stating that the information will be kept confidential and that your name will not be associated with the recording. We have 2 copies of the form here – one for you to keep and one for our records. I’ll give you some time to read and sign it. If you have any questions, please let me know.
[Take signed copy of consent form and leave unsigned copy for participant]
Now that we’ve gotten the paperwork out of the way, do you have any questions before we start? [Pauses for questions]
Okay, so now we will begin the study.
To start, Please watch this first online tutorial. [Begins first tutorial]
[Provides corresponding Task Completion Script]
Please complete this online questionnaire about the tutorial you just watched. [Pulls up online Qualtrics Post-task Survey]
[Repeat tutorial viewing, task completion, and online survey for all 5 tutorials] Now that you have completed all of the tutorials, I would like you to complete one final survey.
[Pulls up online Qualtrics Exit Questionnaire]
This study is now complete. Thank you for taking part. Do you have any final questions before you leave?
Appendix D
Observation Guide
This study will be implemented by one investigator who will serve as a moderator and who will take notes and observe.
The investigator will:
Ensure the comfort and safety of study subjects
Use the interview script to:
o Explain the task
o Guide subjects
Refrain from prompting or interrupting the participant unless it becomes clear that he subject does not understand the task, in which case the moderator will read the task again to clarify.
Focus on observation and listening
Write down any insights or comments provided by subjects
I will be measuring:
o Success Rate: Whether users can perform the task at all
o Time on task: The length of time users spend completing a task
o Error Rate: Will be measured as deviations from the optimal
navigation path.
o User Subjective Satisfaction: This will be measured by the
Post-Task Questionnaire questions.
o Mouse Clicks: The number of times the participants clicked the
Appendix E
Consent Document
University of North Carolina at Chapel Hill
Project Title: Academic Library Instruction Tutorials: A Usability Study Principal Investigator: Emily Corbin
Principal Investigator Department: School of Info & Library Science Principal Investigator Phone Number: 706-830-4658
Principal Investigator Email Address: [email protected] Faculty Advisor: Rob Capra
Faculty Advisor Contact Information: [email protected] 919-962-9978 Funding Source: School of Information and Library Science 919-962-8366 What are some general things you should know about research studies?
You are being asked to take part in a research study. To join the study is
voluntary. You may refuse to join, or you may withdraw your consent to be in the study, for any reason, without penalty.
Research studies are designed to obtain new knowledge. This new information may help people in the future. You may not receive any direct benefit from being in this research study. There also may be risks to being research studies.
Details about this study are discussed below. It is important that you understand this information so that you can make an informed choice about being in this research study.
You will be given a copy of this consent form. You should ask the researches named above any questions you have bout this study at any time.
What is the purpose of this study?
The purpose of this research study is to assess the functionality, ease of use, and student preference of the Duke University online library tutorials.
Are there any reasons you should not be in this study? You should not be in this study if you are under the age of 18. How many people will take part in this study?
A total of approximately 20 people will take part in this study. How long will your part in this study last?
This study will take approximately twenty minutes of your time. What will happen if you take part in this study?
You will be asked to view four library tutorials.
You will be asked to complete a task on the Duke Library website after watching each tutorial.
Your movements on the computer screen will be recorded.
After completion of each task you will be asked to fill out a post-task questionnaire.
After completing all of the tasks, you will be asked to fill out an exit questionnaire.
You are not required to answer any of the questions or complete any of the tasks. What are the benefits from being in this study?
Participants will not benefit from this study. However, research is designed to benefit society by gaining new knowledge.
What are the possible risks or discomforts involved from being in this study? The only foreseeable risk for this study is the risk of embarrassment if you do not know how to complete a task. This risk will be minimized by privately testing one person at a time. However, there may be uncommon or previously unknown risks. You should report any problems to the researcher. Please use the email address or phone number provided on the first page of this form if problems arise after you have completed participation.
How will your privacy be protected?
During the study, you will be identified by a separate study ID number that will be incorporated into the name of the file that contains your data. Your name will be stored separately from your study and will be used solely for funding purposes only. At no time will your unique name be associated with your study ID.
Participants will not be identified in any report or publication about this study. Although every effort will be made to keep research records private, there may be times when federal or state law requires the disclosure of such records, including personal information. This is very unlikely, but if disclosure is ever required, UNC-Chapel Hill will take steps allowable by law to protect the privacy of personal information. In some cases, your information in this research study could be reviewed by representatives of the University, research sponsors, or government agencies (for example, the FDA) for
purposes such as quality control or safety.
The recordings, the random study ID number associated with your file, and your Qualtrics survey results collected in this study will be deleted once the study has been completed and the results have been recorded.
What if you want to stop before your part in the study is complete?
You can withdraw from the study at any time, without penalty. The investigators also have the right to stop your participation at any time. This could be because you have had an unexpected reaction, or have failed to follow instructions, or because the entire study has been stopped.
Will you receive anything for being in this study?
You will receive a $10 gift certificate to Amazon for completing this study. Will it cost you anything to be in this study?
It will not cost you anything to be in this study. What if you have questions about this study?
You have the right to ask, and have answered, any questions you may have about this research. If you have questions about the study, complaints, or concerns, you should contact the researchers listed on the first page of this form.
What if you have questions about your rights as a research participant? All research on human volunteers is reviewed by a committee that works to protect your rights and welfare. If you have questions or concerns about your rights as a research subject, or if you would like to obtain information or offer input, you may contact the UNC-CH Institutional Review Board at 919-966-3113 or by email to [email protected].