Optimization of control parameters of droplet density in citrus trees using
UAVs and the Taguchi method
Chaojun Hou
1,
Yu Tang
1*,
Shaoming Luo
1,
Jintian Lin
1,
Yong He
2,
Jiajun Zhuang
1,
Weifeng Huang
1(1. College of Automation, Zhongkai University of Agriculture and Engineering, Guangzhou 510225, China; 2. College of Biosystems Engineering and Food Science, Zhejiang University, Hangzhou 310058, China)
Abstract: The control parameters of the unmanned aerial vehicle (UAV) should be carefully designed to improve UAV spraying performance on citrus trees. The present study investigated the optimal droplet distribution control parameters in citrus trees using a UAV and the Taguchi method, of which optimal results were observed with an inverted triangle citrus tree canopy shape, a spraying height of 1.40 m, and a flight speed of 1.0 m/s. Among the discussed control parameters, the flight speed presented the most significant effect with a contribution percentage of 74.0%. The established multiple regression model predicted an optimal spraying height of 1.27 m and a maximum droplet density of 35.39 droplets/cm2. In addition, the effects of individual control parameter on the droplet density of the lower layer of citrus trees were systematically analyzed, of which inverted triangle shape more significantly affected the droplet density of the lower layer and presented an 82.0% increase in droplet density as compared to the triangle shape. An improvement of 59.6% in the lower layer droplet density was observed at a spraying height of 1.40 m. In addition, the other spraying heights did not present significant differences in their coefficient of variation (CV) values.
Keywords: droplet density, citrus, Taguchi method, aerial spraying, unmanned aerial vehicle (UAV), plant protection
DOI: 10.25165/j.ijabe.20191204.4139
Citation: Hou C J, Tang Y, Luo S M, Lin J T, He Y, Zhuang J J, et al. Optimization of control parameters of droplet density in citrus trees using UAVs and the Taguchi method. Int J Agric & Biol Eng, 2019; 12(4): 1–9.
1 Introduction
Citrus trees are susceptible to a wide variety of pests, such as leaf miner, citrus thrips, citrus bud mite, aphids, and citrus red mite. In general, crop production methods require the manual or mechanical spraying of insecticides to inhibit or control insects and diseases to reduce or eliminate yield losses and maintain high product quality[1]. Citrus is widely planted on the hillside orchards of South China. However, the undulating terrace fields, irregular spacing, scatter and fragmented land holdings of its traditional orchard locations limit the use of traditional spraying machinery[2]. The recent increased use of unmanned aerial vehicles (UAVs) have enhanced plant protection during cultivation due to their spraying speed and effectiveness[3,4]. Moreover, UAVs can interact in very small or hard to reach spaces because of their ability to start and land absolutely vertically[5].
Many systematic studies of UAV spraying technology have investigated the prevention and curing of diseases and insect pests
Received date: 2018-01-21 Accepted date: 2018-12-13
Biographies: Chaojun Hou, PhD, Associate Professor, research interests: agriculture engineering, Email: [email protected]; Shaoming Luo, PhD, Professor, research interests: intelligent agriculture equipment, Email: [email protected]; Jintian Lin, PhD, Professor, research interests: insect ecology, Email: [email protected]; Yong He, PhD, Professor, research interests: precision agriculture ,Email:[email protected]; Jiajun Zhuang, PhD, Lecturer, research interests: agriculture information technology, Email: jiajunzhuang@ 126.com; Weifeng Huang, PhD, Associate Professor, research interests: mechanical engineering, Email: [email protected].
*Corresponding author: Yu Tang, PhD, Professor, research interests: agricultural aviation application. College of Automation, Zhongkai University of Agriculture and Engineering, Guangzhou 510225, China. Tel: +86-20- 89003790, Email: [email protected].
parameters, specifically the tree shape, spraying height, and flight speed, to characterize its effect on the droplet density of the lower layers of citrus trees to achieve the optimal spraying performance.
Nevertheless, performing high runs of spraying experiments to determine the optimal setting with multiple control parameters is time consuming and labour intensive, especially when the total combination of multiple levels of the control parameters is fairly large[17]. To address this problem, based on the optimum process of the Taguchi method, the present study applied a near-orthogonal array as a settlement between the orthogonality and run size as well as to produce small, yet effective experimental runs. Signal-to-noise ratio analyses, analysis of variance (ANOVA), and stepwise regression analyses were then performed to determine the optimal parameter settings and individual parameter effects on the droplet density. Furthermore, we evaluated the effectiveness of the control factors on droplet deposition in the lower layer of citrus trees using comparable experiments.
2 Materials and methods
2.1 Materials
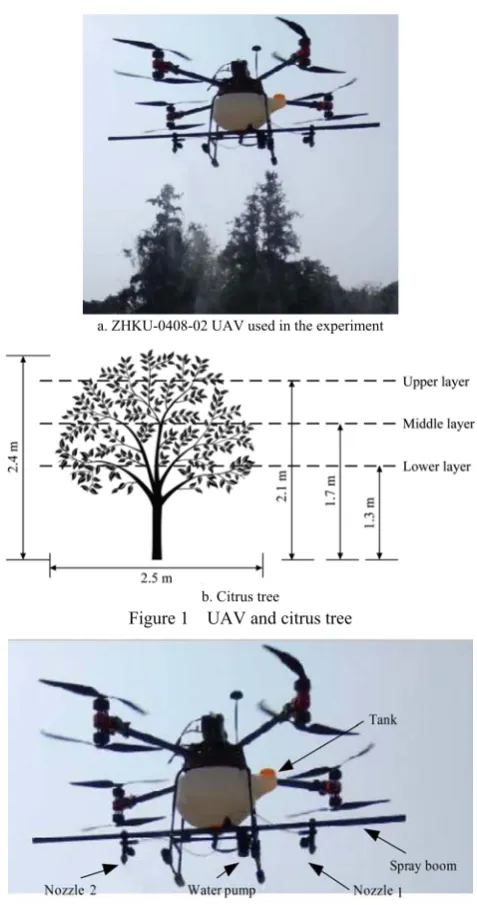
The battery plant-protection UAV ZHKU-0408-02 designed by Zhongkai University of Agriculture and Engineering was used in this experiments as shown in Figure 1a, and the primary specificationare given in Table 1.
Table 1 Primary specification for the ZHKU-0408-02 UAV
Items Parameters
Rotor Eight rotors
Tank capacity/L 15
Flight speed/m·s-1 1-5
Nozzle type Flat fan, Lechler ST110-01
Nozzle numbers 2-4
Nozzle spacing/m 0.8-1.8
Spraying pressure/MPa 0.1-1.0
Full load weight /kg 32
The presented experimental setup was performed over a Conghua Hualong Co. Ltd. hillside orchard (23°30'20"N, 113°33'34"E) in Guangzhou City, Guangdong Province, China. Mandarins (Citrus reticulata Blanco 'Shantanju') used in this experiment were grafted onto the rootstock of Citrus nobilis Lour. The citrus trees were cultivated in row 4.5 m apart at plant spacing of 3.5 m. As presented in Figure 1b, the citrus tree was approximately 2.4 m in height and 2.5 m in average diameter. To reduce experimental errors, eighteen healthy trees were selected with similar growth along the UAV flight path, of which nine trees were artificially pruned into inverted triangle and the remaining nine into triangle shapes.
The spraying system consists of a pesticide tank, an electronic speed control, a water pump, and two nozzles, as illustrated in Figure 2. The capacity of pesticide tank is set to 10 L. The two nozzles of the flat fan type ST110-01 are distributed at equal distances with a spacing of 1.2 m along the spray boom. The water pump is a type of diaphragm pump (JMRRC BPP-25), which operates at the pressure range between 0.1-1 MPa. The flow rate per nozzle is set to 0.35 L/min.
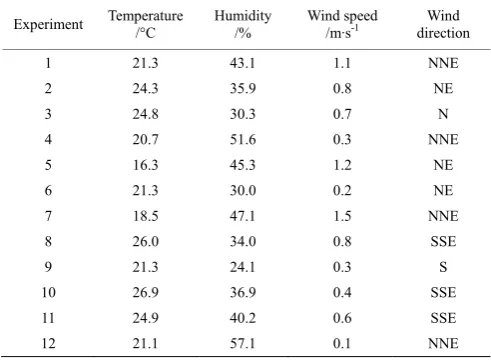
The surrounding environment were monitored by a digital humidity and temperature meter (Anymetre TH603A), and a portable anemometer (Peakmeter MS6252A). The temperature, humidity, wind speed and wind direction of the circumstance were monitored and recorded at every 2 minutes during the experiments.
a. ZHKU-0408-02 UAV used in the experiment
b. Citrus tree
Figure 1 UAV and citrus tree
Figure 2 Spraying system structure diagram
2.2 Experimental design
The spraying experiment involved 12 treatments to characterize the droplet deposition and uniformity of droplet distribution, which influence the pesticide efficacy. Water-sensitive paper (WSP) is a useful tool to collect the droplet samples for measuring the droplet deposition[11]. The WSPs were cut into 35 mm×55 mm rectangles and stapled onto selected leaves. Sprayed droplets produced blue deposits on the WSP. To obtain the precise evaluation of droplet deposition, the leaves were chosen from the upper, middle, and lower layer of the citrus trees as shown in Figure 3a and Figure 3b. Specifically, the nine WSPs were stapled onto the leaves in a matrix with 3 rows and 3 columns at each layer as shown in Figure 3c. The spacing between the adjacent WSPs is approximately 0.6-0.7 m. Care was taken in placing and removing the staples so that the same leaf could be used throughout the entire test. After each spraying experiment, the WSPs were cautiously collected with clean gloves and put into zip lock plastic bags. The gathered WSPs were analyzed to establish the droplet density.
spraying height, and flight speed. Notably, the spraying height is the distance of the UAV flying above the top of the canopy. The
experiments for droplet deposition during the spraying process were planned and performed according to the Taguchi design.
a. Triangle shape b. Inverted triangle shape c. Nine WSPs on a layer Figure 3 Different citrus tree shapes and WSP sampling for a canopy layer
2.3 Taguchi methodology
Table 2 presents control parameters or factors and their respective levels. In general, uncontrollable noise factors, also known as low significance disturbances, such as the temperature, humidity, and solar radiation, are difficult to control. The full factorial experiment design was fulfilled after nearly 18 spraying experimental runs, i.e., the total combination of multiple parameters levels.
Table 2 Control parameters and their levels
Parameters Symbol Level 1 Level 2 Level 3 Tree shape A Triangle Inverted triangle
Spraying height/m B 0.7 1.4 2.1
Flight speed/m·s-1 C 1.0 2.0 3.0
The Taguchi method, which was pioneered by Dr. Genichi Taguchi, is the central dogma for improving engineering productivity as it is more economical and requires fewer experimental runs [17]. The Taguchi method applies two powerful tools: (i) orthogonal arrays for the experimental design and (ii) the signal-to-noise ratio to measure the quality[18].
The orthogonal array (OA) design allows the selection of a subset of combinations of multiple factors at multiple levels to produce a design with equally balanced levels for all of the factors[19]. However, the factors included in our experiments have two three-level factors and one two-level factor; therefore, the smallest suggested OA is an L18 array[20]. Conducting 18 experimental runs, which is still a high number and the same as the full factorial design, is time consuming and labour intensive. A near-OAs produces a compromise between the orthogonality and run size,[21] and offers an effective strategy to limit the run size by sacrificing the orthogonality of some columns pairs. A near-OA
L′12(2334) or L′12(2135) with 12 experimental runs can be selected (http://designcomputing.net/gendex/noa/). The assignment of control parameters (A to C) to columns is shown in Table 3, where the levels are represented by “1”, “2” and “3” according to Table 2.
The near-OA experimental results were then calculated into
S/N ratios instead of using the averages to assess the performance characteristics to desensitize the process performance from variations in the uncontrollable noise factors[22,23]. Larger S/N ratios indicate a more robust control parameter against noise[24]. The present evaluation applied a “larger-the-better” type of S/N
ratio to obtain the desired maximum droplet density:
2
1 1
10log
i
S N
n X
⎛ ⎞
= − ⎜ ⎟
⎝
∑
⎠ (1)where Xi is the observed value of the trial condition after n repetitions, and the negative sign in Equation (1) signifies the
“larger-the-better” quality characteristic. Optimal process parameter levels with the greatest S/N ratios present the highest performance[23].
Table 3 Near-OA L′12(2135) for the two three-level factors and
one two-level factor
Experiment No. A B C
1 1 1 2
2 1 1 3
3 1 2 1
4 1 2 3
5 1 3 1
6 1 3 2
7 2 1 1
8 2 1 3
9 2 2 1
10 2 2 2
11 2 3 2
12 2 3 3
2.4 Data processing
The experiments were conducted during February 2017 in the same sequence described in Table 3 under a low wind environment. Table 4 lists the meteorological measurement data of each experiment. The Taguchi method reduces the number of experimental runs to an affordable set as compared to the full factorial design. The present study was fulfilled after 12 days of experiments using a near-OA, as defined in Table 3.
Table 4 Meteorological data for 12 experiments
Experiment Temperature/°C Humidity /% Wind speed /m·s-1 direction Wind
1 21.3 43.1 1.1 NNE
2 24.3 35.9 0.8 NE
3 24.8 30.3 0.7 N
4 20.7 51.6 0.3 NNE
5 16.3 45.3 1.2 NE
6 21.3 30.0 0.2 NE
7 18.5 47.1 1.5 NNE
8 26.0 34.0 0.8 SSE
9 21.3 24.1 0.3 S
was stapled on a leaf of the upper layer at the 14-th citrus tree. Figure 4b showed the grayscale image scanned from the two WSPs of the lower layer at the 12-th citrus tree. The WSP deposit distribution were examined with the US Department of Agriculture’s (USDA's) DepositScan software for the droplet parameters to determine the droplet density based on the number of droplets deposited onto the WSP per unit area.
a. A WSP was stapled onto a citrus leaf
b. Two WSPs were scanned into a grayscale image Figure 4 The WSPs were deposited with droplets The droplet density at the i-th tree is the average of the droplet density from the 27 pieces of WSPs from three layers,
3 9
, ,
1 1
1 27
i i j k k j
X X
= =
=
∑∑
(2)where, Xi,j,1, Xi,j,2, and Xi,j,3 define the droplet density values observed from the j-th WSP of the lower, middle, and upper layers of the i-th tree, respectively. The coefficient of variation (CV) was applied to interpret the uniformity of droplet distribution:
100%
SD CV
X
= × (3)
i
X X
n
=
∑
,(
)
2
1
i
X X SD
n
− =
−
∑
(4)
where, X is the average value of Xi; n is the number of observations per trial condition; and SD is the standard deviation of
Xi. Notably, smaller CV values suggest more uniform droplet distributions.
The deposit data were analyzed via Minitab V17 software developed by Minitab Inc. to process the Taguchi treatments, the main effect and the interaction plot and perform the ANOVA. Data pre-processing and a stepwise regression analysis were
processed using MATLAB R2013a software developed by MathWorks Inc.
2.5 Analysis of variance (ANOVA)
The ANOVA method was employed to characterize the factors that significantly impacted the spraying performance based on the
F value at the 95% confidence level, which helps determine the significant factors that affect the droplet deposition. Variations in control factors with significant effects on the performance have larger F values[25].
A percentage of every control factor was characterized to measure its effect on the droplet density, which is obtained by the sum of squares (SS) terms, dividing each individual SS by the total
SS and multiplying by 100. The results are calculated as follows[24,26]:
(%) A 100%
A
T
SS P
SS
= × (5)
where, SST is the total SS:
2
12 9
2 ,
1 1
T i k k i
Y SS Y
N
= =
=
∑∑
− (6)where, Yi,k is the droplet density, which is measured from the i-th tree under the k-th trial condition; N is the number of all the observations; and SSA denoted the SS of factor A, which is defined as follows:
2 2
1
A
i m
i A
i A
A Y SS
n N
=
⎛ ⎞
=⎜⎜ ⎟⎟−
⎝
∑
⎠ (7)where, mA is the number of levels of factor A; Aiis the sum of all the observed droplet densities at i-th level of factor A; nAi is the
total number of observations at i-th level of factor A; and Y is the sum of all observations.
3 Results and discussion
3.1 Optimization of control parameters for droplet density
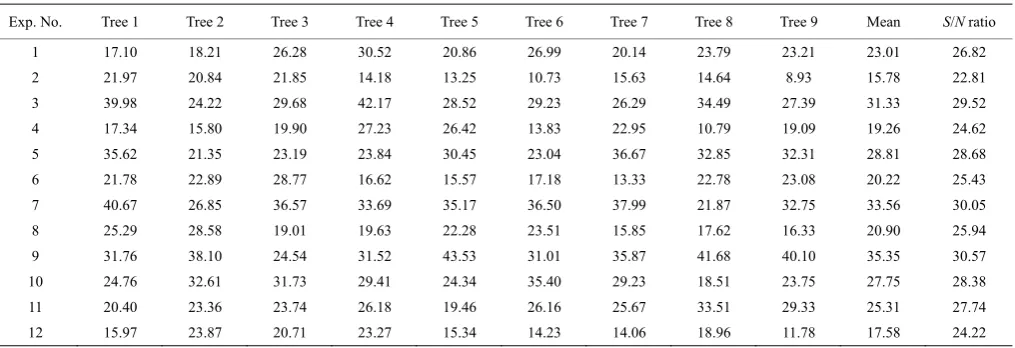
The present experiment aimed to determine the optimal control parameters settings to maximize the droplet density using the Taguchi method. The experimental data for the droplet density, mean level of the nine trees, and the S/N ratios are presented in Table 5, all of which are based on the near-OA in Table 3. The droplet density of each tree is defined as the average of 81 WSP pieces for all three layers of a citrus tree. The highest average droplet density of 35.35 droplets/cm2 was measured for experiment No.9, whereas the lowest value of 15.78 droplets/cm2 was in experiment No. 2.
Table 5 Experimental data for droplet density (droplets·cm-2) and
S/N ratio (dB)
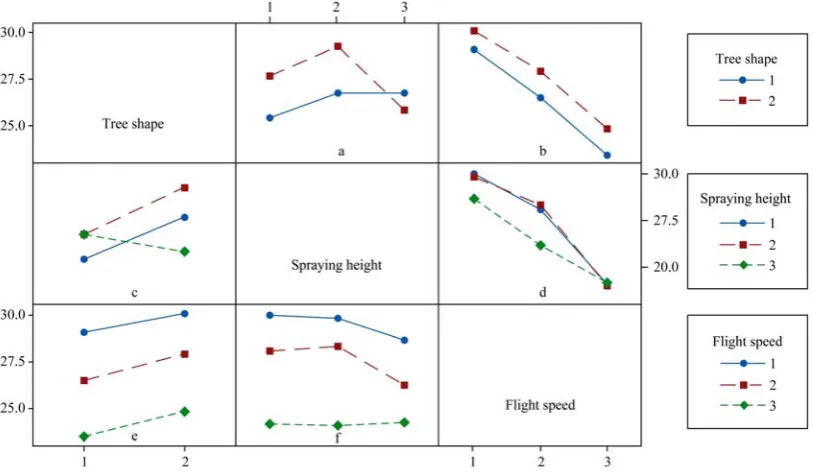
Figure 5 presents the influence of each control factor, which is more clearly presented with the main effects plot of the S/N ratios. The dotted markers define the mean S/N ratio of the 12 experiments. In the main effects graphics, the highest S/N ratios of each factor represents the optimum level of each corresponding control parameter. The optimum parameter combination for droplet density is A2-B2-C1. In particular, level 2 of factor A (inverted triangle shape) is necessary to obtain the maximum S/N ratio. This presented findings are agreed to the results of Zhang et al.[27], and may be a result of proper tree pruning to an inverted shape, which enhanced the droplet density of the citrus trees. Level 2 of factor B (spraying height of 1.4 m) gain the maximum droplet densities than that of 0.7 m and 2.1 m. Using a proper spraying height can likely deliver more droplets to the leaves of citrus trees. Level 1 of factor C (at a flight speed of 1 m/s) achieved the maximum
S/N ratio for the droplet density. The results presented an inverse correlation between the droplet density decreases and the flight speed because increased flight speed shortened the spraying time over the citrus trees, thereby reducing droplets on the leaves.
Figure 5 Main effects plot for the S/N ratio for droplet density using the near-OA L′12(2135) and “larger-the-better” characteristic
Table 6 presents the ANOVA results for the droplet density, which was performed at a significance level of α = 0.05 to determine the influence of the control factors on the spraying performance. The last column in Table 6 defines the percentage contribution of each control parameter with respect to the total variation, thereby revealing the degree of influence of each control parameter on the droplet density. The results indicate that the
flight speed, spraying height, and tree shape all significantly affect the droplet density based on their p-values (p < 0.05 is significant). The order of significance of the factors was (1) flight speed, (2) spraying height, and (3) tree shape, which represented contributions of 74.0%, 16.2%, and 8.8%, respectively. Thus, flight speed exhibited great influence on droplet density.
Table 6 ANOVA for the mean droplet density
Source DOF SS Adj SS Adj MS F P Contribution/% A 1 40.42 40.42 40.42 53.97 0.000 8.8 B 2 74.39 24.56 12.28 16.40 0.004 16.2 C 2 339.83 339.83 169.91 226.89 0.000 74.0 Residual
error 6 4.49 4.49 0.75 1.0
Total 11 459.12 100.0
To better understand the influence of each pair of factors on droplet density, an interaction plot was prepared. Figure 6 shows the interactions for three pairs of factors: tree shape, spraying height and flight speed. The interaction between the factors is indicated by non-parallel lines on the line graph, with less parallel lines indicating a stronger interaction. Flight speed did not present an interaction with tree shape based on the nearly parallel lines in Figure 6b and the symmetrical plot in Figure 6e. Among the tested tree shapes, the inverted-triangle shape showed the highest S/N ratios in every case of flight speed, which implied that the inverted-triangle tree shape produced the most stable and reliable spraying performance for droplet density. Among the tested flight speeds, the highest S/N ratios were achieved at a speed of 1 m/s for both tree shapes, and the lowest S/N ratios were achieved at a speed of 3 m/s. Thus, droplet density might increase as the flight speed decreases.
In Figure 6f and the symmetrical plot in Figure 6d, a small interaction was observed between flight speed and spraying height because the lines intersected and had similar slopes. For flight speed, the highest S/N ratio was observed at 1 m/s. The spraying height of 2.1 m exhibited the lowest S/N ratios among all spraying heights. The peak S/N ratio was achieved at a speed of 1 m/s and spraying height of 0.7 m based on the average of the two tree shapes.
However, spraying height interacted with tree shape based on the non-parallel lines in Figure 6a and Figure 6c, which showed an obvious interaction between tree shape and the level 3 and level 2 spraying heights. For tree shape, the spraying height of 1.4 m presented the highest S/N ratio. The inverted triangle shape showed better S/N ratios than the triangle shape at a spraying height of 0.7 m and 1.4 m.
To explore the potential factors that affect droplet density, we performed a stepwise regression using an automatic procedure to select a subset of predictor variables that provides the best prediction for modeling the droplet density[28]. For a tree shape, the dummy variable x1 was assigned, the number 0 for a triangle shape, and the number 1 for an inverted triangle shape. For spraying height and flight speed, the continuous variables x2 and x3 were assigned ranges of [0.7, 2.1] and [1.0, 3.0], respectively. We considered candidate factors from all quadratic items and interaction items of the control factors, which contained an intercept term, linear, squared and interactions terms, i.e., intercept;
x1, x2, and x3; x21, x22, and x23; x1x2, x1x3, and x2x3.
As shown in Table 7, the tree shape x1, spraying height x2, flight speed x3 and a squared term of spraying height x22 were eventually selected based on the stepwise regression procedure because their regression coefficients were significant and presented p-values less than 0.05. The other candidate factors were removed if their p-values were larger than 0.05. The prediction model for droplet density can be expressed as follows:
2
1 2 2 3
ˆ 29.36 3.67 14.29 5.62 6.72
y= + x + x − x − x (8) Each regression coefficient was estimated with the standard error (SE), e.g., the intercept coefficient was estimated in a 95% confidence interval of 29.36±4.31. The root mean squared error (RMSE) was 5.08, and the coefficient of determination (R2) was 0.606, i.e., 60.6% of the variation in the droplet density can be explained by the independent variables in the model. Notably, the interaction between tree shape and flight speed was fairly small, and it was removed in the stepwise regression because its p-value (0.937) was higher than 0.05, which is consistent with the results of the interaction plot. The p-value for the interaction between tree shape and spraying height was 0.880 and between spraying height and flight speed was 0.668. Thus, these interactions can be ignored in the regression model.
Table 7 Results of the stepwise regression for droplet density
Variable Estimate SE tStat p-value
Intercept 29.36 4.31 6.82 0.000
x1 3.67 0.98 3.75 0.000
x2 14.29 6.16 2.32 0.022
x3 -6.72 0.62 -10.87 0.000
x2
2 -5.62 2.17 -2.59 0.011
Note: The number of samples is 9×12=108, and the number of error degrees of freedom is 103. F-statistic vs. constant model = 39.6; and p-value = 4.95e-20.
Three-dimensional (3D) plots for the droplet density were generated based on Equation (8) to better understand the impact of the variables on the droplet density. The tree shape was maintained at x1=0 (triangle shape) and x1=1 (inverted triangle shape) given that the model had three variables. Figure 7 presents the 3D surface graph showing the effect of spraying height and flight speed on droplet density with different tree shapes.
Equation (8) and Figure 7 show that citrus trees with the inverted triangle shape can receive approximately 3.67 droplets/cm2 more than those with a triangle shape. The droplet density decreased by nearly 6.72 droplets/cm2 as the flight speed increased
by 1 m/s. According to the characteristics of the quadratic function, the maximum droplet density is attained when the spraying height is set to 1.27 m, and the corresponding maximum value can be predicted as 35.39 droplets/cm2.
Note: The upper surface was plotted with x1=1, and the lower surface was plotted with x1=0.
Figure 7 Response surface plot of droplet density vs. spraying height and flight speed for the different tree shapes
3.2 Effect of control factors on droplet density of the lower layer of citrus trees
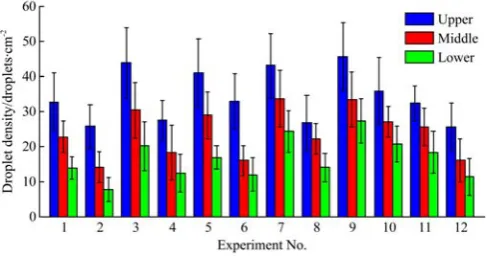
Although the previous section presented the optimal droplet density control parameters, it is difficult to obtain uniform droplet distributions on the upper, middle, and lower layers of a plant, especially for citrus trees[10,27]. The spraying performance on the lower layer of citrus trees will be fairly poor[16]. However, because the droplet deposition on the lower layer is critical for the prevention or control of pests and diseases, it should be further evaluated separately. Figure 8 shows twelve experimental results for droplet density in the three layers. The droplet density clearly decreased as the height of the layer decreased or the flight speed increased. The peak droplet density (27.15 droplets/cm2) on the lower layer was found at a 1.4 m spraying height and a 1 m/s flight speed, and with an inverted triangle shape, and the minimum droplet density (7.68 droplets/cm2) was found at a 0.7 m spraying height and a 3 m/s flight speed and with a triangle-shaped tree.
Figure 8 Droplet density for the three layers among twelve experiments
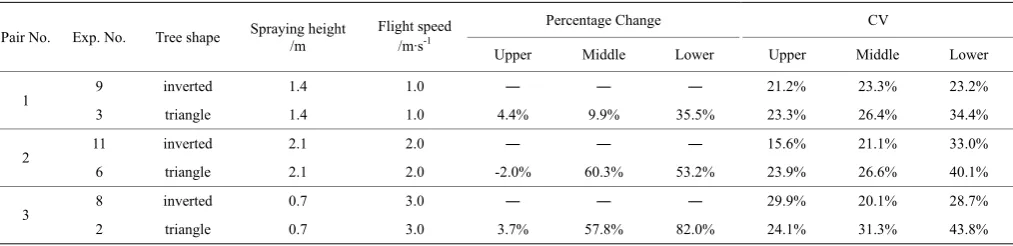
3.3 Tree shape effect on droplet density with identical spraying heights and flight speeds
inverted triangle and triangle. Nos. 11 and 6 were assigned as the second pair, which were characterized at a spraying height of 2.1 m and a flight speed of 2 m/s and with different tree shapes. Nos. 8 and 2 were assigned as the third pair and were characterized at a spraying height of 0.7 m and a flight speed of 3 m/s and with different tree shapes. Because the percentage change of droplet density in each pair of experiments was less than 4.5% on the upper layer, a significant difference in spraying performance was not observed for the upper layer between the inverted triangle-shaped and triangle-shaped trees, which may have been related to the similar coverage of the upper canopy between the two tree shapes leading to the same effect on droplet density. However, the inverted triangle-shaped trees exhibited significantly higher lower layer droplet densities as compared to the triangle-shaped trees, specifically 35.5%, 53.2%, and 82.0% for the three pairs of experiments, respectively.
The uniformity of droplet deposition and spray coverage quality can be measured by the CV. The inverted triangle-shaped trees exhibited lower layer droplet density CV values of 23.2%, 33.0%, and 28.7% in the three pairs of experiments, respectively, whereas the triangle-shaped trees presented CV values of 34.4%, 40.1%, and 43.8%, respectively. These results indicate that the lower layer of the inverted triangle-shaped trees presented better droplet density uniformity as compared to the triangle-shaped trees. However, the inverted triangle-shaped and triangle-shaped trees did not present significant differences in their upper or middle layer CV values.
The inverted triangle shape likely provided better ventilation space within the tree, and the downward air flow from the rotors may have actuated the movement of the citrus leaves, thus allowing easier droplet penetration into the lower layers of the citrus trees. However, the canopy of the lower layer of triangle-shaped trees may be hard to open via downward air flow from rotors, thus leading to poor penetration of droplets.
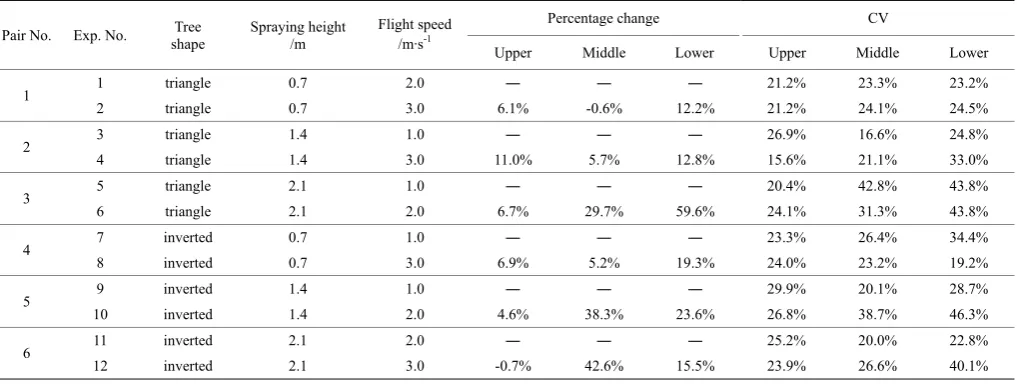
3.4 Spraying height effects on droplet density for trees with identical shapes and flight speeds
Changes in the droplet density percentage among the 6 pairs of experiments at the same tree shape and flight speed were characterized to better understand the influence of the spraying height on the droplet density (Table 9). The first four pairs of experimental data indicated that the droplet density of the upper layer will be moderately improved by 6.1%, 11.0%, 6.9%, and 6.7% at the spraying height of 1.4 m compared with the other spraying heights. However, the last two pairs of experiments did not show significant changes between the spraying heights of 0.7 m and 2.1 m, and the percentage change was less than 4.6%.
According to the first four pairs of experimental data, experiments at a spraying heights of 1.4 m presented more
significant improvements in the lower layer droplet density as compared to the other spraying heights, specifically increases of 12.2%, 12.8%, 19.3%, and 59.6%, respectively. In particular, the droplet density of experiment No.4, which was performed at a 1.4 m spraying height, drastically increased to 59.6% compared with experiment No.2, which was performed at 0.7 m spraying height under the same 3.0 m flight speed and triangle-shaped tree. The droplet densities of experiments No.8 and No.1, which were performed at a spraying height of 0.7 m, showed a moderate improvement of 23.6% and 15.5% compared with experiments No.12 and No.6, respectively, which were performed at a spraying height of 2.1 m.
A significant difference among from the CV results of the lower layer was not observed between the spraying height of 1.4 m and other heights among first four pairs of experiments. However, the CV values for the spraying height of 0.7 m were better than for the spraying height of 2.1 m in the last two pairs of experiments. For the CV results of the upper layer and middle layer, significant differences were not observed among the spraying heights.
Experiments performed at a spraying height of 1.4 m presented better droplet densities as compared to experiments performed at spraying heights of 0.7 m and 2.1 m. The downwash generated by the rotors at this optimum spraying height likely opened the canopy and enhance particle penetration deeper into the plan canopy[27]. In comparison, higher spraying heights, such as at 2.1 m, widened the spraying span and droplet drift, thus reduced the amount of droplets onto the lower layer of the inner citrus trees[10]. Similarly, lower spraying heights, such as at 0.7 m, produced much stronger downward from the rotors above the canopy, thereby resulting in poor droplet deposition mainly due to powerful downward wind disturbance on the leaves, which hindered droplets adherence.
3.5 Flight speed effects on droplet density for trees with identical shapes and spraying heights
To study the effect of flight speed on droplet density, the results from six pairs of experiments are provided in Table 10. Each pair of experiments was compared to a different flight speed with a constant tree shape and spraying height. The results showed that a slower flight speed in six pairs of experiments increased the percentage change in droplet density compared with the faster speed along the upper, middle and lower layer of plants. Additionally, the CV values of the lower layer in the experiments at a slower flight speed all indicated better uniformity relative to the faster flight speeds except for experiment No. 7. Thus, slower flight speeds had better spraying performance. However, reducing the flight speed during spraying applications would lead to the excessive use of pesticide and spray drift, which should be considered when choosing the proper flight speed.
Table 8 Percentage change and CV values of three pairs of experiments for droplet density with the same spraying height and flight speed
Pair No. Exp. No. Tree shape Spraying height /m Flight speed /m·s-1
Percentage Change CV
Upper Middle Lower Upper Middle Lower
1 9 inverted 1.4 1.0 ― ― ― 21.2% 23.3% 23.2%
3 triangle 1.4 1.0 4.4% 9.9% 35.5% 23.3% 26.4% 34.4%
2 11 inverted 2.1 2.0 ― ― ― 15.6% 21.1% 33.0%
6 triangle 2.1 2.0 -2.0% 60.3% 53.2% 23.9% 26.6% 40.1%
3 8 inverted 0.7 3.0 ― ― ― 29.9% 20.1% 28.7%
Table 9 Percentage change and CV values of six pairs of experiments for droplet density with the same tree shape and flight speed
Pair No. Exp. No. Tree shape
Spraying height /m
Flight speed /m·s-1
Percentage change CV
Upper Middle Lower Upper Middle Lower
1 9 inverted 1.4 1.0 ― ― ― 21.2% 23.3% 23.2%
7 inverted 0.7 1.0 6.1% -0.6% 12.2% 21.2% 24.1% 24.5%
2 10 inverted 1.4 2.0 ― ― ― 26.9% 16.6% 24.8%
11 inverted 2.1 2.0 11.0% 5.7% 12.8% 15.6% 21.1% 33.0%
3 4 triangle 1.4 3.0 ― ― ― 20.4% 42.8% 43.8%
2 triangle 0.7 3.0 6.7% 29.7% 59.6% 24.1% 31.3% 43.8%
4 3 triangle 1.4 1.0 ― ― ― 23.3% 26.4% 34.4%
5 triangle 2.1 1.0 6.9% 5.2% 19.3% 24.0% 23.2% 19.2%
5 8 inverted 0.7 3.0 ― ― ― 29.9% 20.1% 28.7%
12 inverted 2.1 3.0 4.6% 38.3% 23.6% 26.8% 38.7% 46.3%
6 1 triangle 0.7 2.0 ― ― ― 25.2% 20.0% 22.8%
6 triangle 2.1 2.0 -0.7% 42.6% 15.5% 23.9% 26.6% 40.1%
Table 10 Percentage change and CV values of six pairs of experiments to determine the droplet density with the same tree shape and spraying height
Pair No. Exp. No. shape Tree Spraying height /m Flight speed /m·s-1
Percentage change CV
Upper Middle Lower Upper Middle Lower
1 1 triangle 0.7 2.0 ― ― ― 21.2% 23.3% 23.2%
2 triangle 0.7 3.0 6.1% -0.6% 12.2% 21.2% 24.1% 24.5%
2 3 triangle 1.4 1.0 ― ― ― 26.9% 16.6% 24.8%
4 triangle 1.4 3.0 11.0% 5.7% 12.8% 15.6% 21.1% 33.0%
3 5 triangle 2.1 1.0 ― ― ― 20.4% 42.8% 43.8%
6 triangle 2.1 2.0 6.7% 29.7% 59.6% 24.1% 31.3% 43.8%
4 7 inverted 0.7 1.0 ― ― ― 23.3% 26.4% 34.4%
8 inverted 0.7 3.0 6.9% 5.2% 19.3% 24.0% 23.2% 19.2%
5 9 inverted 1.4 1.0 ― ― ― 29.9% 20.1% 28.7%
10 inverted 1.4 2.0 4.6% 38.3% 23.6% 26.8% 38.7% 46.3%
6 11 inverted 2.1 2.0 ― ― ― 25.2% 20.0% 22.8%
12 inverted 2.1 3.0 -0.7% 42.6% 15.5% 23.9% 26.6% 40.1%
4 Conclusions
The present study investigated the various control parameters for optimal droplet density using the Taguchi method and systematically analyzed the effect of each control parameter on the droplet density of the citrus tree lower layers. The main conclusions are as follows.
The optimum control parameters settings for droplet density were as follows: inverted triangle shape, flight speed of 1 m/s, and spraying height of 1.4 m. It is shown from the ANOVA results that the most significant factor was flight speed, which presented a percentage contribution of 74.0%, and the least significant factor was tree shape, which presented a percentage contribution of 8.8%.
The relationship between droplet density and the control parameters and their quadratic terms was characterized based on an established multiple regression model using stepwise regression. The R2 was 0.606 and the RMSE was 5.08, showing that the model fits the experimental data moderately well and presents an appropriate prediction error. Moreover, the results showed that inverted triangle-shaped citrus trees receive approximately 3.67 droplets/cm2 more than triangle-shaped trees and an increase in flight speed of 1 m/s will correspond to a decrease in droplet density of nearly 6.72 droplets/cm2. The predicted optimal spraying height for maximizing the droplet density was 1.27 m.
The lower layers of the inverted triangle-shaped trees exhibited
increased droplet densities as compared to the triangle-shaped trees at three different settings at identical spraying heights and flight speeds, specifically increases by 35.5%, 53.2%, and 82.0%, respectively. The lower layer of the inverted triangle-shaped trees exhibited the most uniform droplet distribution with CV values of 23.2%, 33.0%, and 28.7% in the three experiments, respectively. The experiment at a spraying height of 1.4 m presented enhanced lower layer droplet densities as compared to the other heights in the four experiments, specifically density increases of 12.2%, 12.8%, 19.3%, and 59.6%, respectively. In addition, the other heights did not exhibit significant differences in their CV values. However, the droplets did not exhibit obvious differences in the lower layer among the different flight speeds.
Acknowledgements
Key Laboratory of Spectroscopy Sensing, Ministry of Agriculture and Rural Affairs, P.R. China (No. 2018ZJUGP001).
[References]
[1] Damalas C A, Eleftherohorinos I G. Pesticide exposure, safety issues, and risk assessment indicators. International Journal of Environmental Research and Public Health , 2011 ; 8: 1402–1419.
[2] Li J, Lu H, Yang Z, Lü E L. Orchard Facilities and Equipment for Litchi and Longan in China. ASABE Annual International Meeting, St. Joseph, Mich., 2011; pp.1–7.
[3] He X K, Bonds J, Herbst A, Langenakens J. Recent development of unmanned aerial vehicle for plant protection in East Asia. Int J Agric & Biol Eng, 2017; 10(3): 18–30.
[4] Costa F G, Ueyama J, Braun T, Pessin G, Osório F S, Vargas P A. The use of unmanned aerial vehicles and wireless sensor network in agricultural applications. 2012 IEEE International Geoscience and Remote Sensing Symposium, 2012; pp. 5045–5048.
[5] Yang S L, Yang X B, Mo J Y. The application of unmanned aircraft systems to plant protection in China. Precision Agriculture, 2018; 19(2): 278–292.
[6] Gao Y Y, Zhang Y T, Zhao Y C, Li X H, Yang D B, Yuan H Z. Primary studies on spray droplet distribution and control effects of aerial spraying using unmanned aerial vehicle (UAV) against the corn borer. Plant Protection, 2013; 39: 152–157.
[7] Zheng Y J, Yang S H, Zhao C J, Chen L P, Lan Y B, Tan Y. Modelling operation parameters of UAV on spray effects at different growth stages of corns. Int J Agric & Biol Eng, 2017; 10(3): 57–66.
[8] Chen S D, Lan Y B, Li J Y, Zhou Z Y, Liu A M, Mao Y D. Effect of wind field below unmanned helicopter on droplet deposition distribution of aerial spraying. Int J Agric & Biol Eng, 2017; 10(3): 67–77.
[9] Qin W C, Qiu B J, Xue X Y, Chen C, Xu Z F, Zhou Q Q. Droplet deposition and control effect of insecticides sprayed with an unmanned aerial vehicle against plant hoppers. Crop Protection, 2016; 85: 79–88. [10] Xue X Y, Tu K, Qin W C, Lan Y B, Zhang H H. Drift and deposition of
ultra-low altitude and low volume application in paddy field. Int J Agric & Biol Eng, 2014; 7(4): 23–28.
[11] Zhou L P, He Y. Simulation and optimization of multi spray factors in UAV. 2016 ASABE Annual International Meeting, St. Joseph, Mich., 2016; pp.1–8.
[12] Hewitt A. Droplet size and agricultural spraying, Part I: Atomization, spray transport, deposition, drift, and droplet size measurement techniques. Atomization and Sprays, 1997; 7: 235–244.
[13] Gao Y, Zhang Y L, Zhang N Q, Niu L, Zheng W, Yuan H. Primary studies on spray droplets distribution and control effects of aerial spraying using unmanned aerial vehicle (UAV) against wheat midge. Crops, 2013;
2: 139–142.
[14] Xue X Y, Lan Y B, Sun Z, Chang C, Hoffmann W C. Develop an unmanned aerial vehicle based automatic aerial spraying system. Computers and Electronics in Agriculture, 2016; 128: 58–66.
[15] Zhang P, Wang K, Lyu Q, He S, Yi S, Xie R, et al. Droplet distribution and control against citrus leafminer with uav spraying. International Journal of Robotics and Automation, 2017; 32: 299–307.
[16] Derksen R C, Krause C R, Fox R D, Brazee R D, Zondag R. Effect of application variables on spray deposition, coverage, and ground losses in nursery tree applications. Journal of Environmental Horticulture, 2006; 24: 45–52.
[17] Carmita C N. Optimization of cutting parameters for minimizing energy consumption in turning of AISI 6061 T6 using Taguchi methodology and ANOVA. Journal of Cleaner Production, 2013; 53: 195–203.
[18] Yang W P, Tarng Y S. Design optimization of cutting parameters for turning operations based on the Taguchi method. Journal of Materials Processing Technology, 1998; 84: 122–129.
[19] Phadke M S. Quality engineering using robust design. Prentice Hall PTR, 1995.
[20] Nguyen N K. A note on the construction of near-orthogonal arrays with mixed levels and economic run size. Technometrics, 1996; 38: 279–283. [21] Wendelberger J R, Moore L M, Hamada M S. Making tradeoffs in
designing scientific experiments: A case study with multi-level factors. Quality Engineering, 2009; 21: 143–155.
[22] Balki M K, Sayin C, Sarıkaya M. Optimization of the operating parameters based on Taguchi method in an SI engine used pure gasoline, ethanol and methanol. Fuel, 2016; 180: 630–637.
[23] Asiltürk I, Neşeli S. Multi response optimisation of CNC turning parameters via Taguchi method-based response surface analysis. Measurement, 2012; 45: 785–794.
[24] Ficici F, Durat M, Kapsiz M. Optimization of tribological parameters for a brake pad using Taguchi design method. Journal of the Brazilian Society of Mechanical Sciences and Engineering, 2014; 36: 653–659. [25] Gopalsamy B M, Mondal B, Ghosh S. Taguchi method and ANOVA: An
approach for process parameters optimization of hard machining while machining hardened steel. Journal of Scientific & Industrial Research, 2009; 68: 686–695.
[26] Shahavi M H, Hosseini M, Jahanshahi M, Meyer R L, Darzi G N. Clove oil nanoemulsion as an effective antibacterial agent: Taguchi optimization method. Desalination and Water Treatment, 2016; 57: 18379–18390. [27] Zhang P, Deng L, Lyu Q, He S L, Yi S L, Liu Y D, et al. Effects of citrus
tree-shape and spraying height of small unmanned aerial vehicle on droplet distribution. Int J Agric & Biol Eng, 2016; 9(4): 45–52.