ABSTRACT
The presence of gas hydrate and associated gas in the Makran Accretionary Prism, offshore Iran, has been confirmed by various seismic indicators, including the bottom-simulating reflector (BSR), amplitude blanking, and bright spot. The pre-stack analysis and the study of amplitude-variation-with-offset (AVO) attributes are the most reliable tools for semi-quantitative study of gas hydrate and free gas resources. Due to the lack of well data in the most regions of gas hydrate accumulations in deep oceans, the study of AVO attributes and application of seismic inversion techniques are solutions to evaluate both gas hydrate and the free gas trapped beneath it. Conventional seismic stacked data increases the signal-to-noise ratio; however, amplitude stretching in far offsets resulted in normal move-out (NMO), and Poisson’s error in velocity analysis decreases the frequency content of stack section. Moreover a stacked seismic data do not present a real zero-offset seismic data. In this study, the AVO intercept section was used to remove far offset effects and produce a more realistic zero-offset section with a high frequency content. Consequent-ly, the acoustic impedance produced from the inverted intercept section shows acoustic property of the sediment in a better accuracy. According to the inverted section from AVO intercept data, free gas zone, and double bottom-simulating reflector, which identified about 50 ms below the first BSR, were observed with high vertical resolution.
Keywords: Amplitude-variation-with-offset (AVO), Intercept Attribute, Gas Hydrate, Free Gas, Double Bottom-simulating Reflector (DBSR)
Effat Behboudi1*, Nasser Keshavarz2, and Asghar Naderi2
1Department of Petroleum Engineering, Amirkabir University of Technology, Tehran, Iran
2Exploration and Production Research Center, Research Institute of Petroleum Industry (RIPI), Tehran, Iran
Identification of Gas Accumulation Adjacent to the Gas Hydrate
Bearing Zone by Inversion Utilizing AVO Attribute
*Corresponding author Effat Behboudi
Email: [email protected] Tel: +98 21 4825 3522
Fax: +98 21 4473 9723
Article history
Received: April 16, 2017
Received in revised form: September 09, 2017 Accepted: September 13, 2017
Available online: July 15, 2018
INTRODUCTION
Natural gas hydrates are crystalline solids of gas (mostly methane) and water formed in low temperature and high pressure thermodynamic
conditions[1]. Studying natural gas hydrates as a potential future energy resource has been
increased during the past decades. The total
amount of methane trapped in gas hydrates or
accumulated as free gas beneath the gas hydrate stability zone is quite large [2]. Main methods
of recovering gas from gas hydrates resources
pressure is lowered to adjacent zones of solid hydrate pressure due to the production well in the gas hydrate reservoir [3,4] and pressure reduction
frees the methane molecules from hydrate; thermal
stimulation method: the reservoir temperature is increased above the hydration temperature by hot water injection, steam stimulation or circulating hot fluids downhole[5]; chemical inhibitors injection: the injection of chemical inhibitors (such as salts and alcohols) shifts the pressure-temperature equilibrium conditions to lead a rapid dissociation of gas hydrate [6]; and finally carbon dioxide displacement method: this method produces methane via the exchange between CO2 and CH4 in this method [7]. In practice, a combination of these techniques has also been proposed. Depressurization method is considered as a relatively feasible method and the most efficient and economical recovery technique to produce methane from seabed gas hydrates [8].
A comprehensive gas hydrate exploration technology is integration of 3-D seismic data (such as multicomponent ocean bottom cables (OBC)), Marine controlled-source-electromagnetic (CSEM), marine sediment sampling, and gas geochemical analysis to reduce drilling risk. OBC technology
provides a direct measurement of shear wave to
estimate elastic modules and to provide a more reliable image of structure associated with gas hydrate reservoirs than primary wave data [8]. CSEM technique provides information on rock and fluid electrical properties due to the electrical resistivity contrast of gas hydrate and free gas bearing zones with water-saturated rocks[9]. Numerous seismic techniques such as seismic inversion, rock physics templates and modeling,
pre-stack seismic attribute study, and seismic velocity analysis have been developed to identify
gas hydrates in marine sediments and the trapped
free gas beneath them [10-15]. Most gas hydrate
resources which is generally found in deep marine
areas confront lack of well data, subsequently, exploration approach is heavily depends on seismic data for further evaluating these resources [16,17]. The dominant seismic indicator of gas hydrates accumulation is bottom-simulating reflector (BSR) which is sub-parallel to the seafloor and has a reverse polarity compared to the seabed on a seismic section [18]. This reflector corresponds as the base of gas-hydrate stability zone, and most of the seismic analyses have been focused on this reflector to characterize the above hydrates associated with its possible underneath free gas. BSR generally depicts the interface between higher P-wave velocity and lower P-wave velocity since a small amount of free gas below the gas hydrate stability zone decreases P-wave velocity considerably without affecting the S-wave velocity [19]. Thus, important information on gas hydrate and free gas accumulation across the base of the gas hydrate stability zone is provided by amplitude-variation-with-offset (AVO) characteristics of the BSR, which depends on P-wave and S-wave velocity changes [20-22].
In this study, the main target is investigation of the
regions which likely contain highly concentrated gas hydrate and free gas in the sediments across
EXPERIMENTAL PROCEDURES
Methods
AVO inversion
The AVO technique has been considered as an effective tool for reservoir characterization including porosity, density, lithology identification, and fluid content due to the fact that seismic amplitudes at layer boundaries are affected by the variations of the physical properties just above and below the boundaries [20,23]. Theoretical equations which completely determine the exact coefficients of the transmitted and reflected plane
waves and its mode converted waves when the
plane wave incident occurs at an interface between two semi-infinite isotropic and homogeneous layers have been developed by Zoeppritz in 1919 [24]. The Zoeppritz equation was simplified by making some approximations that describe the variation of P-wave reflection coefficients with the angle of incidence as a function of the P-wave velocity, the S-wave velocity, and the densities above and below the interface [25]. A series of linear approximations to the Zoeppritz equations has been developed for AVO analysis technique to predict the presence of natural gas. A useful approximation of the Zoeppritz equations has been proposed by Shuey in 1985 [26]; where AVO is estimated by performing a least-squares fit of the amplitudes from each time sample of the gather. This equation contains three terms of the intercept (A), gradient (B), and curvature (C):
) sin (tan
sin )
( 2 2 2
i i
i
i A B C
Rθ ≈ + θ + θ − θ (1)
where ), ( 2 1 ρ ρ ∆ + ∆ ≈ P P V V
A (2)
, 2
4 2
1 2 2
∆ − ∆ − ∆ = ρ ρ P S S S S P P P V V V V V V V V B (3) and . 2 1 P P V V
C= ∆ (4)
θ
can be estimated by equation 5 that relates the offset to the angle in the presence of an appropriate estimation of velocity [27]:(
)
,arcsin 2 2
0 2 2 2 2 + = x t v v v x r r i
θ (5)
where x is the source-receiver offset, vi is the
interval velocity of a particular layer, vr is the RMS velocity, and t0 is the zero offset two-way time
(TWT). The values VP, VS, and ρ are the P-wave
velocity, S-wave velocity, and density respectively. The first term (A) denotes the intercept which measures the band-limited reflection amplitudes at normal incidence or zero offset. The second term (B) is the gradient that predominates at the
intermediate angles Gradient measures the rate
of change of P-wave amplitude with offset and it is related to Poisson’s ratio. The gradient section is often a good indicator of gas reservoirs since Poisson’s ratio is greatly affected by gas in porous media [20]. The third term (C) is the curvature which controls the behavior of the reflection variation at far angles, and it is related to P-wave velocity.
For the low incidence angles (up to ~ 30°) based on the Shuey’s approximation of the Zoeppritz equation, the third term can be ignored and the intercept and gradient are estimated by a linear fit of P-wave reflection amplitudes to the sin2θ for
each time samples (Figure 1). Equation 1 can be expressed as [26]:
i
i A B
Figure 1: Intercept and Gradient calculation based on least-squares fit of the amplitudes of all traces at each time sample of the CMP-gather [28].
For a conventional stacked trace, the amplitude value for a time sample is the average of the amplitudes of all offsets. This average does not consider the relative amplitude changes based on different offsets while an AVO intercept trace
gives normal incidence amplitude considering the
amplitude value of each time sample depending on the related offset. Therefore, AVO intercept section can be considered as a better zero-offset section than a conventional stack section.
Impedance Inversion
Good –quality impedance inversion provides the detail of the subsurface due to the fact that acoustic impedance is a layer property (e.g. porosity and lithology) rather than interface property. The acoustic impedance is the result of the integrating of seismic data with well logs or velocity data. AVO analysis in conjunction with acoustic impedance improves interpretation and discrimination of lithology, and fluids. Subsequent AVO attribute analysis followed by AVO inversion was carried out to verify initial interpretation as well as to assess the possibility of distinguishing between different lithologies and fluids.
The inversion workflow utilized in this research constitutes of two steps. The first step is
reprocessing of seismic data to recover true
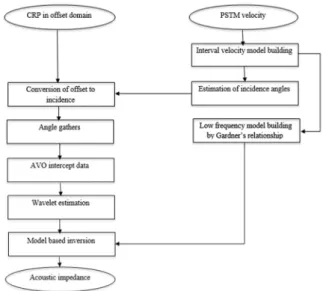
amplitude. This procedure includes geometrical spreading, transmission loss, attenuation, receiver directivity corrections, conversion of amplitude to reflection coefficient, and trim static correction [29]. The second stage is estimation of AVO attributes followed by post-stack inversion in order to estimate P-wave impedances. This workflow is depicted in Figure 2.
Figure 2: Workflow for calculating the acoustic impedance section from seismic data using AVO and post-stack inversion.
Seismic inversion requires initial low-frequency
impedance model to constrain the inversion
derived from the velocity model obtained during Pre-stack time migration process. Furthermore, the density profile was derived using Gardner’s relationship [30].(Gardner et al., 1974). Figure 3 shows the initial impedance model in which the acoustic impedance is continuously increasing with depth while no gas layer could be detected in pre-stack time migration (PSTM) velocity model nor as stated earlier on the resultant acoustic impedance initial model.
Figure 3: The initial impedance model on which the acoustic impedance steadily increases with depth while no gas layer is visible.
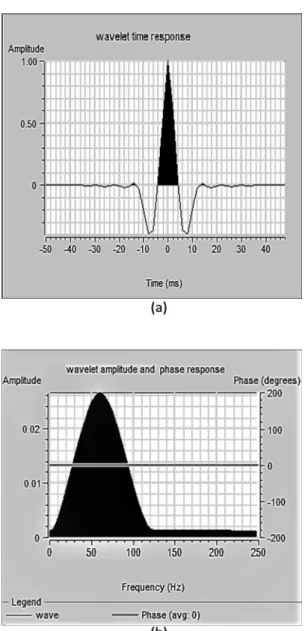
Zero-phase wavelet was statistically derived from the de-phased seismic data (Figure 4). Post-stack AVO intercept inversion was first computed at five selected control point (pseudo wells) locations to test the input parameters for robustness before computing the inverted P-impedance section. Afterward, a model based inversion (generalize
linear inversion) which was constrained not to
vary by more than 50% from the input model was applied on the background model to update acoustic impedance iteratively by minimizing the difference between synthetic seismic trace and real seismic data.
Figure 4: The statistical wavelet was extracted from the dephased seismic data. (a) The extracted zero-phase wavelet in time domain. (b) Amplitude and phase spectrum of the extracted wavelet in frequency domain.
Field Data
The data used in this study includes: 2-D pre-stack seismic data, pre-stack time migration velocity, and 2-D post-stack seismic data. These data have been acquired with 6100 m streamers length that consisting of 480 hydrophone group with 12.5 m receiver interval at a depth of 6 m. The energy source constitutes 2842 cubic inch airgun array at a depth of 5 m with a 25 m long shot interval
(a)
providing foldage of 120. Sample rate is 2 ms with record length of 7000 ms. Dominant frequency of the data is 50 Hz. The data were kindly provided by Exploration Directorate of National Iranian Oil Company (NIOC).
Datasets and Data Reprocessing
Pre-stack amplitude inversion should be applied to common reflection point (CRP) gathers in order to derive the AVO attributes. Analyzing AVO in CRP gathers after pre-stack time migration is more accurate than in common-midpoint (CMP) gathers on steeply dipping reflectors and in complicated structures due to the effects of CMP smearing. Therefore, Kirchhoff pre-stack time migration was applied to the data to produce reflection coefficients at image locations and provide suitable data required for AVO analysis.
The raw seismic data were also reprocessed in order to maintain true amplitudes [31]. For AVO analysis, the relative amplitudes of the seismic data should be preserved throughout the analysis in order to extract information on primary reflectivity. Therefore, all steps in the data reprocessing sequence could be fulfilled through the spherical divergence correction according to Ursin method [32], the transmission loss correction [33], the attenuation correction for the layers overlying top of gas accumulation (BSR) as Q=191 that was considered for the P-wave of this seismic line [31], receiver directivity correction was accomplished using Sheriff and Geldart equation [34], amplitude conversion to reflection coefficient using Warner function [35], and Trim static correction to accurately preserve the relative amplitudes to remove misalignments of seismic events which have not been corrected after normal move-out (NMO) corrections and the computation of angle gathers.
RESULTS AND DISCUSSIONS
Acoustic impedance inversion was applied to the Makran 2D seismic data to determine the extension of the gas-hydrate and free gas saturated zones. In this study, the seismic inversion has produced a data set of the acoustic impedance of different layers associated with the BSR by matching a reflectivity model to the seismic data.
Figure 5 shows the AVO intercept section of the selected line between CRPs 5000 to 9000 in the Iranian part of Makran accretionary prism. The pre-stack time migration RMS velocity was converted to the interval velocity using Dix formula [36] to convert offset gathers to angle gathers. All CRP traces were transformed from the offset domain to the angle domain by estimating the incidence angles for each offset and time sample using Equation 5. Then, for each time samples the intercept and gradient were estimated by equation 6. In the intercept section, the BSR is clearly characterized by reversed polarity with respect to the seafloor reflection at about 2000 ms TWT. In Figure 5, the seismic reflections above the BSR within the hydrate zone are weak compared to the seafloor and BSR reflectivity. It can be explained by the presence of hydrates that fill the sediment
pore spaces and decreasing the impedance contrast
deep sea fan in the Black Sea [41]. Therefore, the presence of double BSR and the gas below BSR were investigated through post-stack inversion.
Figure 5: AVO intercept section sample over Makran accretionary prism shows weak reflections due to the presence of hydrates in sediments and a negative and strong BSR that is produced by the accumulation of free gas at the base of the hydrate layer.
Figure 6: The wiggle traces show the seismic characters of the BSR and double BSR in CRPs 6598, 6998, and 7798. BSR is characterized by a negative polarity corresponding to the seafloor reflection due to decreasing of acoustic impedance of the underlying layer which is related to the gas presence. The double BSR is observed by amplitude lowering of the BSR and by a negative polarity with respect to the seafloor.
inversionmethod to the AVO intercept section. Also, Figure 8 shows impedance section by inverting the conventional post-stack seismic data. In both mentioned figures, the low acoustic impedance zone containing free gas positioned underneath of the gas hydrate stability zone, which has been observed as BSR due to the decrease in P-wave velocity at the transition zone from hydrate to
gas sediments while it was not included in the
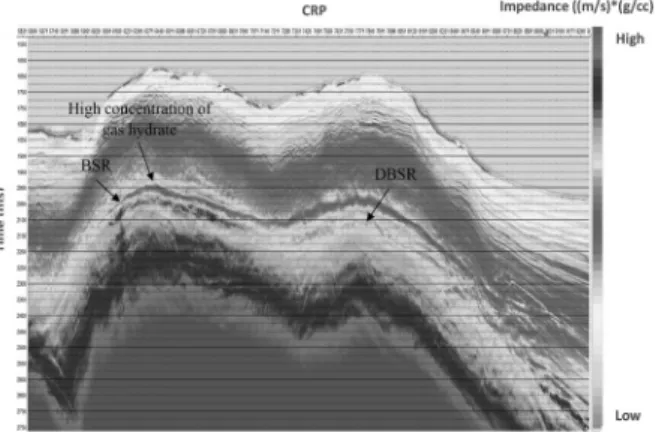
initial acoustic model. Comparing Figures 7 and 8 demonstrates that P-wave impedance of AVO intercept inversion has a high vertical resolution which helps thin layers such as DBSR be clearly observed while it is barely visible in the conventional post-stack inversion. In Figure 7, the high acoustic impedance between CRPs 6000-7000 could be due to the high concentration of gas hydrate (cementing effect) in the deepest part of the gas hydrate stability zone. The potential cemented gas hydrate reservoir at the base of the gas hydrate stability zone and existence of free gas beneath BSR would place these locations as a suitable candidate as well as an economical target for gas hydrate exploration in the future.
Figure 7: P-wave impedance from post-stack inversion of AVO intercept data. BSR and DBSR are clearly seen by a transition from high acoustic impedance containing gas hydrate to scattered reflectors with low acoustic impedance including free gas. Also, highly concentrated hydrate zone at bottom part of gas hydrate zone is shown.
Figure 8: P-wave impedance from conventional post-stack inversion. BSR is clearly seen by a transition from high acoustic impedance containing gas hydrate to a low acoustic impedance including free gas while high concentration of gas hydrate at bottom of hydrate stability zone and DBSR are barely visible.
Several hypothesis for a DBSR could be considered: (1) the presence of sediments partially saturated with gas hydrates containing a different gas chemical composition which produces a BSR with a different stability zone [42,38,15], (2) regional uplifting of the bottom of the hydrate stability field from a previous
depth to the current depth due to the compressional
tectonic [39], (3) migration of free gas through
competent or concrete layers of fractured sediments
or in response to a recent sea bottom warming related to Global Warming effect [39,43]; and (4) diagenetic reflections that are produced by the opalA/opal-CT transition show normal polarity to the seafloor [39]. Referring to [44], considering the thickness modeling of gas hydrate stability zone with different gas compositions, geothermal gradient, water depth, pore pressure gradient, seabed temperature, and salinity revealed that the source of gas hydrate in some areas in Iranian part of Oman Sea includes thermogenic gases (containing 95% methane). Therefore, the formation mechanism for negative and weak DBSR in the studied area could be referred to migration of gas through unconsolidated sediments.
CONCLUSIONS
The AVO intercept data provided a better zero-offset section than a conventional stack section due to taking into consideration of the relative amplitude changes in different offsets. Therefore, AVO intercept inversion was undertaken to identify
regions where are likely to contain gas under
the BSR. Comparing inverted conventional stack seismic data with acoustic impedance derived from intercept section, revealed the efficiency of the proposed approach in depicting better distribution of free gas and gas hydrate zones.
The amplitude blanking, high acoustic impedance, and strong reflections of BSR identified from the 2D seismic profiles below seabed have been affected by the presence of gas hydrate. High acoustic impedance above the BSR is related to
the presence of gas hydrates while a sharp drop
in acoustic impedance below the BSR (sometimes appears as scattered layers) indicates the presence of free gas. Blanking zone could be related to high acoustic impedance which is associated with low reflectivity. A second BSR, which mimics the seafloor topography representing reverse polarity corresponding to this one, has appeared about 50 ms below the BSR and could be considered
as a second gas hydrate resource containing
thermogenic gas composition.
ACKNOWLEDGMENTS
The authors thank the Geophysics Department of National Iranian Oil Company (NIOC) Exploration Directorate for providing seismic data, their kind consent to publish this work and their financial support. The associate editor and three anonymous
reviewers are also appreciated for their useful
NOMENCLATURES
: Bottom-simulating Reflector BSR
: Common-MidPoint CMP
: Normal Move-Out NMO
: Amplitude-variation-with-offset AVO
: Double Bottom-simulating Reflector DBSR
: Multicomponent Ocean Bottom Cables OBC
: Marine Controlled-Source-Electromagnetic CSEM
: Two-way Time TWT
: National Iranian Oil Company NIOC
: Pre-Stack Time Migration PSTM
: Common Reflection Point CRP
REFERENCES
1. Hardage B. A. and Roberts H. H., “Gas Hydrate in the Gulf of Mexico: What and Where Is the Seismic Target?,” Leading Edge, 2006, 25, 566 -571.
2. Kvenvolden K. A. and Lorenson T. D., “Global Occurrences of Gas Hydrate,” In Proceedings of the Eleventh International Offshore and Polar
Engineering Conference, 2001, 1, 462 -467.
3. Su Z., Moridis G. J., Zhang K., and Wu N., “A Huff-and-puff Production of Gas Hydrate Deposits in Shenhu Area of South China Sea through a vertical well,” Journal of Petroleum
Science Engineering, 2012, 86–87, 54–61.
4. Moridis G. J. and Reagan M. T., “Strategies for Gas Production from Oceanic Class 3 Hydrate Accumulations,” In Proceedings of the Offshore
Technology Conference, Houston, TX, USA,
2007.
5. Tan Z., Pan G., and Liu P., “Focus on the Development of Natural Gas Hydrate in China,”
Sustainability, 2016, 8, 520- 539.
6. Holder G. D. and Lee S. Y., “Methane Hydrates Potential as a Future Energy Source,” Fuel
Processing Technology, 2001, 71, 181-186.
7. White M. D. and McGrail B. P., “Numerical Simulation of Methane Hydrate Production from Geological Formations via Carbon Dioxide Injection,” Proceedings of the Offshore
Technology Conference, Houston, TX, USA, 2008.
8. Backus M. M., Murry P. E., Hardage B. A., and Graebner R., “High-resolution Multicomponent Seismic Imaging of Deep-water Gas Hydrate System,” The Leading Edge, 2006, 25,578-596. 9. Edwards N., “Marine Controlled Source
Electromagnetics: Principles, Methodologies, Future Commercial Applications,” Surveys in
Geophysics, 2005, 26, 675-700.
10. Fohrmann M. and Pecher I. A., “Analyzing Sand-dominated Channel Systems for Potential Gas-hydrate-reservoirs Using an AVO Seismic Inversion Technique on the Southern Hikurangi Margin, New Zealand,” Marine and Petroleum Geology, 2012, 38, 19-34.
11. Ghosh R. and Sain K., “Effective Medium Modeling to Assess Gas Hydrate and Free Gas Evident from the Velocity Structure in the Makran Accretionary Prism, Offshore Pakistan,” Marine Geophysical Researches, 2008, 29, 267-274.
12. Xia G., Sen M. K., and Stoffa P. L., “Mapping of Elastic Properties of Gas Hydrates in the Carolina trough by Waveform Inversion,” Geophysics,
2000, 65, 735-744.
13. Riedel M. and Shankar U., “Combining Impedance Inversion and Seismic Similarity for Robust Gas Hydrate Concentration Assessments-a Case Study from the Krishna-Godavari basin, East Coast of India,” Marine and Petroleum Geology, 2012, 36, 35-49.
Modeling in the Western Continental Margin of India,” Marine Geophysical Researches, 2007, 28, 101-107.
15. Lu S. and McMechan G. A., “Elastic Impedance Inversion of Multichannel Seismic Data from Unconsolidated Sediments Containing Gas Hydrate and Free Gas,” Geophysics, 2000, 69, 164-179.
16. Pevzner R. L., Volkonskaya A. L., Bouriak S. V., Bocharova A. A., and et al., “Prediction of Properties of Gas Hydrate Bearing Sediments from the Dynamic of Reflected Waves without Borehole Data,” 70th EAGE Conference and
Exhibition, Italy, Rome, 2008.
17. Shelander D., Dai J., and Bunge G., “Predicting Saturation of Gas Hydrates Using Pre-stack Seismic Data, Gulf of Mexico,” Marine Geophysical Research, 2010, 31, 39-57.
18. Shipley T. H., Houston M. H., Buffler R. T., Shaub F. J., and et al., “Seismic Evidence for Widespread Possible Gas Hydrate Horizons on Continental Slopes and Rises,” AAPG Bulletin, 1979, 63, 2204-2213.
19. Lee M. W. and Dillon W. P., “Amplitude Blanking Related to the Pore-filling of Gas Hydrate in Sediments,” Marine Geophysical Researches,
2001, 22, 101-109.
20. Ostrander W. and Gassaway G. S., “The Use of Offset Dependent Reflectivity in Exploration,”
SEG, 1983, 637–638.
21. Ecker C., Dvorkin J., and Nur A., “Sediments with Gas Hydrates: Internal Structure from Seismic AVO,” Geophysics, 1998, 63, 1659-1669. 22. Chen M. A., Riedel M., Hyndman R. D., and
Dosso S. E., “AVO Inversion of BSRs in Marine Gas Hydrate Studies,” Geophysics, 2007, 72, 31-43. 23. Fatti J. L., Smith G. C., Vail P. J., Strauss P. J., and
et al., “Detection of Gas in Sandstone Reservoirs Using AVO Analysis: a 3-D Seismic Case History Using the Geostack Technique,” Geophysics, 1994,
59, 1362-1376.
24. Zoeppritz K., “Erdbebenwellen VIII B, on the Reflection and Penetration of Seismic Waves through Unstable Layers,” Goettinger Nachr,
1919, 66-84 (in German).
25. Smith G. C. and Gidlow P. M., “Weighted Stacking for Rock Property Estimation and Detection of Gas,” Geophysics Prospecting, 1987, 35, 993-1014.
26. Shuey R. T., “A Simplification of Zoeppritz Equations,” Geophysics, 1985, 50, 609-614. 27. Walden A. T., “Making AVO Sections More
Robust,” Geophysical Prospecting, 1991, 39, 915-942.
28. Young R. A. and LoPiccolo R. D., “A Comprehensive AVO Classification,” The Leading Edge, 2003, 22, 1030-1037.
29. Salehi E., Javaherian A., Ataee Pour M., Keshavarz Farajkhah N., and et al., “Quantitative Seismic Pre-stack Analysis of Potential Gas-hydrate Resources in the Makran Accretionary Prism: offshore Iran,”
Marine and Petroleum Geology, 2013, 48,
160-170.
30. Gardner G. H. F., Gardner L. W., and Gregory A. R., “Formation Velocity and Density-the Diagnostic Basics for Stratigraphic Traps,”
Geophysics, 1974, 39, 770-780.
31. Hosseini Shoar B., Javaherian A., Keshavarz Farajkhah N., and Seddigh Arabani M., “Reflectivity Template, a Quantitative Intercept-gradient AV O Analysis to Study Gas Hydrate Resources-A Case Study of Iranian Deep Sea Sediments,” Marine
and Petroleum Geology, 2014, 51, 184 -196.
Spreading in Layered Medium,” Geophysics,
1990, 55, 492-496.
33. Fink C. R. and Spence G. D., “Hydrate Distribution off Vancouver Island from Multi Frequency Single-channel Seismic Reflection Data,”
Journal of Geophysical Research, 1999, 104,
2909-2922.
34. Sheriff R. E. and Geldart, L. P., “Exploration Seismology,” Cambridge University Press, 1995. 35. Warner M., “Absolute Reflection Coefficients
from Deep Seismic Reflections,” Tectonophysics,
1990, 173, 15-23.
36. Dix C. H., “Seismic Velocities from Surface Measurements,” Geophysics, 1955, 20, 68-86. 37. Geletti R. and Busetti M., “A Double Bottom
Simulating Reflector in the Western Ross Sea, Antarctica,” Journal of Geophysical Research,
2011, 116, 1-15.
38. Andreassen K. J., Miniert P. Bryan, and Singh S. C., “A Double Gas-hydrate Related Bottom Simulating Reflector at the Norwegian Continental Margin, in Gas Hydrates: Challenges for the Future,” Annals of the New York Academy of Sciences, 2000, 912, 126–135.
39. Foucher J. P., Nouzè H., and Henry P., “Observation and Tentative Interpretation of a Double BSR on the Nankai Slope,” Marine
Geology, 2002, 187, 161-175.
40. Baba K. and Yamada Y., “BSRs and Associated Reflections as an Indicator of Gas Hydrate and Free Gas Accumulation: an Example of Accretionary Prism and Forearc Basin System along the Nankai Trough, Off Central Japan,”
Resource Geology, 2004, 54, 11-24.
41. Popescu I., Batist M. D., Lericolaisc G., Nouzéc H., and et al., “Multiple Bottom-simulating Reflections in the Black Sea: Potential Proxies
of Past Climate Conditions,” Marine Geology,
2006, 227, 163-176.
42. Posewang J. and Mienert J., “The Enigma of Double BSRs: Indicators for Changes in the Hydrate Stability Field,” Geo-Marine Letters,
1999, 19, 157-163.
43. Rajput S., Muller T. M., Clennell M. B., Rao P. P., and et al., “Constraints on Seismic Reflections and Mode Conversions at Bottom Simulating Reflectors Associated with Gas Hydrates,”
Journal of Petroleum Science and Engineering,
2012, 88, 48-60.
44. Afazeli E., Gerami S., and Badakhshan A., “Sensitivity Analysis on Parameters of Affecting the Thickness of Gas Hydrate Zone in the Gulf of Oman,” the SPE Middle East Unconventional Gas