LOAD SHEDDING SCHEME IN LARGE PULP MILL BY USING ANALYTIC
HIERARCHY PROCESS
H.H. Goh*, B.C. Kok, S.W. Lee, Mohd. Zin. A.A**
* Department of Electrical Power Engineering, Faculty Electrical and Electronic Engineering, Universiti Tun Hussein Onn Malaysia, Parit Raja, Batu Pahat, Johor Malaysia.
** Department of Electrical Power Engineering, Faculty of Electrical Engineering, Universiti Teknologi Malaysia, Skudai, Johor, Malaysia.
Abstract
Pulp mill is one of the heavy industries that consumes large amount of electricity in its production. In particular, the breakdown of the generator would cause other generators to be overloaded. Thus, load shedding scheme is the best way in handling such condition. Selected load will be shed under this scheme in order to protect the generators from being damaged. In the meantime, the subsequence loads will be shed until the generators are sufficient to provide the power to other loads. In order to determine the sequences of load shedding scheme, analytic hierarchy process (AHP) is introduced. Analytic Hierarchy Process is one of the multi-criteria decision making methods. By using this method, the priority of the load can be determined. This paper presents the theory of the alternative methods to choose the load priority in load shedding scheme for a large pulp mill.
Keywords: Analytic Hierarchy Process (AHP), expert choice, load shedding, pulp mill
1. Introduction
In pulp mill, there are quite a number of areas of land being used to allocate the equipment and devices [1]. The electrical system must be well managed in order to ensure that the operation in the mill is fully utilized. However, there might be breakdown in the electrical system due to the longer working period of the machines. The malfunction of the equipment or devices might cause huge losses to the company. Due to this, the load shedding scheme is needed in the pulp mill to prevent damage of the power generator.
In order to provide the manageable and controlled over the whole system in the pulp, an advance and relevant mill wide automation system and mill wide electrical load shedding system are placed in the centre of a control room which are operated by the well trained engineers or technicians [2]. There are a lot of supervisory control and data acquisition (SCADA) system providers and SIEMENS is one of them [4]. SIEMENS provides the software which can communicate with SIEMENS PLCs using various communication devices in different protocol.
Commonly, the protocol of the devices is object linking and embedding process control (OPC), Profibus and Modbus [3]. By using SCADA, engineers or technicians can monitor the electrical system in the control room and take the fastest response towards any problems occurred. With the SCADA system, the remote switching of equipment or devices can also be done. This is effective in order to reduce the down time of the system.
Load shedding is defined as the action of switching off the electrical supply to parts of the electricity system [4]. Load shedding might cause the loss of some information but it is possible to keep other equipments or devices which are more important to operate [5]. The system will operate as normal once the system had been restored. Although the practice is rare, it is a core part of the emergency management of all the electricity networks [5]. There are several ways in handling load shedding problems. For example, proportional or priority load shedding are commonly used to alleviate network violations [6]. The loads will be cut off if the power flow and voltage could not be alleviated. Another technique which is optimal power flow (OPL) method which is proposed by Dornellas et al. [7] in order to solve the over curtailed problems. Besides, Wang and Billinton [8] also proposed optimum load shedding techniques to minimize the interruption cost in the power system. No matter how, the main purpose of the load shedding is to prevent the damage of the whole system.
2. Background of study 2.1. Information of pulp mill
The load shedding scheme in a pulp mill is being studied. Fig.1 illustrates the electric power system of the pulp mill. Basically, the pulp mill electrical system can be divided into a few parts such as:
i. 3-phase, 50Hz voltage level High voltage : 110kVac
Medium voltage : 35kVac and 6kVac Low voltage : 690Vac and 400Vac ii. 3×Turbine generator: 2×120MW+90MW=330MW
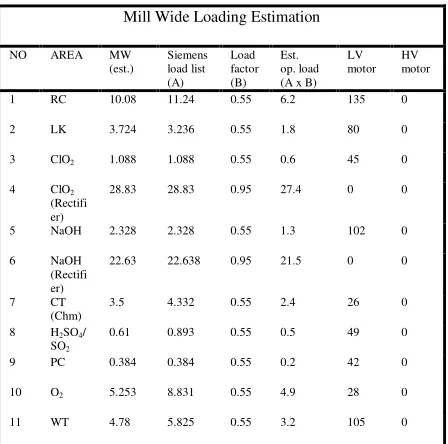
The studies of application of AHP and fuzzy AHP will be conducted based on the information given as shown in Fig.1. The connection from the system to the grid had been tripped and the connection of the 90MW generator had been cut off. The generator is overloaded. In such circumstances, the load shedding scheme is activated. There are three main bus bars in the pulp mill electrical system. However, the bus bar 3 contains the RC boiler is having exception from the load shedding scheme. The boiler plays an important role in power recovery [9]. This is because the boiler will keep generating the steam for the steam turbo generator in order to make sure those operations of others equipments do not come to a halt. The loading estimation are tabulated as in Table 1.
Table 1. Pulp mill loading estimation
Mill Wide Loading Estimation
NO AREA MW (est.)
Siemens load list (A)
Load factor (B)
Est. op. load (A x B)
LV motor
HV motor 1 RC 10.08 11.24 0.55 6.2 135 0 2 LK 3.724 3.236 0.55 1.8 80 0 3 ClO2 1.088 1.088 0.55 0.6 45 0 4 ClO2
(Rectifi er)
28.83 28.83 0.95 27.4 0 0 5 NaOH 2.328 2.328 0.55 1.3 102 0 6 NaOH
(Rectifi er)
22.63 22.638 0.95 21.5 0 0 7 CT
(Chm)
3.5 4.332 0.55 2.4 26 0 8 H2SO4/
SO2
0.61 0.893 0.55 0.5 49 0 9 PC 0.384 0.384 0.55 0.2 42 0 10 O2 5.253 8.831 0.55 4.9 28 0 11 WT 4.78 5.825 0.55 3.2 105 0
12 WWT 5 3.883 0.55 2.1 120 3 13 Comp. 2.347 2.347 0.55 1.3 10 0 14 RB 30.5 22.88 0.55 12.6 303 9 15 VE 7.245 7.245 0.55 4.0 54 0 16 MB 13.139 13.08 0.55 7.2 123 6 17 TG1 0.8445 0.8445 0.55 0.5 35 0 18 TG2 0.4885 0.4885 0.55 0.3 21 0 19 TG3 0.246 0.246 0.55 0.1 17 0 20 COAL 3 3 0.55 1.7 40 0 21 CT(VE
)
6.725 14.877 0.55 8.2 20 6 22 CT(TG
1+2)
8.249 15.161 0.55 8.3 25 4 23 WH 11.2 7.06 0.55 3.9 259 0 24 PDM 26.57 31.572 0.55 17.4 621 11 25 FL 50.4 37.45 0.55 20.6 290 6 Total 249 249 158.0 2550 45
2.2. Application of analytic hierarchy process The AHP approach is a powerful and flexible decision making process, and it was developed by Dr. Thomas Saaty, professor at the University of Pittsburgh [10]. It can be used either for the analysis or comparison among criteria. Christos Douligeris [11] had used AHP in analyzing and comparing the quality of several telecommunications companies. He also made the evaluation of alternate technologies in telecommunication [11].
[image:2.595.59.283.538.760.2]stages. The load shedding stage will trigger one by one until the load had been curtailed to the preset safe level. The triggering time for the power relay is preset by the technicians or engineers. If the stage 1 of the load shedding scheme did not reduce the electric plant load sufficiently, the stage 2 will shunt the breakers automatically [11].
H.H. Goh and B.C. Kok proposed the idea of AHP in load shedding scheme for the electrical power system [9]. As in the paper, the judgments of the importance of the criteria are based on the experiences gained. For instance, the frequency is 5 times more important than voltage whereas the important of frequency is also twice of the stability [9]. In the study, they had also justified 5 criteria and 5 alternatives as the elements in determining which is the most prior to the load shedding scheme [9].
On the other hand, Les Frair et al. had used Analytic Hierarchy Process in undergraduate curriculum evaluation. During the evaluation, the affected parties (students, faculty, employers, etc.) evaluate the curriculum alternatives through internet web site [13]. Besides, the AHP approach is also used in solving management problem. For example, Krystal Ramoutar and Chanan S. Syan analyzed the critical factors associated with successful implementation of WCM techniques in ISO 9001 certified firms based on AHP. They found that resistance to change is the most critical factor that leads to successful of ISO9001 implementation [14].
S. Yue, J. Yu, and B. Liang used the combination of data envelopment analysis (DEA) and AHP in their research on based assessment method of power system black-start effective schemes of ancillary services. By using the AHP approach, the best sequence of restoration path had obtained [15].
In the production of a company, the selection of machine tool must be done wisely. There are a lot of criteria need to be considered such as cost, profit, and period of modal returning. In order to make the best decision with given conditions, E. Cimren et al. used the AHP approach in machine tool selection. The priority of the alternatives can be changed from time to time. For example, one of the alternatives in machine tool named MX-50HB was ranked in the first place if cost analysis is the most prior for all the criteria. However, once the most prior criteria changed to reliability, machine tool named V-40 became the first among alternatives [16]. Thus, it is possible to make the final decision if the priority among cost and reliability could be identified clearly.
3. AHP algorithm
Various forms of AHP are available in research works nowadays. However, this paper will use the form which is introduced by Dr. Thomas L. Saaty. The way in finding the pair wise comparison values is differs with other versions of AHP analysis. Some other methods are using the normalized pair wise comparison values
within the matrices. The corresponding weights are obtained from the average values in each row. However, this paper emphasized on getting the nth root of product of the pair wise comparison value in each row of the matrices and then normalizes the aforementioned nth root of products to obtain the corresponding weights and ratings. The process of AHP analysis can be shown in 3 steps as shown below:
Step 1: Develop the weights for criteria
• Develop a single pair wise comparison matrix
for the criteria. For this paper, the ratio between criteria is obtained.
• Multiplying the values in each row to obtain
the nth root of product and find the total root of product in whole system.
row each of product product
of root
nth =n (1)
where n is the positive integer number.
• Normalizing the nth root of product to get the
appropriate weights.
∑ =
) (n rootof product
product of
root n
weight th
th
(2)
• Calculate the Consistency Ratio (CR) with the
aid of Random Index (RI) and CR must be less than 0.1 to make sure the result is reliable. If CR exceeds 0.1, the adjustments of the pair wise values need to be done.
RI CI
CR= (3)
1 n
n Max _ Lambda CI
− −
= (4)
) (
_Max columneachalternative weightperrow
Lambda =∑ ∑ ×
(5) where ∑columnis the summation of pair wise values for each alternative vertically.
RI is direct function of the number of alternatives or system being considered and is given as:
n RI 1 0 2 0 3 0.58 4 0.9 5 1.12 6 1.24 7 1.32 8 1.41 9 1.45
Step 2: Develop the rating for each alternative in each criterion
• The process is the same as in Step 1. However,
Step 3: Calculate the overall weights and determine the priority
• The final score for each alternative is the
summation of the product of criterion to alternative.
• There will be n number of overall weight and
n must be an integer that does not exceed 9.
X e Alternativ I
Criterion
X e Alternativ C
Criterion X
e Alternativ
B Criterion X
e Alternativ A
Criterion score Final alternativeX
× +
+
× +
×
+ ×
=
...
where Criterion A = 1st criterion, Criterion B = 2nd criterion, …, Criterion I = 9th criterion.
where 1 ≤ X ≤ 9 (6)
The highest of the score shows the preceding load to be shed if compared with others.
The process of the AHP analysis can be illustrated as in Fig.2.
4. Results and analysis
From the Table 1, there are 7 information of the pulp mill listed. They are area, estimation of area power, Siemens load list, load factor, estimation of operating load power, LV motor and HV motor. For the area, it is essential for the analysis because it can clarify which
part of the electrical system is facing problems. Estimation of area power is the information of power that delivered to the area. For the estimation of operating load power, it shows how much is the output power of that area. On the other hand, the Siemens load list will only work with Siemens software and hence, it does not included in the load shedding analysis. The same goes to load factor, most of the area has the same value. For the LV and HV motor, the availability of the motor will only affect the reactive power. Generally, name of the area, estimation of area power and estimation of operating load power are the key points in load shedding scheme.
From the key points selected, estimation of area power and estimation of operating load will be the criteria for the load shedding analysis. In the meantime, the alternatives of the criteria can also be determined. As discussed in Section 2, there 4 areas that more significant which are CIO2 REC, NaOH REC, PDM and FL. Hence, the criteria and alternatives of the system have fulfilled the conditions for AHP analysis. The relationship of the parameters can be illustrated as in Fig.3.
4.1. Result by applying formula
Step 1: Develop the weights for criteria
• Develop a single pair wise comparison matrix
for the criteria. The ratio of total operating load to the total of area power and vice versa had been obtained as in Table 2.
Fig.3: The hierarchy of load shedding scheme.
Table 2. Pair wise comparison table for criteria
OP. LOAD AREA POWER
OP. LOAD 1 0.677
AREA POWER 1.478 1
• As in Fig.3, there are two criteria need to be
considered in order to achieve the goal. Thus, the number of root, n=2.
• The root of product for each criterion can be
obtained by using (1) and is shown in Table 3.
Table 3. The root of product of criteria
2nd ROOT OF PRODUCT
OP. LOAD 0.823
AREA POWER 1.216
TOTAL 2.038
• The weights among the criteria, Wc is given
by: = = 596 . 0 404 . 0 W power area for Weight load operating for Weight W C C
Step 2 (i): Develop the rating for each alternative in operating load
• The pair wise comparison of alternatives are
shown as below:
CR1 represents the CIO2 REC; CR2 represents NaOH REC; CR3 represents PDM and; CR4 represents FL.
= 1 184 . 1 958 . 0 752 . 0 845 . 0 1 809 . 0 635 . 0 044 . 1 236 . 1 1 785 . 0 330 . 1 575 . 1 274 . 1 1 4 CR 3 CR 2 CR 1 CR 4 CR 3 CR 2 CR 1 CR load operating of compare wise Pair
• There are totally 4 alternatives under the
operating load section. So, the number of root, n=4. The 4th root of product is shown in Table 4.
Table 4. The 4th root of product for alternatives in operating load
4th ROOT OF PRODUCT
CIO2 REC 1.178
NaOH REC 1.002
PDM 0.870
FL 0.974
TOTAL 4.024
• Therefore, the weights of alternatives in
operating load consideration, WCA1 are:
= = 242 . 0 216 . 0 249 . 0.293 0 W FL for Weight PDM for Weight REC NaOH for Weight REC 2 CIO for Weight W 1 CA 1 CA
• The result of alternatives sequences in operating
load can be shown in Fig.4.
• Since the number of alternatives, n=4, hence the
consistency ratio, CI has to determine by using (3), (4), and (5).
• ;CI 0.012;RI 0.9 RI
CI
CR= = =
1 . 0 013 . 0 CR= < ∴
• Since CR < 0.1, there is no corrective action
required.
Step 2 (ii): Develop the rating for each alternative in area power
• The pair wise comparison matrix for the
alternative under area power evaluation is as follow: = 1 897 . 1 227 . 2 748 . 1 527 . 0 1 174 . 1 922 . 0 449 . 0 852 . 0 1 785 . 0 572 . 0 085 . 1 274 . 1 1 4 CR 3 CR 2 CR 1 CR 4 CR 3 CR 2 CR 1 CR power area of compare wise Pair
• There are 4 alternatives under evaluation of
area power. Thus, the number of root, n=4. Table V shows the 4th root of product for the area power.
Graph of OP. LOAD (AHP)
[image:5.595.326.548.79.352.2]CIO2 REC 29% NaOH REC 2 5% PDM 22% FL 24 % CIO2 REC NaOH REC PDM FL
Table 5. The 4th root of product for alternatives in area power
4th ROOT OF PRODUCT
CIO2 REC 0.962
NaOH REC 0.818
PDM 0.911
FL 1.395
TOTAL 4.086
• The weight for each alternative under
evaluation of area power can be obtained by using (2). The weights of alternatives for area power, WCA2 are:
= = 342 . 0 223 . 0 200 . 0.235 0 W FL for Weight PDM for Weight REC NaOH for Weight REC 2 CIO for Weight W 2 CA 2 CA
• The results for the priority of loads under
[image:6.595.323.549.155.341.2]evaluation of area power can be illustrated in Fig. 5.
• By applying the (3), (4), and (5), we calculate
consistency ratio, CR.
• ;CI 0.044;RI 0.9
RI CI
CR= = =
1 . 0 049 . 0 CR= < ∴
• The CR is less than 0.1 which is within the
reliable range and hence, checking of CR is not required.
Step 3: Calculate the overall weights and determine the priority
• In order to calculate the overall performance
for the loads, the overall weights for alternatives can be obtained by using (6).
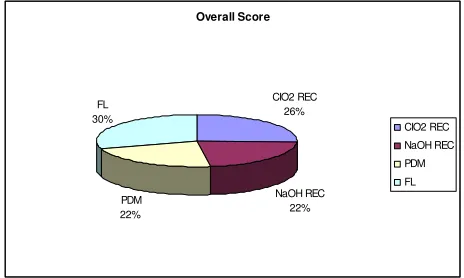
• As the results, the overall performance can be
illustrated as in Fig.6.
• From Fig.6,
301 . 0 ) 342 . 0 596 . 0 ( ) 242 . 0 404 . 0 ( D 220 . 0 ) 223 . 0 596 . 0 ( ) 216 . 0 404 . 0 ( C 220 . 0 ) 200 . 0 596 . 0 ( ) 249 . 0 404 . 0 ( B 258 . 0 ) 235 . 0 596 . 0 ( ) 293 . 0 404 . 0 ( A = × + × = = × + × = = × + × = = × + × =
• The results in Fig.6 can be illustrated into pie
chart form as in Fig.7.
It is clearly being seen that the FL load will be the first load to be shed when load shedding scheme is activated. This is because FL load consumes the highest electrical power under AHP approach. The SCADA system will keep tracing the condition of the electric power balancing in the islanded electrical system. Once the generator is still overloaded, the CIO2 REC will be the second load to be shed. Same goes to NaOH REC and PDM.
For the comparison purpose, the AHP analysis for load shedding had also been done by using Expert Choice software. The algorithms in solving AHP problems are similar with the manual calculation. In addition, the pair wise comparison table can be built by using numerical, verbal, or graphical method.
First of all, the pair wise comparison table is built. The pair wise value is determined based on the priority comparison between criteria. Fig.8 shows the process of inserting the pair wise value to the software by using graphical comparison method.
Overall Score CIO2 REC 26% NaOH REC 22% PDM 22% FL 30% CIO2 REC NaOH REC PDM FL
Fig.7: The overall performance for each alternative.
Graph of Area Pow er (AHP)
CIO2 REC 24% NaOH REC 20% PDM 22% FL 34% CIO2 REC NaOH REC PDM FL
Fig.5: The percentage of alternatives in area power.
×
×
×
×
×
×
×
×
[image:6.595.313.545.372.511.2]Expert choice enables users to save the time in process of calculation. Thus, the analysis continues by entering the pair wise values for alternatives. The priorities of the alternatives are being compared for each criterion. As in Fig.9, the pair wise comparison table of alternatives for operating load had been built by using numerical method.
By applying the same process which similar to Fig.9, the pair wise verbal comparison of alternatives for area power can be illustrated in Fig.10.
In fact, there are no different in analyzing the data entered in Fig8, Fig.9, and Fig.10. The graphical, numerical, and verbal pair wise comparison methods are providing convenience for users to make the comparison. The pair wise graphical method is recommended in this paper. This is because the ratios of pair wise comparison are quite close to each others. By using the graphical method, the difference among the criteria and alternatives are more significant. Last
but not least, the final result computed by using expert choice can be shown in Fig.11.
From Fig.11, the sequences of the load priority are same as the calculated results. The sequences of the load shedding scheme are FL, CIO2 REC, NaOH REC and lastly PDM. Although the value of the weights are different, the roughly concept is still the same. Hence, the SCADA system can act properly to shed the load when necessary by using AHP priority selection method.
5. Discussion
Generally, the results computed by expert choice are similar to the manual computation. Hence, by using the combination AHP algorithm programming in the SCADA system, the system might be response faster. In addition, the AHP algorithm only applied basic mathematic operands; it would not cause the burden to the operating system. In fact, the expert choice is using the same algorithm as the theory. Hence, the computation time can be minimized.
In this paper, the priorities of the alternatives were clearly been stated by using AHP algorithm. The judgments are based on the logical consequence. Besides, the inconsistency evaluation toward judgments can be done in order to avoid the conflict of decision. The inconsistency level of the result might misjudge the priority. Due to this, the inconsistency level must be always less than 0.1. These are advantages of AHP. The outcome of the analysis can convince the others in decision making.
However, AHP has some drawbacks. One of the major disadvantages is the ability in considering vagueness condition. AHP can only solve the problems which the levels of importance are known. In order to solve this weakness, the fuzzy AHP, which has the α-cut as the consideration of fuzziness can be introduced.
In short, the AHP is useful for comparing the priorities among the competing alternatives in a range of objectives to be met. The formulas for AHP calculation are easy to understand. Due to this, this can be widely used in more applications.
6. Conclusion
In conclusion, the loads priority in load shedding scheme is successfully selected by using AHP. AHP is a good multi decision making method and can be apply in any field of study. For this case, load shedding scheme providers might use this approach to determine the preceding load to be shed. Data of each branch or Fig.11: The overall priorities for each alternative.
Fig.10: The pair wise verbal comparison of alternatives for operating load.
Fig.9: The pair wise numerical comparison of alternatives for operating load.
area will be collected by using software. Then, the operators or engineers can take the proper action in handling the problems. In fact, the malfunction of power system in the industries would cause a lot of losses to the companies. Hence, the losses can be minimized by fully utilize the load shedding scheme. Furthermore, the whole AHP process applies basic calculations in selecting the load based on a few criteria and alternatives. This enables users to conduct correction on the system easily. By obtaining the important parameters from the supervisory system, the appropriate actions can be done to prevent unnecessary incidents. This method also helps people to capture subjective and objective evaluation measurements. Last but not least, there are a lot of factors that will affect the load shedding scheme. Thus, AHP is introduced to the load shedding scheme for electrical system in a pulp mill is beneficial to either consumers or developers.
7. Acknowledgement
The authors gratefully acknowledged staff in the Laboratory of Electric Machines and Drives as well as the Laboratory of Electric Power, UTHM for their valuable contribution towards the success of this work. The authors would like to thank the Ministry of Higher Education, Malaysia (MOHE) and Research and Innovation Centre, UTHM for financially supporting this research under the Fundamental Research Grant Scheme (FRGS) grant No.0704.
8. References
[1] A. Nordlander. (2004). THE PERFORMER #2-The world’s biggest single-line pulp mill in Hägglunds customer magazine. [Online]. Available:
http://www.hagglunds.com/Upload/200608111340 19A_The%20worlds%20largest%20mill.pdf [2] H.H. Goh, and B.C. Kok, “A unique load shedding
application in large pulp mill electrical system,” in 2010 9th International Conference on Environment and Electrical Engineering (EEEIC), pp. 206-209. [3] Direct Industry. (2010). Brochure SCADA
SOFTWARE Process control & monitoring. [Online]. Available:
http://pdf.directindustry.com/pdf/ascon/scada- supervisory-control-and-data-acquisition-software-6014-62782.html
[4] S.Hirodontis, H. Li, and P.A. Crossley, “Load Shedding in a distribution network,” in
International Conference on Sustainable Power Generation and Supply, 2009, SUPERGEN ’09, pp. 1-6.
[5] H.H. Goh, and B.C. Kok, “A unique load shedding application in large pulp mill electrical system,” in 2010 9th International Conference on Environment and Electrical Engineering (EEEIC), pp. 206-209.
[6] Y. Ding, P. Wang, and L. Goel, “Reliability assessment of restructured power systems using optimal load shedding technique,” Generation, Transmission & Distribution, IET, vol. 3, no. 7, pp. 628-640, 2009.
[7] C. Dornellas, M. Schilling, A. Melo, J.C.S. Souza, and M.B. Do Coutto Filho, “Combining local and optimised power flow remedial measures in bulk reliability assessment,” IEE Proceedings, Generation, Transmission and Distribution, vol. 150, no. 5, pp. 629-634, Sep. 2003.
[8] P. Wang, and R. Billinton, “Optimum load shedding technique to reduce the total customer interruption cost in a distribution system,” IEE Proceedings, Generation, Transmission and Distribution, vol. 147, no. 1, pp. 51-56, 2000. [9] H.H. Goh, and B.C. Kok, “Application of analytic
hierarchy process (AHP) in load shedding scheme for electrical power system,” in 2010 9th
International Conference on Environment and Electrical Engineering (EEEIC), pp. 365-368. [10]T.L. Saaty, The Analytic Hierarchy Process. New
York: Mc Grawhill, 1980. [11]C. Douligeris, and I.J. Pereira, “A
telecommunications quality study using the analytic hierarchy process,” IEEE journal, Selected Areas in Communications, vol. 12, no. 2, pp. 241-250, 1994.
[12]Z.P. Ding, S. Srivastava, and D. Cartes, “Expert based dynamic load shedding scheme for shipboard power systems,” in Conference Record of the 2006 IEEE, Industry applications conference, 2006. 41st IAS annual meeting, vol. 3, pp. 1338-1344. [13]F. Les, O.M. Jessica, and E.M. Jack, “An
undergraduate curriculum evaluation with the analytic hierarchy process,” presented at FIE conference 992, 1998.
[14]R. Krystak, and S.S. Chanan, “An AHP based study of WCM implementation factors in ISO 9001 certified manufacturing organizations in Trinidad and Tobago,” in Proceedings of the World Congress on Engineering 2009, WCE 2009, London, U.K., July 1-3, 2009.
[15]S. Yue, J. Yu, and B. Liang, “Research on based assessment method of power system black-start effective schemes of ancillary services,” in Third International Conference on Electric Utility Deregulation and Restructuring and Power Technologies,2008. DRPT 2008, pp. 252-257. [16]E. Cimren, E. Budak, and B. Catay, “Development