55
Experimental and Theoretical Study on the
CH
4Adsorption by Granular and Microporous
Activated Carbon
A. Aleghafouri1, M. Mahdyarfar2٭, M. Mohsen-Nia1, A. Mohajeri2 and M. Asghari1
1- Chemical Engineering Group, Department of Engineering, University of Kashan, Kashan, Iran 2- Gas Division, Research Institute of Petroleum Industry (R.I.P.I.), Tehran, Iran
Abstract
Adsorbed natural gas (ANG) by Granular Activated Carbon (GAC) has been widely investigated as an alternative to CNG and LNG technologies for storage and transportation of natural gas. In the present work, a theoretical and experimental study was conducted to accurately determine the amount of adsorption of CH4 by GAC. To carry out the experiments, the volumetric method was used up to 4 MPa at constant temperature of 298 K. Also, various adsorption isotherm models were used to model the experimental data collected from the experiments. The accuracy of the results obtained from the adsorption isotherm models was compared and the values for the regressed pa-rameters were reported. The results shows that the amount of CH4 adsorbed is dependent on the physical characteristics of activated carbons. Moreover, the Toth, two term TVFM and Sips isotherm models show good agreement with the experimental data.
Key words:
Adsorbed Natural Gas, Activated Carbon, Adsorption IsothermIntroduction
One of the main drawbacks of natural gas (NG) as a fuel is its low density. For example, 1 L of NG at normal temperature and pressure (NTP) will yield 0.04 MJ on combustion while 1 L of gasoline will yield 34.8 MJ [1]. Whereas natural gas is a cheap and readily available source of fuel, its suitability for a particular application depends on the ability to store an adequate amount of it. This is a particularly acute problem in the design of gas driven vehicles. Storage is also a problem in the gas supply industry. NG needs to be stored at periods of low demand to meet peak requirements and it needs to be transported in containers by road, rail, and sea to regions not connected by pipeline. The principle constituent of NG is methane, which has a critical temperature of
191 K. Thus, NG cannot be liquefied by pressure alone. Liquefied natural gas (LNG) is usually stored as a boiling
liquid at about 113 K in a cryogenic tank at a pressure of about 1 atm (0.103 MPa). Alternatively, the gas is
stored as a compressed supercritical fluid known as
compressed natural gas (CNG) at room temperature and about 200 MPa. LNG has a density of about 600 times greater than that at NTP (denoted 600 v/v) while CNG is about 220 v/v [1].
ANG by GAC has been widely investigated as an alternative to CNG and LNG technologies for storage and transportation of natural gases [2-8]. The physical characteristics of adsorbent, i.e., activated carbon can
significantly affect the amount of gas adsorbed and
desorbed by GAC. Extensive investigations have been
directed to study such effect [9−11].
In this study, theoretical and experimental investiga-tions were performed to determine the adsorption of CH4 by commercial microporous GACs up to 4 MPa at 298 K and to study different adsorption isotherm models to correlate the adsorption data.
Experimental
MaterialsTwo commercial granular microporous activated carbons were used in this study:
Table 1 contains the physical specifications of tow
samples obtained by applying N2 adsorption using
ASAP2010 (Micromeritics Co.) apparatus.
CH4 Adsorption measurement
To obtain the adsorption isotherms of CH4 on activated carbons a volumetric based apparatus was used in this study. A schematic diagram of the apparatus is shown in Fig. 1. This set up also has a pressure transducer to measure the equilibrium pressure with the accuracy of ±1 mbar. The apparatus has previously been tested for leak absence. Prior to measurement, the samples are de-gassed at 300 oC for approximately 2 h at low pressure.
To determine the amount of CH4 adsorbed on the
activated carbon, at first stage, the adsorption cell is filled up with the degassed AC, the dead volume inside
the cell is then determined with helium injection from
the reference cell, which has been previously filled with
helium gas up to the initial pressure and the adsorption cell reaches the thermodynamic equilibrium condition by opening valve 2. The total volume of the reference and adsorption cells and connecting lines is assumed to be V2, where helium can be penetrated into and it can be calculated using P1, the initial pressure of the reference cell, P2 the equilibrium pressure of the whole adsorption system (the reference cell and the adsorption cell), and
V1, the volume between valves 1 and 2. Therefore, it is possible to determine the dead volume (Vvoid) inside the adsorption section (between valves 2 and 3) using the following relation:
Vvoid = V2-V1 (1) To inject CH4, the reference cell is filled with CH4 at a known pressure. Then, gas from the reference cell is injected to the adsorption cell by opening the connecting
Table 1- Physical specification of AC samples used
Sample BET surface area(m2/gr)
Micropores volume (cm3/gr)
Average pore diameter (Ả)
AC1 1170 0.48 10.3
AC2 1117 0.45 11.5
Figure 1- Schematic diagram of the volumetric based apparatus used to CH4 adsorption measurements
valve. Having reached equilibrium, the connecting valve between the adsorption and reference cells is closed and this procedure is repeated for further pressures of adsorption isotherm. To determine the amount of CH4 adsorbed at any equilibrium pressure, the following equation was employed:
P1,i V1=Z1,i n1,i RT (2)
P2,i V2=Z2,i n2,i RT (3)
P2,i-1 Vvoid=Z2,i-1 nvoid,i RT (4) Where P1,i and P2,i are the initial pressure of the refer-ence cell and the equilibrium pressure of the adsorption
and reference cells for a defined point (for example i) of
CH4 adsorption isotherm, respectively, and n1,i, n2,i and
nvoid represent the mole numbers of CH4 before and after equilibrium in the V1,V2 and Vvoid volumes, respectively. Also, Z is the compressibility-factor of CH4, which can
be determined at a defined pressure using the simple
form of the virial expansion [13]:
(5) In which
(6) Where
(7)
(8)
Finally, the mole numbers of CH4 adsorbed on the activated carbon at this pressure is determined as shown below:
nadsorbed,i=n1,i +nvoid,i-1 -n2,i (9) Therefore, the amount of adsorption (the mass ratio of adsorbed CH4 (g) to activated carbon (g)) at a defined
pressure is calculated by dividing the weight of adsorbed CH4 (nadsorbed ×16.034) by that of the activated carbons
Modeling
To reduce the experimental data, different adsorption isotherm models were used. The adsorption isotherm models used in this study are rendered in Table 2. As observed, each adsorption isotherm model is based on its own physical and theoretical concept and contains several adjustable parameters. The details of the as-sumptions made for each adsorption isotherm models are given elsewhere [14-16].
The parameters for the adsorption isotherm models
were obtained by the least square fit of the adsorption
models to the experimental data collected in this study using the Sigma plot ver. 11.0 software. It is noteworthy
that the coefficient of determinations (R2
adj) was used to
Table 2- Different isotherm models
Isotherm model Equation
Langmuir
Freundlich
Sips
Toth
Dubinin - Radushkevich (DR)
Two-Term TVFM
Where A = RT ln (Ps /P), P: operation pressure, Ps: saturation pressure
obtain the regressed parameters of the models.
Results and discussion
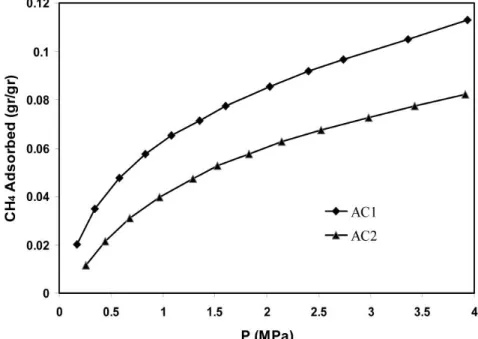
To determine the CH4 adsorption isotherms, the experi-mental data obtained were used at twelve equilibrium pressures up to nearly 4 MPa and temperature of 298 K for each GAC sample. Figure 2 shows the adsorption isotherms of CH4 for the GAC samples used in this study. It can be seen that amounts of CH4 adsorbed increases by pressure rising, but the increasing trend is not
sig-nificant at higher pressures. Also, the results show that
sample AC1 has the higher adsorption in comparison with sample AC2, and this is because of the higher micropore volume and BET surface area.
To compare samples used in this study with wood based granulated carbon used by ADVANTICA technology, the values of STP volume of CH4 adsorbed per volume of adsorbent (v/v) at 2.45 MPa and room temperature together with enhancement factor (ANG/ CNG storage) are presented in table 3 [17]. It can be seen that the values for the samples used in this study are better than those of the sample used by ADVANTICA technology. Also, it should be mentioned that although v/v values for the sample used in this study at 3.5 MPa and room temperature are not high (75 v/v for AC1 and 55 v/v for AC2), the results reported from research in this area show that the target value of 150 v/v deliver-able at 3.5 MPa and room temperature make the system commercially attractive [18] is still hardly reached. Table 4 shows the obtained results including adjust-able parameters and R2
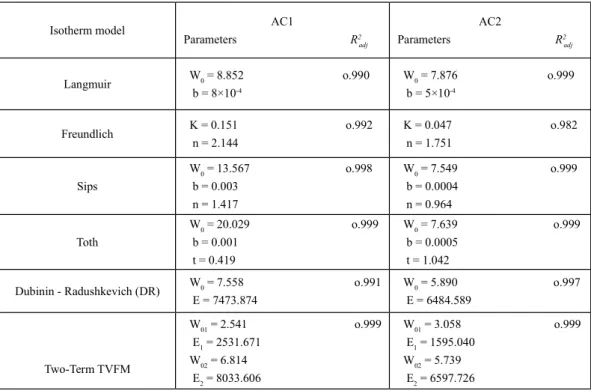
adj adjusting six isotherm models,
presented in Table 2, with the experimental data of CH4 adsorption isotherms obtained from two GAC samples. As observed, it is concluded that the Toth, two term TVFM and Sips isotherms show better agree-ment with the experiagree-mental data for two GAC samples in comparison with the other isotherms, whereas the Freundlich equation shows inferior results compared with the experimental data.
The accuracy of the results obtained from the two-term
TVFM isotherm model in comparison with the other isotherm models having the same theoretical concept (such as DR) is related to the presumptions considered for this model. As seen in Table 2, two-term TVFM equation contains four adjustable parameters, i.e., W01,
E1, W02, and E2. For the homogeneous microporous structure adsorbents W02 = 0. The first term of the two
term TVFM model represents the adsorption of CH4 onto
micropores and the second term justifies the adsorption
onto super-micropores. Therefore, the use of DR equation with one term cannot give superior results in the comparison of experimental data.
Conclusions
An experimental study was carried out to determine CH4 adsorption capacities of two different types of GAC up to 4 MPa at 298 K and the results obtained are comparable with wood based granulated carbon used by ADVANTICA technology. Also, various adsorption isotherm models were used to model the experimental data obtained from those two GAC samples. The accu-racy of the results obtained from the adsorption isotherm models was compared and the values for the regressed parameters were reported. The results showed that the physical characteristics of activated carbons such as BET surface area, micropore volume, and pore size
Table 3- Comparison of ANG capacity at 2.45 MPa and room temperature
Sample CH4 Adsorbed (v/v) ANG/CNG storage
AC1 61.1 2.83
AC2 40.4 1.87
Sample used by ADVANTICA 32.4 1.50
Table 4- Data reduction results
Isotherm model AC1
Parameters R2 adj
AC2
Parameters R2 adj
Langmuir W0 = 8.852 o.990 b = 8×10⁻⁴
W0 = 7.876 o.999 b = 5×10⁻⁴
Freundlich K = 0.151 o.992 n = 2.144
K = 0.047 o.982 n = 1.751
Sips
W0 = 13.567 o.998 b = 0.003
n = 1.417
W0 = 7.549 o.999 b = 0.0004
n = 0.964
Toth
W0 = 20.029 o.999 b = 0.001
t = 0.419
W0 = 7.639 o.999 b = 0.0005
t = 1.042
Dubinin - Radushkevich (DR) W0 = 7.558 o.991 E = 7473.874
W0 = 5.890 o.997 E = 6484.589
Two-Term TVFM
W01 = 2.541 o.999 E1 = 2531.671
W02 = 6.814 E2 = 8033.606
W01 = 3.058 o.999 E1 = 1595.040
distribution have significant effects on the amount of
CH4 adsorbed and used in this study are better than those used in ADVANTICA technology. Also, it is concluded that the Toth, two-term TVFM and Sips isotherms show better agreement with the experimental data in comparison with the other isotherms.
References
[1] Cracknell R.F., Gordon P. & Gubbins K.E., “Influ ence of pore geometry on the design of microporous materials for methane storage”, J. Phys. Chem., Vol. 97, No.2, pp. 494-499, 1993.
[2] Brunauer S., Emmett P.H. & Teller E., “Adsorption of gases in multimolecular layers”, J. Am. Chem. Soc., Vol. 60, No. 2, pp. 309-319, 1938.
[3] Lu X.C., Li F.C. & Watson A.T., “Adsorption mea surements in Devonian shales”, Fuel, Vol. 74, No. 4, pp. 599-603, 1995.
[4] Inomata K., Kanatawa K., Urabe Y., Hosono H. & Araki T., “Natural gas storage in activated carbon pellets without a binder”, Carbon, Vol. 40, No. 1, pp. 87-93, 2002.
[5] Diamond W.P. & Schattel S.J., “Measuring the gas content of coal: a review”, Int. J. Coal. Geology, Vol. 35, Nos. 1-4, pp. 311-331, 1998.
[6] Jiang S.Y., Zollweg J.A. & Gubbins K.E., “Theory of Adsorption of Trace Components”, J. Phys. Chem., Vol. 98, No. 9, pp. 2403-2411, 1994.
[7] Vasiliev L.L., Yanonchik L.E., Mishkinis D.A. & Rabetsky M.I., “Adsorbed natural gas storage and transportation vessels”, Int. J. Therm. Sci., Vol. 39, Nos. 9-11, pp. 1047-1055, 2000.
[8] Zhang S.Y., Talu O. & Hayhunt D.T., “Highpres sure adsorption of methane in zeolites NaX, MgX, CaX, SrX and BaX”, J. Phys. Chem., Vol. 95, No. 4, pp. 1722-1726, 1991.
[9] Bastos-Neto M., Canabrava D.V., Torres A.E.B. & Rodriguez-Castellon E., “Effects of textural and surface characteristics of microporous activated carbons on the methane adsorption capacity at high pressures”, Appl. Surf. Sci., Vol. 253, No. 13, pp. 5721-5725, 2007.
[10] Shao X., Wang W. & Zhang X., “Experimental measurements and computer simulation of methane adsorption on activated carbon fibers”, Carbon, Vol. 45, No. 1, pp. 188-195, 2007.
[11] Quinn D.F. & Macdonald J.A., “Natural gas storage”, Carbon, Vol. 30, No. 7, pp. 1097-1103, 1992. [12] Mohammadi T., Abedinzadegan Abdi M., Parvin-pour A. & Mahdyarfar M., “Prediction of active carbon and carbon molecular sieve’s adsorption behavior with the adsorption models”, 7th Chemical Engineering
Con-ference, Tehran University, Tehran, Iran, 2002.
[13] Smith J.M., Van Ness H.V. & Abbott M.M., Intro-duction to chemical engineering thermodynamics, 6th
ed., Ch. 3, pp. 97-98, McGraw-Hill Companies, Inc., 2001.
[14] Toth J., Adsorption, Theory, Modeling, and Anal-ysis, Vol. 107, Ch. 1, pp. 58-66, Marcel Dekker, Inc., 2001.
[15] Do D.D., Adsorption Analysis: Equilibria and Kinetics, Vol. 2, Ch. 3, pp. 49-77, Imperial College Press, 1998.
[16] Dubinin M.M., “Fundamentals of the theory of ad sorption in micropores of carbon adsorbents: Charac-teristics of their adsorption properties and microporous structures”, Carbon, Vol. 27, No. 3, pp. 457-467, 1989. [17] Dvorak K., Hodrien R.C., Judd R., Bates D., Allen M. & Ingram J., Internal Advantica Technology Co. Report, 2003.