18
Water and Manufacturing Process Effect on Cow’s Milk
Content in Essential Inorganic Elements
Chrysostomos Vasilios Milis
1, Vincenzo Tufarelli
2, Vasiliki Kinigopoulou
3,
Chrysa Mastrodimou
41
Ministry of Rural Development and Foods, Soil, plant, water and fertilizers analysis of central Macedonia, Sindos 57400
2
University of Bari, Italy
3
Soil and water resources Institute, Sindos Thessaloniki
4
Harokopio University of Athens
Abstract
The objective of this study was to determine the effects of mineral content of drinking water on mineral content of cow’s milk, and to evaluate the effect of skimming process on mineral content of milk. The mineral content of milk is particularly important to the infant food formula industry, whilst milk products cover significant proportion of adult requirements in inorganic elements. Presently water is not considered feed and official controls in EU are restricted to complete feed for ruminants (complementary feed and forages), excluding water quality and content. Nevertheless, water is the main constituent (87%) of milk. Thirty Holstein Friesian cows, with the same milk production; parity and stage of lactation where randomly allocated in to two equal groups and fed the same ration but had access to different water supply, in a changeover design. Additionally, milk samples with different fat content 0, 1.5 and 3.5% were taken during the year, from manufacturing milk supplies, representing the 90% of Greek milk pool. The elements determined were Ca, Mg, Zn, Mn, Cu, Fe by the use of atomic absorption spectroscopy, and P was determined through UV-VIS spectrophotometer. Water did not have significant effect on the content of Ca and P but significant effect on Mg, Cu and Mn content of milk. Milk fat removal significantly increased the content of Ca, P, and Mg. Manufacturing process did not affect micro element content. The elements Zn and Fe were not affected by manufacturing process neither by drinking water. Food composition tables should be updated as macro mineral content of milk is reduced gradually corresponding to higher yielding cows; whilst trace element content tend to increase as a result of higher proportion of concentrates fed.
Keywords: drinking water; cow’s milk; inorganic elements; skim milk.
1. Introduction
Minerals are constituents of the bones, teeth, soft tissue, muscle, blood, and nerve cells. They act as catalyst for many biological reactions within the body, and the utilization of nutrient in food [1]. Thus, it is extremely crucial, for the consumer, to ensure that all factors affecting end product quality and composition are appropriate accessed
* Corresponding author: Dr. Milis Chrysostomos,
19 might be that too many factors are affecting inorganic element content in milk, such as breed [6], health [7], herd [3], feed [8], altitude [9], stage of lactation [10], milk yield, age of cows [11], season [12], bioavailability of each element in every food and even the type of forage conservation [13]. Presently water is not considered feed and official controls in EU are restricted to complete feed for ruminants (complementary feed and forages), excluding water quality and content. Nevertheless, water is the main constituent (87%) of milk. Drinking water effect on milk composition is neglected in animal studies although its importance has been recognized in human studies [14,15]. Recently Khan et al. [16] have reported the marginal effect of drinking water on production status of buffaloes, whilst Zhou et al. [17], in a cohort study, have reported a correlation between the inorganic element composition of water and that of milk. It is the first trial that direct effect of drinking water on milk synthesis is reported. Additionally, it has not been reported yet the mineral content of Greek milk pool and the effects of skimming process on end product composition. The general perception [18] is that the de fattening process doesn’t negatively affect inorganic elements’ content but it hasn’t been reported yet whether different manufactures and season plays any role on this issue [19]. Thus, the three most critical macro minerals for human nutrition Ca, P and Mg, as though as the four micro minerals Zn, Cu, Fe, Mn where upper limits in complete feed (without taking into account water) have been established, according to European legislation [20], were determined. According to Zambelin et al. [21], there is insufficient research work on the content of minerals in milk and dairy products, which is paradox as the milk may provide 10-20% of daily dietary intake of minerals in Europe.
2. Materials and methods
Thirty Holstein Friesian cows, with the same milk production (of the previous lactating period); parity (2nd and 3rd) and stage of lactation (middle lactation 3-4 months) where randomly allocated in to two equal groups and fed the same ration (Table 1; total mixed ration, TRM) but had access to different water supply; immediately after milking (outdoor), in a changeover design, with a period of
15 days, and a 10 days washout period. The animals were milked twice daily; the production was recorded at the 5 last days of each period, and milk samples (1% of every milking) where taken at 10th and 15th day of each period, and composed for every day.
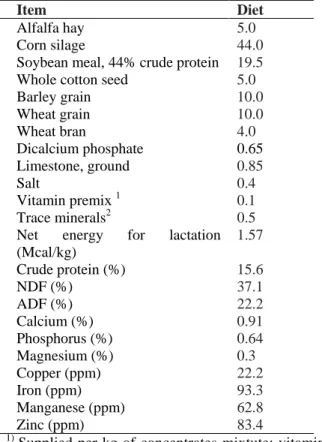
Table 1. Composition of lactating cows diet (%, as-fed basis)
Item Diet
Alfalfa hay 5.0
Corn silage 44.0
Soybean meal, 44% crude protein 19.5
Whole cotton seed 5.0
Barley grain 10.0
Wheat grain 10.0
Wheat bran 4.0
Dicalcium phosphate 0.65
Limestone, ground 0.85
Salt 0.4
Vitamin premix 1 0.1
Trace minerals2 0.5
Net energy for lactation (Mcal/kg)
1.57
Crude protein (%) 15.6
NDF (%) 37.1
ADF (%) 22.2
Calcium (%) 0.91
Phosphorus (%) 0.64
Magnesium (%) 0.3
Copper (ppm) 22.2
Iron (ppm) 93.3
Manganese (ppm) 62.8
Zinc (ppm) 83.4
1)
Supplied per kg of concentrates mixtute: vitamin A (acetate), 6,600 IU; vitamin D3 (cholecalciferol), 880
IU; vitamin E (DL-α tocopheryl acetate), 44 IU; vitamin K (as menadione sodium bisulfate complex), 15 IU.
2)
The inorganic trace minerals were added at a concentration to provide 100% of the NRC (2001) requirement estimates for Cu, Fe, Mn, and Zn. Cu (sulfate); Fe (sulfate); Mn (oxide); Zn (oxide).
Proximate chemical analysis
20 assayed without a heat stable amylase and expressed inclusive of residual ash. Additionally, ADF was expressed inclusive of residual ash.
Mineral analysis of water
Atomic absorption spectrophotometer (PerkinElmer 700 USA) was used to quantify the inorganic minerals in the water samples by using
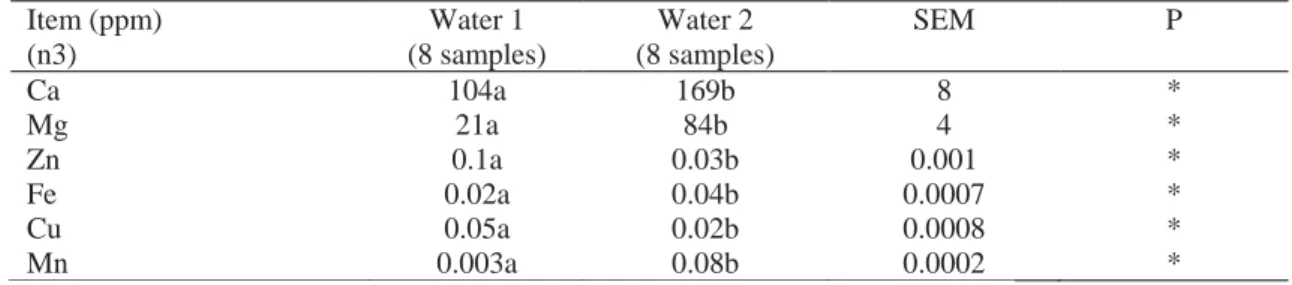
the method reported by [23]. The following elements were determined in water samples in (mg/l): Calcium (Ca); Magnesium (Mg); Iron (Fe); Zinc (Zn); Manganese (Mn); Copper (Cu). Water sampling and analysis was performed every 5 days (Table 2).
Table 2. Mean content of different water sources in essential minerals Item (ppm)
(n3)
Water 1 (8 samples)
Water 2 (8 samples)
SEM P
Ca 104a 169b 8 *
Mg 21a 84b 4 *
Zn 0.1a 0.03b 0.001 *
Fe 0.02a 0.04b 0.0007 *
Cu 0.05a 0.02b 0.0008 *
Mn 0.003a 0.08b 0.0002 *
a, b: Mean values with different letters in the same row significantly differ (P<0.05) n= number of independent samples analyzed for each sample
Sampling and Analysis of milk samples Sampling trial 1
Milk samples from each cow were taken at 10th and 15th day in every period (60 for every treatment). Milk samples for mineral analysis were refrigerated at 4 oC, for 1-2 days, until tested. Prior to analysis milk samples remained at room temperature for 5 minutes and the temperature was monitoring, whilst held on a milk stirrer [22; official method 925.21 about preparation of milk test samples]. A reduced sample of 2 ml was taken of each bottle by the use of a sterile syringe (equally; from the bottom, the middle and the top of milk bottles).
Sampling trial 2
Additionally, equal samples (40 for each treatment) were taken for 0, 1.5 and 3.5% in fat content from five manufacturers (covering the 90% of Greek milk pool), twice (at the middle of the first and third month) every season (totally 120 samples; 360 sub samples). The procedure proposed by AOAC [22; official method 968.12] was followed for sampling and transportation of milk samples.
Inorganic elements’ chemical analysis
Wet mineralization in a microwave Xmars oven (CEM Corporation Matthews, North Carolina USA) in the presence of a mixture of 6 ml nitric oxide 65% and 1 ml H2O2 30% (Merck; HPLC grade), in accordance with the relevant standards of the manufacturer, was applied to diet and milk samples prior to analysis. The elements Ca, Mg, Zn, Cu, Fe, Mn were determined by the use of
flame atomic absorption spectroscopy by the use of a Perkin Elmer AA analyst 700 (Perkin Elmer co., Waltham, Massachusetts USA) according to AOAC [22; official method 965.09 revised; for the determination of the micro elements Cu and Mn, two extra working solutions were used for building the standard curves; 0.1 ppm and 0.5 ppm] single element lamps were used for higher accuracy. P was determined by the use of a Perkin Elmer Lamda 25 UV-VIS reflectance spectrophotometer (Perkin Elmer Inc., Waltham, Massachusetts USA) according to [22; official method 965.17]. All measurements were made in triplicate and standards were included (CRM) in each run (according to ISO 17025). Certified standard solutions were used for standard curves (sigma-aldrich co.; certified analysis standard solution material 1000 μg ±1/ml for all the elements; for P reflects orthophosphate content). Ultraviolet extra pure water MilliQ instrument (Merck Inc., Darmstadt, Germany) was used for 0 curve point and for rinsing the instrument parts (plastics) that came in contact with a milk sample before each run.
Statistical analysis
21 from the model). In the second trial (repeated measures design) manufacturer, season and manufacturing process (fat removal) were set as fixed effects. The significance of differences between means was estimated by the Tukey’s range test at P < 0.05.
3. Results and discussion
Drinking water significantly affected Mg, Cu and Mn content (P<0.05). In opposite, the levels of Ca, P, Zn and Fe were not affected significantly by the
source of water (Table 3).
Table 3. Effect of water on mineral content of cows’ milk Item (ppm)
(n3)
Water 1 (60 samples)
Water 2 (60 samples)
SEM P
Milk yield 26.4 26.7 1.6 NS
Fat content 3.7 3.8 0.2 NS
Protein content 3.5 3.4 0.1 NS
Ca 967 955 55 NS
P 973 969 57 NS
Mg 114a 122b 7 *
Zn 4.3 4.1 0.23 NS
Fe 0.41 0.42 0.05 NS
Cu 0.32a 0.21b 0.03 *
Mn 0.062a 0.089b 0.0007 *
a, b: Mean values with different letters in the same row significantly differ (P<0.05) n= number of independent samples analyzed for each sample
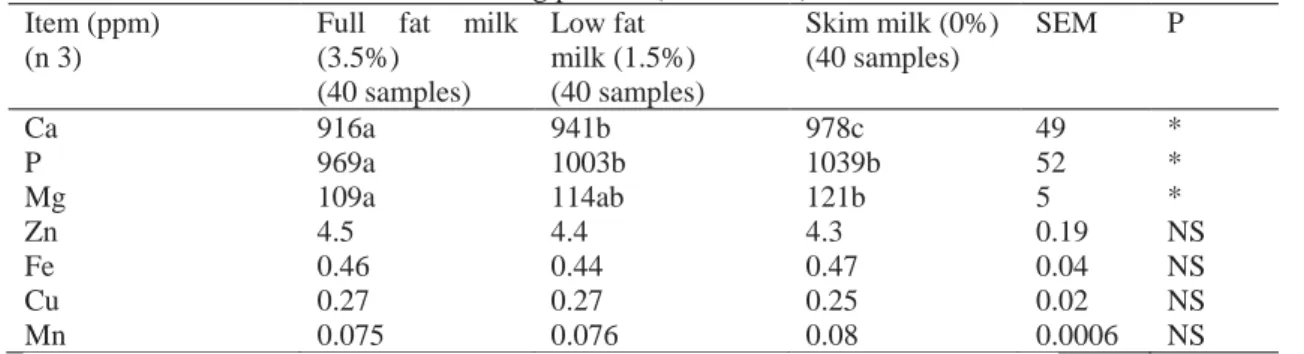
The 0% fat milk had higher content in Ca, P and Mg compared to 3.5%. Additionally, the 1.5% milk had higher Ca and P content compared to 3.5%, indicating that fat removal increases Ca, P
and Mg content, linearly (P<0.05). Manufacturing process did not affect Zn, Cu, Fe, and Mn content (Table 4).
Table 4. Effect of manufacturing process (fat removal) on mineral content of milk Item (ppm)
(n 3)
Full fat milk (3.5%)
(40 samples)
Low fat milk (1.5%) (40 samples)
Skim milk (0%) (40 samples)
SEM P
Ca 916a 941b 978c 49 *
P 969a 1003b 1039b 52 *
Mg 109a 114ab 121b 5 *
Zn 4.5 4.4 4.3 0.19 NS
Fe 0.46 0.44 0.47 0.04 NS
Cu 0.27 0.27 0.25 0.02 NS
Mn 0.075 0.076 0.08 0.0006 NS
a, b, c: Mean values with different letters in the same row significantly differ (P<0.05) n= number of independent samples analyzed for each sample
Minerals and trace elements contribute to the buffering capacity of milk, the maintenance of milk pH, the ionic strength of milk and milk’s osmotic pressure. Mean Ca content in present study was 916 mg L-1 which is somewhat below the normal range [25]. This could be attributed to the fact that milk yield of cows is increasing due to higher genetic potential and thus the content of macro elements tend to reduce [11]. Sikiric et al. [8] have reported that farms fed the same ration but different hay had large variations in Ca
22
increases the concentration of mineral nutrients [26]. This is probably happens because Ca is mostly distributed in the colloidal phase of the milk [27].
Mean P content in present study was 969 mg L-1
which in accordance with the values reported by Coulon et al. [13]. P is important for energy production, muscle contraction, bone health and many other biochemical reactions. Lately, there is increased awareness about environmental pollution caused by P excretion. Present study indicates that there is no meaning of increasing P levels above standard levels as its content is relatively stable in milk; whilst moderate changes in ingested P does not affect milk yield [28]. Manufacturing process affects P content at the same pattern as Ca (Table 4).
Mg content in water is positively correlated with Mg concentration in milk. Mg is a key player in energy metabolism, as it acts as an activator of many enzymatic reactions such as glycolysis, fat and protein metabolism, it is necessary for membrane stability and neuromuscular, cardiovascular, immune and hormonal functions. The average Mg content of Greek milk pool was 109 mg L-1 which is a very common value [29, 21]. Manufacturing process is affecting Mg content linearly where the lower fat content results in higher Mg content.
Average milk content in Zn was 4.5 mg L-1 which is higher compared with values reported by other researchers [1, 5] 3.5 mg L-1, but within the range of normal values [30]. Zn is required for the structure and activity of more than 300 enzymes, whilst adequate Zn intake is necessary for many physiologic systems as immunity, reproduction, taste etc [31]. Anyhow, according to present findings, Zn is not affected substantially by water source neither manufacturing process. The vast majority of values for Zn content in cow’s milk is between 3 – 5 mg L-1 [32] and in very rare cases values out of that range have been reported [33, 34]. Zn in milk is mostly bound to casein, but some is bound to lactoferrin [35]. These results confirm that Zn cannot be largely manipulated through nutrition which is in line with Flynn and Power [36].
Mean Fe content in present study was 0.46 mg L-1 which is lower compared to other reports [5] 0.78 mg L-1 but within the normal values [37]. It is well known that milk is lacking Fe which is an essential element for oxygenation of the body
tissues. Fe in milk is bound to lactoferrin, xanthine oxidase (an enzyme associated with the cell membrane) and some to caseins. Fe content was relatively constant and was not affected by the water source neither manufacturing process. According to present study, it seems that drinking water affects Cu content of milk (P<0.05). It has been reported that the transition element cations (Cu, Mn, Zn) have concentrations in blood, tissues and milk that are largely independent of the intake, as they relate to regulation of gut absorption and changing metabolic demands [38]. Probably, this is not the case for Cu as values ranged between 1.98-160 μg/l in cow’s milk have been reported [32].
Mean Cu content in present trial 270 μg L-1 was higher compared to previous reports [32], but at the same range with Sikiric et al. [8]. These differences can be attributed to the higher content of Cu in concentrates (premixtures) and the higher concentrate to forage ratio of the ration; fed to high producing ruminants. Accordingly, higher Cu content in cow’s milk during indoor period than during the outdoor grazing period has been reported by O’ Brien et al. [12]. Moreover, in countries where grazing is a common practice throughout the year such differences could not be detected [39].
Manufacturing process does not affect Cu content significantly. Cu is bound to the caseins, to b-lactoglobulin, lactoferrin and a small proportion to the milk fat membranes [21]. Nevertheless, milk is not a sufficient source of Cu as it contains negligible amounts, thus the increment of Cu content of milk through diet and water is desirable.
23 drinking water high in Mn [42]. In opposite, it has been reported that Mn in infant formulas during reconstitution could exceed maximum levels, with detrimental effects on infant health [43]. The EPA [44] water quality guidelines for human drinking water have a secondary standard maximum guideline of 0.05 ppm for Mn. Present findings supports the opinion that microelements absorption from water is higher in comparison with feed; and, additionally, the inorganic element content of drinking water is directly affecting milk synthesis. Average Mn levels were 75 μg L-1 which is higher in comparison with previous reports [1] 26-55 μg L-1 and [32] 20 μg L-1. Mn is a cofactor for a number of important enzymes. Mn has been rarely studied in cow’s milk and the factors affecting its content are not well known. Iyengar [45] stated that Mn concentrations in milk could be altered by dietary means. Extreme values ranged from 1.09 μg L-1 [34] till 65 μg L-1 [46] have been reported. Manufacturing process did not alter significantly milk content in Mn; even though this element is found to milk fat membranes [12]. Mn was the mineral with the lowest concentration in cow’s milk in present study.
The contents of three trace elements out of four tested, were higher compared to previous reports. This is probably revealing that higher concentrate to forage ratio fed to high producing ruminants, accompanied with sorter or without grazing period, compared to previous decade [47] increase micro mineral content of milk.
4. Conclusions
Drinking water is clearly affecting end product composition; thus upper limits in the ration should take into account drinking water source. Inorganic element content in the drinking water has never been taken into account in animal studies; whilst this is an extremely important factor especially at micro level. People consuming skim milk do not miss anything regarding inorganic element intake. Food tables reporting milk synthesis should be updated, as higher milk yields, over the time, have impact on inorganic element content of milk.
References
1.Vahčić, N., Hruškar, M., Marković, K., Banović, M., Barić, I. C., Essential minerals in milk and their daily
intake through milk consumption, Mljekarstvo, 2010. 60(2), 77.
2. National Research Council (US) Committee on Technological Options to Improve the Nutritional Attributes of Animal Products. Designing Foods: Animal Product Options in the Marketplace. Washington (DC): National Academies Press (US); (1988). Factors Affecting the Composition of Milk from Dairy Cows.
3. Van Hulzen, K.J.E., Sprong, R.C., van der Meer R., van Arendonk J.A.M., Genetic and nongenetic variation in concentration of selenium, calcium, potassium, zinc, magnesium, and phosphorus in milk of Dutch Holstein-Friesian cows, J. Dairy Sci., 2009, 92, 5754-5759.
4. Dobrzanski, Z., Kolacz, R., Górecka, H., Chojnacka, K., Bartkowiak, A., The content of microelements and trace elements in raw milk from cows in the Silesian region. Polish J. Environ. Studies, 2005, 14(5), 685. 5. Malbe, M., Otstavel, T., Kodis, I., Viitak, A., Content of selected micro and macro elements in dairy cows’ milk in Estonia. Agron. Res., 2010, 8(11), 323-326.
6. De Marchi, M., Bittante, G., Dal Zotto, R., Dalvit C., Cassandro, M. Effect of Holstein Friesian and Brown Swiss breeds on quality of milk and cheese, J. Dairy Sci., 2008, 91, 4092-4102.
7. Summer, A., Franceschi, P., Malacarne, M., Formaggioni, P., Tosi, F., Tedeschi, G., Mariani P., Influence of somatic cell count on mineral content and salt equilibria of milk. Italian J. Anim. Sci., 2009, 8, 435-437
8. Sikirić, M., Brajenović, N., Pavlović, I., Havranek, J.L., Plavljanić, N., Determination of metals in cow’s milk by flame atomic absorption spectrophotometry. Czech J. Anim. Sci., 2003, 48(11), 481-486.
9. Bartowska, J., Litwińczuk, Z., Król, J., Kedzierska-Matysek, M., Fatty acid profile and minerals content in milk from cows of various breeds over spring-summer feeding period. Polish J. Food Nutr. Sci., 2006, 15, (56), 13-16.
10. Toffanin, V., Penasa, M., McParland, S., Berry, D.P., Cassandro, M., De Marchi M., Genetic parameters for milk mineral content and acidity predicted by mid-infrared spectroscopy in Holstein-Friesan cows. Animal, 2015. 9, 775-780.
11. Nogalska, A., Momot, M., Sobczuk-Szul, M., Pogorzelska-Przybyłek, P., Nogalski, Z., Calcium and magnesium content in the milk of high-yielding cows. J. Elementology, 2017, 22(3), 809-815.
24
13. Coulon, J.B., Pradel, P., Verdier, I., Effect of forage conservation (hay or silage) on chemical composition of milk. Annals Zootechn., (Note) 1997, 46, 21-26. 14. Dieter, H.H., German drinking water regulations, pesticides, and axiom of concern. Environ. Management, 1992, 16(1), 21-31.
15. Rebelo, F.M., Caldas, E.D., Arsenic, lead, mercury and cadmium: toxicity, levels in breast milk and the risks for breastfed infants. Environ. Res., 2016, 151, 671-688.
16. Khan, R., Qureshi, M.S., Mushtaq, A., Ghufranullah, A., Naveed, A., Effect of quality and frequency of drinking water on productivity and fertility of dairy buffaloes. J. Anim. Plant Sci., 22(2 Suppl.): 2012, Page: 96-101.
17. Zhou, X., Qu, X., Zhao, S., Wang, J., Li, S., Zheng, N., Analysis of 22 elements in milk, feed, and water of dairy cow, goat, and buffalo from different regions of China. Biol. Trace Elem. Res., 2017, 176(1), 120-129.
18. USDA Food Composition Databases. 2016. United States Department of Agriculture. Agricultural Research Service. Nutrient Data Laboratory, Beltsville Human Nutrition Research Center.
19. Gulati, A., Galvin, N., Lewis, E., Hennessy, D., O'Donovan, M., McManus, J. J. & Guinee, T. P., Outdoor grazing of dairy cows on pasture versus indoor feeding on total mixed ration: Effects on gross composition and mineral content of milk during lactation. J. Dairy Sci., 2018 101(3), 2710-2723.
20. Commission Regulation (EC) No 1334/2003. Amending the conditions for authorisation of a number of additives in feedingstuffs belonging to the group of trace elements.
21. Zamberlin, Š., Antunac, N., Havranek, J., Samaržija, D., Mineral elements in milk and dairy products. Mljekarstvo, 2012, 62(2), 111-125.
22. AOAC, Association of Official Analytical Chemists., Official Methods of Analysis. 18th edn. AOAC (2005), Current through revision 1, (2006). Maryland.
23. Richardson, S. D., Water Analysis: Emerging contaminants and current issues. Anal. Chem., 2003, 75(12): 2831-2857.
24. Sas, S. A. S., & Guide, S. U. S. 2003. Version 9.1. SAS Institute Inc., Cary, NC.
25. Cashman, K.D., Milk minerals (including trace elements) and bone health. Int. Dairy Journal, 2006, 16(11), 1389-1398.
26. Closa, S.J., de Landeta, M.C., Andérica, D., Pighín, A., Cufré, J.A., Mineral nutrient content in cow milk and dairy products in Argentina. Arch. Latinoam. Nutr., 2003, 53(3), 320-324.
27. De la Fuente, M.A., Olano, A., Juarez, M., Distribution of calcium, magnesium, phosphorus, zinc, manganese, copper and iron between the soluble and colloidal phases of ewe's and goat's milk. Le Lait, 1997, 77(4), 515-520.
28. Wang, C., Liu, Z., Wang, D., Liu, J., Liu, H., Wu, Z., Effect of dietary phosphorus content on milk production and phosphorus excretion in dairy cows. J. Anim. Sci. Biotech., 2014, 5(1), 23.
29. Rodrıguez, E., Alaejos, M.S., Romero, C.D., Mineral concentrations in cow's milk from the Canary Island. J. Food Comp. Anal., 2001, 14(4), 419-430. 30. Casey, C.E., Smith, A., Zhang, P., Microminerals in Human and Animal Milks-C. 1995.
31. Lukaski, H.C., Vitamin and mineral status: effects on physical performance. Nutrition, 2004, 20(7), 632-644.
32. Pechová, A., Pavlata, L., Dvořák, R., Lokajová, E., Contents of Zn, Cu, Mn and Se in milk in relation to their concentrations in blood, milk yield and stage of lactation in dairy cattle. Acta Vet. Brno, 2008, 77(4), 523-531.
33. Licata, P., Trombetta, D., Cristani, M., Giofre, F., Martino, D., Calo, M., Naccari, F., Levels of “toxic” and “essential” metals in samples of bovine milk from various dairy farms in Calabria, Italy. Environ. Inter., 2004, 30(1), 1-6.
34. Hermansen, J.E., Badsberg, J.H., Kristensen, T., & Gundersen, V., Major and trace elements in organically or conventionally produced milk. J. Dairy Res., 2005, 72(03), 362-368.
35. Pabon, M. L., Lönnerdal, B., Bioavailability of zinc and its binding to casein in milks and formulas. J. Trace Elem. Med. Biol., 2000, 14(3), 146-153.
36. Flynn, A., Power, P., 1985.Nutritional aspects of minerals in bovine and human milks. In: Developments in Dairy Chemistry—3 (pp. 183-215). Springer Netherlands.
37. Meurant, G. 1995. Handbook of milk composition. Academic press.
38. Windisch, W., Interaction of chemical species with biological regulation of the metabolism of essential trace elements. Analytical and Bioanal. Chem., 2002, 372(3), 421-425.
39. Reykdal, O., Rabieh, S., Steingrimsdottir, L., Gunnlaugsdottir, H., Minerals and trace elements in Icelandic dairy products and meat. J. Food Comp. Anal., 2011, 24(7), 980-986.
40. National Research Council. NRC. 2001. Nutrient requirements of dairy cattle.
41. Johnson, P.E., Lykken, G.I., Korynta, E.D., Absorption and biological half-life in humans of intrinsic and extrinsic 54Mn tracers from foods of plant origin. J. Nutr., 1991, 121(5), 711-717.
42. Agency for toxic substances and disease registry; 2009. Centers for Disease Control and Prevention. (2011). Toxicological profile for nickel, 6.
25
44. Environmental Protection Agency. 2004. A Consolidated Emissions Modeling System for MOBILE6 and NONROAD, US Environmental Protection Agency, Office of Transportation and Air Quality, National Mobile Inventory Model (NMIM). 45. Iyengar, G.V. 1982. Elemental composition of human and animal milk. Vienna, International Atomic Energy Agency.
46. Zurera-Cosano, G., Moreno-Rojas, R., & Amaro-Lopez, M., Effect of processing on contents and
relationships of mineral elements of milk. Food Chemistry, 1994, 51(1), 75-78.