EARLY DIAGNOSIS OF NEUROLOGICAL DISEASE USING PEAK DEGENERATION AGES OF MULTIPLE BIOMARKERS1
BY FEIGAO, YUANJIAWANG ANDDONGLIN ZENG
University of Washington, Columbia University and University of North Carolina at Chapel Hill
Neurological diseases are due to the loss of structure or function of neu-rons that eventually leads to cognitive deficit, neuropsychiatric symptoms, and impaired activities of daily living. Identifying sensitive and specific bi-ological and clinical markers for early diagnosis allows recruiting patients into a clinical trial to test therapeutic intervention. However, many biomarker studies considered a single biomarker at one time that fails to provide pre-cise prediction for disease age at onset. In this paper, we use longitudinally collected measurements from multiple biomarkers and measurement error-corrected clinical diagnosis ages to identify which biomarkers and what fea-tures of biomarker trajectories are useful for early diagnosis. Specifically, we assume that the subject-specific biomarker trajectories depend on unob-served states of underlying latent variables with the conditional mean fol-lows a nonlinear sigmoid shape. We show that peak degeneration age of the biomarker trajectory is useful for early diagnosis. We propose an Expectation-Maximization (EM) algorithm to obtain the maximum likelihood estimates of all parameters and conduct extensive simulation studies to examine the per-formance of the proposed methods. Finally, we apply our methods to studies of Alzheimer’s disease and Huntington’s disease and identify a few important biomarkers that can be used for early diagnosis.
1. Introduction. Neurological diseases, such as Huntington’s disease (HD), Alzheimer’s disease (AD), and Parkinson’s disease, involve the loss of structure or function of neurons that eventually leads to cognitive deficit, motor impairment, neuropsychiatric symptoms, and impaired activities of daily living. There are cur-rently no disease-modifying treatments for these disorders since damaged neurons cannot be replaced or reproduced. The pathophysiological process of the diseases is thought to begin years before irremediable neuronal loss and cognitive deficits manifest (Sperling et al.(2011)). Therefore, early diagnosis offers an opportunity
Received May 2018; revised December 2018.
1Supported by NIH Grants NS082062, NS073671, GM124104. ADNI Data used in preparation of this article were obtained from the Alzheimer’s Disease Neuroimaging Initiative (ADNI) database (adni.loni.usc.edu). As such, the investigators within the ADNI contributed to the design and
im-plementationofADNIand/orprovideddatabutdidnotparticipateinanalysisorwritingofthis re-port. A complete listing of ADNI investigators can be found at: http://adni.loni.usc.edu/wp-content/ uploads/how_to_apply/ADNI_Acknowledgement_List.pdf.
for effective therapeutic intervention because the cognitive function might be pre-served at the highest level possible before irreversible damage has occurred.
To develop effective therapeutics, it is important to identify biomarkers with the most rapid change at the earliest age and also associated with clinical diagnosis. Many subtle clinical features and biomarkers of preclinical pathological change can potentially serve as early diagnostic or prognostic indicators. For example, prognostic biomarkers in the motor, imaging, and cognitive domains are suggested to be useful for predicting early motor or cognitive abnormalities in HD (Paulsen et al.(2014a)). For AD, various neurobiological measures, such as cerebrospinal fluid levels ofAβ42 and total tau protein, show preclinical alterations that predict development of early AD symptoms (Hampel et al.(2008)). However, all these findings are based on isolated analysis and it remains largely unknown which biomarkers manifest significant changes prior to disease onset and for how long before the onset.
To evaluate the relationship of changes in biomarkers and clinical diagnosis of AD,Hall et al.(2000,2001,2003) modeled longitudinal measurements of one or two biomarkers by change point polynomial mixed models, where the change point is associated with the age of clinical diagnosis that is assumed to be observed for all subjects. Later,Jacqmin-Gadda, Commenges and Dartigues(2006) extended the methods to jointly model measurements of a biomarker and right-censored age of clinical diagnosis. However, the change point only indicates the change of pattern of the biomarker over time and may not necessarily be the acceleration time of the biomarker change. Recently, an imputation-based analysis was used in Bateman et al. (2012). In this method, the biomarker measurements were first aligned by the age from the expected AD clinical diagnosis, and a cubic polynomial mixed effects model was used to model the biomarker trajectory retrospectively. The ear-liest time prior to the AD onset where a difference can be detected between mu-tation carriers and noncarriers and when the maximal difference is detected were considered as critical time points. There are several limitations with this analysis. First, participants (children of parents who had AD and carried mutations associ-ated with AD) were recruited before being diagnosed with AD, thus their onset ages were censored.Bateman et al.(2012) imputed participant’s AD age at onset using their parents’ age at onset since their approach does not handle censoring. This imputation may introduce inaccuracy into the analysis. Second, the analysis inBateman et al.(2012) did not model multiple biomarkers simultaneously.
To model both longitudinal measurements and disease onset, joint modeling approaches, including selection models and pattern mixture models (Little(1995),
the disease age at onset may be subject to measurement error, as commonly en-countered in the studies of neurodegenerative diseases (Garcia,MarderandWang
(2017)).
Inthispaper,wemodellongitudinalmeasurementsofmultiplebiomarkersand error-corrected clinical diagnosis age simultaneously. Our goal is to identify which biomarkers and what features of biomarker trajectories are useful for early diag-nosisandcharacterizationofdiseaseprogression.Specifically,tocapture nonlin-ear sigmoid shape of the biomarker degeneration as observed in empirical studies (Jacketal.(2010), Jedynaketal.(2012)), we assume that subject-specific
trajec-tories of biomarkers are related to latent states of underlying neuron masses. This assumptionismotivatedbyneuralmassmodels(Hopfield(1982)),whereneurons are considered as binary units in an active or inactive state and the population-level model of their activities is considered as aggregate activities of massive number of neurons. Furthermore, we allow biomarker-specific lead time between the disease onsetandthe peakdegenerationages ofthebiomarkers(inflectionpoints where the maximal change of biomarker occurs) to vary across biomarkers and allow in-flection points to depend on subject-specific covariates. We show that biomarker inflection points are useful for early diagnosis of neurological diseases. In addi-tion,sincebiomarkeratthepeakdegenerationageismostsensitivetochangeand easiest to be detected, inflection points indicate the optimal timing of intervention when designing clinical trials if the inflection point occurs prior to disease onset and closely monitoring is available. Furthermore, we show that the biomarker-specificleadtimeisanimportantfeaturetocharacterizediseaseprogression.
To accommodate measurement error of the clinical diagnosis age, we assume an additive measurement error model. To bypass a difficult nonlinear optimization in our modeling, an EM algorithm with explicit solutions in the M-step is developed for maximum likelihood estimation. We conduct simulation studies to examine the performance of the proposed estimators and show that Batemanetal.(2012)
approach to impute unobserved disease onset ages may lead to large bias in the biomarker trajectories and an increased variability in the estimation of parameters. Finally,weapplyourmethodstotwostudiesofneurodegenerative diseases(HD and AD), where we identify biomarkers with peak degeneration ages occurring significantly earlier than clinical disease onset so that they can potentially serve as early diagnostic markers.
2. Motivatingexamples.
2.1. HDand predictors of Huntington’s disease (PREDICT-HD) study. HD is an autosomal dominant neurodegenerative disease caused by an expansion of the cytosine-adenine-guanine (CAG) in the first exon of huntingtin (HTT) gene (MacDonaldetal.(1993)).Whereasunaffectedpersonshavearangeof6–35CAG repeats,personsaffectedwithHDhave36–121CAGrepeatslength(Kremeretal.
abilities and usually results in movement, cognitive and psychiatric impairments. Even though CAG repeats length and baseline age are recognized as important predictors of HD diagnosis, much effort is needed to refine the prediction of the age at motor onset.
The PREDICT-HD study is a prospective observational study of premanifest HD individuals who carry an expansion of CAG repeats (thus at risk of HD) but without a clinical diagnosis at the baseline (Paulsen et al. (2014b)). These presymptomatic, gene-positive individuals were recruited starting in 2002 and fol-lowed for up to 12 years. During the follow-up period, various longitudinal mea-sures in five domains (motor, cognitive, psychiatric, functional, and imaging) were collected. The onset of HD was determined by the motor symptoms evaluated on the Unified Huntington’s Disease Rating Scale (UHDRS) by a trained neurologist. A subject rated as 4 on the diagnostic confidence level (DCL) is diagnosed with HD. However, the presence of variation in patients’ motor symptoms and raters’ diagnosis has made clinical diagnosis difficult (Garcia, Marder and Wang(2017)): a patient could receive a DCL of 4 (diagnosed with HD) at one visit, but fail to reach a DCL of 4 at the next visit if the patient expresses less motor symptoms (free of HD diagnosis). In the PREDICT-HD study, 63 (4.6%) patients had such reversion of diagnosis. Therefore, the observed HD age at onset determined by a neurologist is an approximation of a patient’s true disease age at onset. Our pro-posed method will account for the random measurement errors in diagnosis age using a linear model with a known variance estimated from the incidences of dis-ease status change in the PREDICT-HD study.
2.2. AD and Alzheimer’s disease neuroimaging initiative (ADNI) study. AD is an irreversible neurodegenerative disease that results in a loss of cognitive func-tion due to the deteriorafunc-tion of brain neuronal synapses. The progression of AD has been divided into three phases. The first phase is a pre-symptomatic phase where individuals are cognitively normal but some have AD pathological changes. The second prodromal phase, often referred to as mild cognitive impairment (MCI), is characterized by the onset of the earliest cognitive symptoms that do not meet the criteria for dementia. The final phase in the evolution of AD is dementia, defined as impairments in multiple domains that are severe enough to produce loss of func-tion. To determine the sequence of pathological changes of AD, a sigmoid model was proposed and widely used for major AD biomarkers (Jack et al.(2010)). Al-though some agreement between the temporal ordering of major biological cascade has been reached, there is no method to precisely estimate the lead time between when the peak biomarker degeneration occurs (inflection point) and dementia di-agnosis, accounting for censoring and error in dementia diagnosis.
positron emission tomography (PET), other biological markers, and clinical and neuropsychological assessment can be combined tomeasure the progressionof mild cognitive impairment (MCI) and early AD. In three phases of the study (ADNI1, ADNI GO, and ADNI2), early mild cognitive impairment (EMCI), MCI, mildAD,andnormalcontrolsubjectswererecruited.Biomarkers,suchasbrain scans, genetic profiles, and biomarkers in blood and cerebrospinal fluid were col-lected to track the progression of the disease. MCI was determined if the subject hasMini-MentalStateExam(MMSE)scorebetween24–30,amemorycomplaint, objective memory loss measured by education adjusted scores on Wechsler Mem-oryScaleLogicalMemoryII,aClinicalDementiaRating(CDR)of0.5,absenceof significant levels of impairment in other cognitive domains, essentially preserved activities of daily living, and an absence of dementia. Dementia was determined if the subject has MMSE score between 20–26, CDR of 0.5 or 1.0, and meets NINCDS/ADRDA (National Institute of Neurological and Communicative Disor-ders and Stroke and the Alzheimer’s Disease and Related DisorDisor-ders Association) criteriaforprobablyAD.
Similar to HD, random variations of the clinical diagnosis of MCI and demen-tiawereobserved.Sourcesofthevariationsincludenormalagingindependentof AD,“cognitivereserve”duetoeducation-linkedfactors,anddiseaseheterogeneity (Nelsonetal.(2012)). In the ADNI study, 75 (4.3%) patients had received a
diag-nosisofMCIorADatonevisit,butwasthendiagnosedasnormalatthenextvisit. Similarly to the PREDICT-HD study, the known variance in the measurement er-ror model can be estimated using the observations of disease status change in the ADNIstudy.
3. Method.
3.1. Latentsuppressionstatemodelforprogressionmarkers. We consider K
neurological disease markers measured over time from n independent subjects.
For subject i, we let Yik(t) be the measurement from the kth marker at age t for k=1, . . . , K and let Wi denote the underlying unobserved true disease age at onset.Additionally, we let Zi denotea vector ofbaseline covariates for sub-ject i. Our first model is to assume that in the population the disease onset follows Wi∼N (θTXi, σW2), where Xi =(1,ZiT)T. Given Wi and Zi, our models for K disease markers are motivated by the neural mass models in Hopfield(1982).
Specifically, we assume that markerYik(t)reflects the activity levels of neuron mass at agetand such levels further depend on the latent suppression status as sug-gested in the neural mass model. The suppression status of the neuron mass may be permanent or instantaneous, where the former most likely associates with suscep-tibility to neurodegeneration and the latter most likely associates with progression of neurodegeneration. Let Qik indicate the presence of the permanent suppres-sion of the neuron mass (for instance, due to genetic mutation, neuronal injury, or nerve damage) and letHik(t)indicate the instantaneous suppression at aget (for instance, due to neurofibrillary tangles). When subject i has no permanent sup-pression (i.e., Qik=0), or does not experience any instantaneous suppression at aget(i.e.,Hik(t)=0), we assume a linear declination trend due to normal aging process as suggested inFjell et al.(2009). That is, whenQik =0 orHik(t)=0, we assume a linear mixed effects model forYik(t):
Yik(t)=α0k+βkt+νik+ik(t),
whereνik is the subject- and marker-specific random intercept following a mean-zero normal distribution with unknown varianceσkν2 , and ik(t) is a white noise process with varianceσk2 . When suppression is present at aget, either due to the permanent suppression (i.e., Qik =1) or the instantaneous suppression at age t (i.e., Qik =0, Hik(t)=1), a further reduction in Yik(t) occurs due to disease degenerative process (Fjell et al. (2009)). Thus, we assume that the marker level at age t is further reduced by a subject-specific value, αT1kXi. In other words, depending on the latent suppression states, our progression model assumes
Yik(t)=α0k+αT1kXi
Qik+(1−Qik)Hik(t)
+βkt+νik+ik(t) fork=1, . . . , K.
To model the distribution ofQik andHik(t), we first assume thatQik is inde-pendent ofWi and satisfies the following logistic regression model:
logit Pr(Qik=1|Xi)=ηTkXi.
Since the instantaneous suppression is most relevant to the disease progression, we letHik(t)depend on disease age at onsetWi through
PrHik(t)=1|Qik=0, Wi
= 1
1+exp{−bk(t−μk−Wi)}
,
if μk>0, the inflection point age is afterWi, so the marker degeneration peaks after the disease onset, suggesting that this marker may be more likely to manifest a post-disease onset effect. Clearly,|μk|gives a magnitude of the lead time or lag time. For the purpose of early diagnosis, we aim to identify the progression marker withμk<0 and estimate the magnitude of|μk|to inform clinical trial design and recruitment.
REMARK 3.1. From the proposed latent state models, the conditional mean for the progression markerYik(t)givenWibut marginalized overQik andHik(t) is given by
α0k+
αT1kXi 1+exp(ηTkXi)
expηTkXi
+ 1
1+exp{−bk(t−Wi−μk)}
+βkt.
Thus, the smoothed trend of the marker measurementYik(t)is a sigmoid function with a linear drift over age. The peak degeneration age,ti∗=μk+Wi, coincides with the inflection point of the smoothed marker trajectory, which is the age of the maximal deterioration of the trajectory. Therefore, by monitoring the marker val-ues withμk<0 and identifying the peak age of deterioration, one can make early diagnosis with|μk|time units ahead of the disease onset in individuals. Note that existing literature suggests that many neurological biomarkers manifest a nonlin-ear sigmoid shape (Jack et al.(2010),Jedynak et al.(2012),Samtani et al.(2012),
Paulsen et al.(2014a)), which is consistent with our model ofYik(t)givenWi.
3.2. Likelihood-based estimation and inference. In our applications of HD and AD studies, the biomarkers are collected longitudinally at discrete time points and some biomarkers may not be measured at the same time as the oth-ers. We assume that for i=1, . . . , n, biomarker k (k=1, . . . , K) is measured at {ti1k, . . . , ti,nik,k}, where nik is the number of measurements. We use Yij k for
Yik(tij k). Another complication commonly encountered in the studies of neuro-logical diseases is that the disease diagnosis relies on clinical assessments which are known to be imprecise. Therefore, the clinically diagnosed age at onset, de-noted byTi, is the true age at onset measured with error. Particularly, we assume that the measurement errorδiis additive and normally distributed with known con-stant varianceσδ2 that can be determined a priori using observed data of clinical diagnosis or from existing literature, that is,
Ti=Wi+δi, δi∼N
0, σδ2.
Additionally, we assume thatTi is subject to right censoring due to the end of the study or patient’s loss of follow-up. LetCi denote the censoring age, such that we observeYi≡min(Ti, Ci)andi≡I (Ti≤Ci). The observed data from subjecti consist of
Letφ(·;σ2)and(·;σ2)denote the density function and cumulative distribu-tion funcdistribu-tion of N (0, σ2), respectively. Write αk =(α0k,α1k). Define gij k(Wi;
μk, bk)=exp{−bk(tij k−Wi−μk)},
Mij k=Yij k−α0k−βktij k,
Aij k
νik;αk, σk2
=φMij k−νik−α1TkXi;σk2
,
Bij k
νik;α0k, σk2
=φMij k−νik;σk2
and
Dij k
νik, Wi;μk, bk,αk, σk2
= gij k(Wi;μk, bk)Bij k(νik;α0k, σk2)+Aij k(νik;αk, σk2) 1+gij k(Wi;μk, bk)
.
Assuming thatCi is independent ofTi,Wi, andYij k givenZi, the observed-data likelihood function concerning the parameters (αk, βk, σkν2 , σk2,ηk, μk, bk) (k= 1, . . . , K) and(θ, σW2)is given by
Ln= n
i=1
Wi K
k=1 qk
Wi;ηk, μk, bk,αk, σk2, σkν2
hi
Wi;σW2, σδ2
dWi,
where
qk
Wi;ηk, μk, bk,αk, σk2, σkν2
=
νik
expηTkXi nik
j=1 Aij k
νik;αk, σk2
+ nik
j=1 Dij k
νik, Wi;μk, bk,αk, σk2
/1+expηTkXi
×φνik;σkν2
dνik
and
hi
Wi;σW2, σδ2
=φWi−θTZi;σW2
φYi−Wi;σδ2
iW
i−Yi;σδ2 1−i.
We propose to maximize the likelihood function for parameter estimation. To compute the maximum likelihood estimates, we apply an EM algorithm treating
Qik,νik,Hi1k, . . . , Hi,nik,k, andWi (i=1, . . . , n;k=1, . . . , K) as missing data, whereHij k=Hik(tij k). The details of the EM algorithm are described in the Ap-pendixA.
3.3. Earlydiagnosis ofdisease onset. Given the fitted model, the identified biomarkers with peak degeneration ages occurring before the disease onset can be used for disease monitoring and contribute to early diagnosis. In addition, we are able to predict the precise disease age at onset given observations of biomarkers. For a future subjectwho hasnot been diagnosed at age t with biomarker mea-surements Yk ≡(Y1k, . . . , Ynk,k) (k=1, . . . , K) measured at t1k, . . . , tnk,k prior to age t, the disease age at onset can be predicted given the biomarkers and the
diagnosis information. That is, we predict the disease age at onset W by the
poste-riormeanofW giventhebiomarkermeasurementsandthediagnosisinformation,
E(W|Y1, . . . ,YK, T ≥t), which is given by
wψ (w) dw,
whereψ (w)is the posterior density function of the disease age at onsetW that is given by
φ(w−θTZ;σW2)(w−t;σδ2)Kk=1qk(w;ηk, μk, bk,αk, σk2, σkν2 )
φ(W −θTZ;σW2)(W−t;σδ2)Kk=1qk(W;ηk, μk, bk,αk, σk2, σkν2) dW
,
and the integral can be evaluated by numeric integration with Gauss–Hermite quadratures.
4. Simulations. We conducted simulation studies to examine the perfor-mance of the proposed methods. A detailed description of the simulation pro-tocol is given in Section S.2 of the Supplementary Material. We considered
K=2 biomarkers and generated two independent covariates Zi1∼N (0,1)and Zi2∼Bernoulli(0.5) for i=1, . . . , n. We generated the censoring age Ci from Uniform[0,10]. For each biomarker k and each subject i, we randomly chose
nik from {3, . . . ,10} with equal probabilities and randomly generated tij k (j = 1, . . . , nik) independently from Uniform[0, Ci].
We generated the data from the proposed models, with the values of the param-eters given in the second column of Table1andσδ2=0.2. The censoring rate is about 30%. We setn=200 or 400 and used 1000 replicates. The algorithm was regarded as converged if the maximum of the norms of the parameter differences in adjacent iterations is smaller than 0.001. For each simulated dataset, 100 boot-strapped datasets were used for variance estimation.
TABLE1
Summarystatisticsfortheproposedestimatorsinsimulations
n=200 n=400
True
Parameter value Bias SE SEE CP Bias SE SEE CP
α01 0.4 −0.016 0.115 0.122 0.958 0.004 0.086 0.083 0.944
α02 0.6 0.005 0.106 0.107 0.945 0.000 0.076 0.072 0.928
α11 1.0 0.020 0.123 0.130 0.957 −0.003 0.089 0.090 0.944 0.8 −0.005 0.059 0.062 0.956 −0.002 0.043 0.043 0.945 0.7 −0.006 0.114 0.118 0.954 0.003 0.083 0.082 0.939
α12 1.0 0.004 0.125 0.127 0.947 −0.004 0.089 0.088 0.933 1.2 −0.001 0.063 0.064 0.943 −0.001 0.046 0.044 0.933 0.8 0.003 0.121 0.125 0.958 0.000 0.084 0.087 0.947
β1 0.8 0.001 0.017 0.017 0.950 0.000 0.012 0.012 0.953
β2 −0.4 0.001 0.014 0.014 0.951 0.000 0.010 0.010 0.958
σ12 0.5 −0.005 0.031 0.031 0.950 0.000 0.021 0.022 0.956
σ22 0.5 −0.003 0.025 0.026 0.957 −0.001 0.018 0.018 0.949
σ12ν 0.5 −0.009 0.066 0.067 0.956 −0.005 0.048 0.047 0.945
σ22ν 0.5 −0.014 0.070 0.067 0.933 −0.005 0.049 0.048 0.944
η1 −0.5 0.006 0.628 0.751 0.989 −0.014 0.423 0.442 0.974 0.5 0.004 0.383 0.459 0.989 −0.003 0.259 0.266 0.967 0.0 −0.012 0.550 0.642 0.990 0.018 0.393 0.395 0.958
η2 0.0 −0.011 0.462 0.483 0.979 −0.001 0.300 0.304 0.970
−0.5 −0.021 0.298 0.320 0.985 −0.001 0.198 0.196 0.966 0.5 0.000 0.489 0.509 0.971 0.009 0.330 0.329 0.956
μ1 −1.0 0.003 0.416 0.431 0.972 −0.002 0.290 0.292 0.951
μ2 1.6 −0.030 0.466 0.455 0.948 0.001 0.292 0.316 0.969
b1 −0.5 −0.006 0.115 0.116 0.962 −0.003 0.074 0.075 0.954
b2 0.5 0.006 0.088 0.090 0.964 0.001 0.056 0.061 0.962
θ 3.0 0.001 0.071 0.072 0.953 0.002 0.052 0.051 0.942
−0.2 0.000 0.052 0.052 0.946 −0.001 0.037 0.036 0.938 0.2 0.001 0.099 0.103 0.953 −0.002 0.074 0.073 0.946
σW2 0.2 −0.010 0.047 0.044 0.943 −0.008 0.033 0.031 0.942
but it gets more accurate as sample size increases. The confidence intervals have satisfactory coverage probabilities when the sample size is large (n=400).
TABLE2
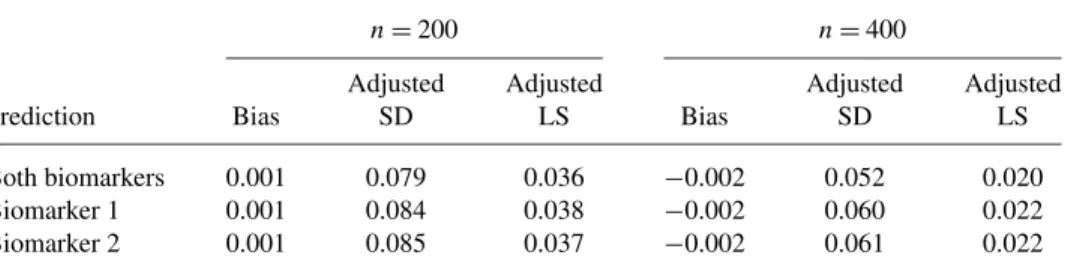
Summary statistics on prediction in simulations
n=200 n=400
Adjusted Adjusted Adjusted Adjusted
Prediction Bias SD LS Bias SD LS
Both biomarkers 0.001 0.079 0.036 −0.002 0.052 0.020 Biomarker 1 0.001 0.084 0.038 −0.002 0.060 0.022 Biomarker 2 0.001 0.085 0.037 −0.002 0.061 0.022
the predictive density function evaluated at the true disease onset age, such that a smaller value indicates a better fit. We compared the results with the proposed models with both biomarkers and one biomarker only.
Table2shows the mean prediction error, adjusted standard deviation (adjusted SD), and the mean adjusted logarithmic score (adjusted LS), where the adjusted SD is calculated as the squared root of mean squared prediction error minus the in-trinsic prediction error variability that is estimated as the mean squared prediction error using the conditional mean of the disease age at onset given the diagnosis, and the adjusted LS is calculated as the logarithmic score minus that from the two-biomarker model with the true parameter values. The biases from all models are small. The adjusted SD and adjusted LS decrease asnincreases. The adjusted LS based on both biomarkers is lower than those based on the models with one biomarker. Compared to those from the models with one biomarker only, the pre-diction based on both biomarkers has smaller variability: forn=400, the improve-ment in prediction efficiency of using both biomarkers is about 15%.
5. Applications.
We included 1073 gene-positive subjects with more than 35 CAG repeats at huntingtingene in the analysis. During the follow-up, 225 (21%) subjects devel-oped HD and the age at disease onset is defined as the age of the first observation with DCL=4. For each marker, on average more than three measurements are available for each subject. We estimated the magnitude of measurement errorσδ2
of HD diagnosis from the PREDICT-HD study. In particular, we fitted the adjacent observations with status change (from DCL<4 to DCL=4, or reverse) by a gen-eralized linear model to obtainσδ2=0.324. The details of the estimation procedure are given in Section S.3 of the Supplementary Material.
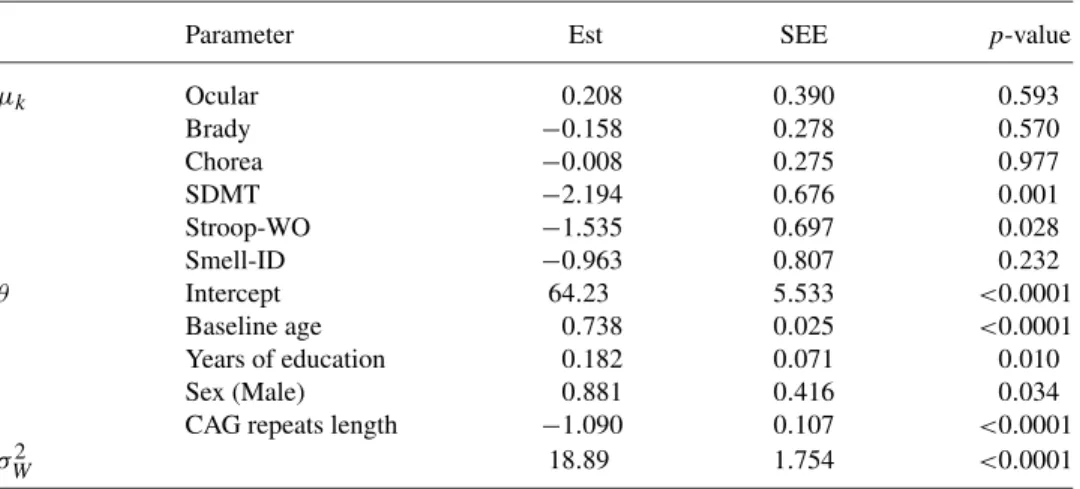
Table3shows the estimation results for various parameters associated with the peak degeneration ages and HD age at onset, where 1000 bootstrap samples were used for variance estimation. Male subjects have later HD age at onset than fe-males. Longer years of education and shorter CAG repeats length are associated with later HD age at onset. The inflection of the three motor measures occur close to HD age at onset, with the 95% confidence intervals of the lead times containing zero. These results are expected since the motor scores measure a patient’s motor symptoms and HD diagnosis is also mainly based on motor function. In addition, this finding is also consistent with the existing literature suggesting that subtle mo-tor abnormalities accelerate just prior to diagnosis (Long et al.(2014)). The symbol digit modalities and stroop word cognitive tests, which have respective lead times approximately 2 and 1.5 years before HD onset and significantly earlier than HD onset, can be candidate markers for early detection of HD diagnosis.
Next, we examined the differences of biomarker values and peak degenera-tion ages among subgroups of subjects. Figure 1 shows the average estimated biomarker values among the subgroups of subjects with different CAG repeats length. Subjects with a longer CAG expansion are associated with an earlier HD
TABLE3
Estimation results for selected parameters in the PREDICT-HD study
Parameter Est SEE p-value
μk Ocular 0.208 0.390 0.593
Brady −0.158 0.278 0.570
Chorea −0.008 0.275 0.977
SDMT −2.194 0.676 0.001
Stroop-WO −1.535 0.697 0.028
Smell-ID −0.963 0.807 0.232
θ Intercept 64.23 5.533 <0.0001
Baseline age 0.738 0.025 <0.0001 Years of education 0.182 0.071 0.010
Sex (Male) 0.881 0.416 0.034
CAG repeats length −1.090 0.107 <0.0001
FIG. 1. Average estimated values of biomarkers over age among subgroups of subjects with dif-ferent lengths of CAG expansion.The black solid,red dashed,and blue dotted curves pertain to the subgroups of subjects with CAG expansion<41, 41≤CAG expansion<43,and CAG expansion≥ 43,respectively.The circles and bars indicate the average inflection points and their95% confidence intervals.The dashed vertical lines indicate the average HD age at onset.SDMT and Stroop-WO are identified as prognostic biomarkers using the proposed approach.
age at onset and an earlier peak degeneration age for all considered biomarkers. In particular, subjects with CAG expansion< 41, 41≤ CAG expansion<43, and CAG expansion≥43 have peak degeneration ages of symbol digit modalities test at approximate 57, 50, and 41 years old, respectively, with corresponding scores 46, 44, and 42. Those subjects have peak degeneration ages of stroop word cog-nitive test at approximate 58, 51, and 42 years old, with corresponding scores 90, 86, and 84.
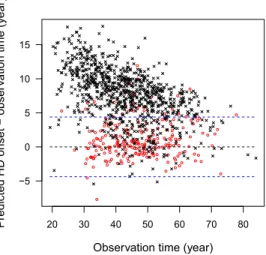
Finally, we examined the performance of the proposed methods on the predic-tion of HD age at onset given the biomarker measurements. Figure2presents the difference of the predicted HD age at onset and the observation age for each in-dividual. For the noncensored subjects, the difference between the predicted and observed HD age at onset is within the measurement variability ofTi (within the distance of
σδ2+σW2). For the censored subjects, most of the predicted HD age at onset is beyond the lower limit of the censoring age considering variability of the
disease age at onset (i.e., beyond censoring age minus
FIG. 2. Difference of the predicted HD age at onset and the observation age versus the observa-tion age in the PREDICT-HD study.The red circles and black crosses pertain,respectively,to the uncensored and censored subjects.The blue dashed lines indicate variability±
σδ2+σW2.
5.2. AD and ADNI study. We applied the proposed methods to the aforemen-tioned ADNI study. We analyzed the combined MCI and AD as a composite event, which serves as an alternative definition of early AD as suggested byDubois et al.
(2007). We considered four markers: the Montreal Cognitive Assessment (MOCA) that assesses several cognitive domains; the Clinical Dementia Rating Sum of Boxes (CDRSB) that measures the staging severity of dementia; the Functional Activities Questionnaire (FAQ) that serves as a screening tool for evaluating activ-ities of daily living; and theAβ42protein level (ABETA) measured from the cere-brospinal fluid. We associated the markers and early AD age at onset to baseline age, gender, education, number of APOE4 alleles, baseline Alzheimer’s Disease Assessment Scale 11 terms total scores (TOTAL11), and baseline FAQ.
We included 414 subjects who were cognitively normal at the baseline, out of whom 87 (21.0%) subjects developed early AD during the follow-up. For each marker, more than two measurements are available for each subject. We estimated the magnitude of the measurement error using the generalized linear model as described in Section S. 3 in the Supplementary Material to obtainσδ2=1.47.
TABLE4
Estimation results for selected parameters in the ADNI study
Parameter Est SEE p-value
μk MOCA 1.622 0.470 0.0006
FAQ 1.558 0.287 <0.0001
CDRSB 1.488 0.255 <0.0001
ABETA −12.09 2.973 <0.0001
θ Intercept 13.14 4.795 0.006
Baseline age 0.956 0.061 <0.0001
Gender −0.310 0.570 0.587
Education 0.136 0.118 0.248
APOE4 allele −1.339 0.511 0.009 Baseline Total11 −0.357 0.087 <0.0001 Baseline FAQ −1.233 0.326 0.0002
σW2 13.58 2.028 <0.0001
cascade occurring before the appearance of clinical symptoms (Jack et al.(2010),
Bateman et al.(2012)). The estimated lag times also have implications on clinical trials design. The peak acceleration of MOCA, FAQ, and CDRSB occurs within about 1.5 years after diagnosis. A clinical trial designed to test changes in these measures in response to a therapy may recruit newly diagnosed MCI or AD pa-tients within about 1.5 years to improve power.
Figure3shows the average estimated biomarker values among carriers and non-carriers of APOE4 alleles. Carriers are associated with a younger age at onset and an earlier peak degeneration age for all considered biomarkers. In particular, carriers and noncarriers have a peak ABETA acceleration at approximate 74 and 76 years of age, respectively. Early AD onset occurs approximately at 82 and 84 years for the two groups. The corresponding Aβ42 cutoff values are 143 and 183 pg/mL, which are slightly lower than the recommended threshold for using Aβ42to define AD in Shaw et al. (2009) (Aβ42<192 pg/mL defined as AD, estimated as the value that maximizes the area under the receiver operating characteristic curve for the detection of AD). However, since the diagnostic test based on this threshold has a relatively high sensitivity (96.4%) and low specificity (76.9%), the reported cutoff inShaw et al.(2009) may be anti-conservative.
FIG. 3. Average estimated values of biological and clinical markers over age among carriers and noncarriers of APOE4alleles.The black solid and red dashed curves pertain to the subgroups of APOE carriers and noncarriers,respectively.The circles and bars indicate the average inflection points and their95% confidence intervals.The dashed vertical lines indicate the average early AD onset ages.Aβ42is identified as a prognostic biomarker and MOCA,FAQ,and CDRSB are confirmed as diagnostic markers.
show the average estimated values of biomarkers with censored onset ages re-placed by imputation as in Bateman et al.(2012), where the black curves show our proposed approach that handles censoring appropriately. The horizontal axis is anchored at the estimated age at onset of early AD (years to onset of early AD). For both scenarios of correlation, imputing censored ages at onset leads to a large bias of the trajectories of biomarkers, and the estimated biomarker lead times can be shifted.
FIG. 4. Average estimated values of biological and clinical markers over centralized age(years to age at onset of early AD).The black solid curves pertain to the proposed approach with the observed data.The circles and bars indicate the population average peak degeneration ages and their 95% confidence intervals.The red dashed and blue dotted curves pertain,respectively,to imputing censored age at early AD by parent’s AD age at onset with a correlation of0.3or0.65between child’s and parent’s onset ages.
the evaluation of conditional expectation for the latent variables conducted using Gaussian quadratures. The numerical integration is at most two-dimensional, even if a large number of biomarkers are included.
For the asymptotic theory to hold, we require at least two measurements per biomarker for each subject. Empirically, we found that two measurements per biomarker for each subject provided stable estimation results forn=400 (99.5% of the simulated datasets converged in simulated settings). This requirement on the number of measurements usually holds for neurological disease studies with relatively closely monitoring, as for the PREDICT-HD and ADNI studies.
age that is consistent with empirical observations and existing literature. In addi-tion, we assume that measurement error for the disease onset age is normal dis-tributed with known variance. In practice, some of these parametric assumptions may be violated and further investigation may be needed to study the performance of the proposed methods under mis-specified models.
In the PREDICT-HD study, we visualize the fit of the proposed model through comparing the predicted HD age at onset with the observation age graphically. We also examine the goodness of fit for the model of the biomarkers by plotting the residuals of the biomarker measurements against the ages at measurements (Rizopoulos(2012), Chapter 6) in Figures S.1 and S.2 in the Supplementary Ma-terial. The proposed model is regarded as adequate since the predicted HD age at onset is consistent with the observation age, allowing for the existence of mea-surement errors, and the residuals are approximately randomly dispersed. A better model checking procedure may be developed to assess the goodness of fit of the proposed model.
In the ADNI study, we examined the performance of the imputation analyses in Bateman et al. (2012). Since the disease onset ages were observed in non-censored subjects, imputation was only applied to approximate disease onset for right-censored subjects. Even if the mean of the early AD age at onset was cor-rectly specified, the trajectories of biomarkers were estimated with bias, and the inflection points were shifted (especially for Aβ42). Our proposed methods make use of the observed diagnosis ages in noncensored subjects, appropriately handle censoring for those who were not diagnosed, and yield biomarker trajectories and peak degeneration ages with better accuracy and precision than Bateman et al.
(2012).
The proposed approach, which assumes a normal distribution for the disease age at onset, can be extended to accommodate other parametric distributions, semi-parametric distributions, or nonsemi-parametric distributions. For example, a propor-tional hazards model may be assumed for the age of disease onset. In addition, we may extend the proposed approach to accommodate interval-censored disease age at onset.
APPENDIX A: DETAILS OF THE EM ALGORITHM
DenoteRij k=Qik+(1−Qik)Hij k. The complete-data log-likelihood concern-ing the parameters is given by
n
i=1
logφWi−θTZi;σW2
+ilogφYi−Wi;σδ2
+(1−i)
×logWi−Yi;σδ2
+ K
k=1
nik
j=1
logφMij k−νik−αT1kXiRij k;σk2
+logφνik;σkν2
+QikηTkXi−log
1+eηTkXi+(1−Q ik)
× nik
j=1
(1−Hij k)bk(Wi+μk−tij k)−log
1+ebk(Wi+μk−tij k)
.
Since the complete-data log-likelihood can be factorized into pieces concerning disjoint subsets of parameters, we obtain the estimates for subsets of the parame-ters separately in the M-step. Specifically, we update(αk, βk)by
⎧ ⎪ ⎪ ⎨ ⎪ ⎪ ⎩ n
i=1
nik
j=1
⎛ ⎜ ⎜ ⎝
1 E(R ij k)XTi tij k
E(Rij k)Xi E(R ij k)XiXTi E(R ij k)tij kXi
tij k E(R ij k)tij kXTi tij k2 ⎞ ⎟ ⎟ ⎠ ⎫ ⎪ ⎪ ⎬ ⎪ ⎪ ⎭ −1 × n
i=1
nik
j=1
⎛ ⎜ ⎝
Yij k−E(ν ik)
Yij kE(R ij k)−E(ν ikRij k)
Xi
Yij k−E(ν ik)
tij k
⎞ ⎟ ⎠,
where E( ·) is the conditional expectation with respect to the observed data. We updateσk2 by
1 #n
i=1nik n
i=1
nik
j=1
Mij k2 −2Mij kE(ν ik)+E
νik2
+αT1kXi
αT1kXi−2Mij k E(Rij k)+2αT1kXiE(ν ikRij k)
and updateσkν2 by#ni=1E(ν ik2)/n. We updateηk by solving the equation n
i=1
$
E(Qik)−
exp(ηTkXi) 1+exp(ηTkXi)
% Xi=0
and updateμ∗k≡μkbkandbk by solving the equations
n
i=1
E
&nik
j=1
(1−Rik)−(1−Qik) nik
j=1
$
gij k(Wi;μk, bk) 1+gij k(Wi;μk, bk)
%'
and
n
i=1
E
&nik
j=1
(Wi−tij k)(1−Rij k)
−(1−Qik) nik
j=1
(Wi−tij k) $
gij k(Wi;μk, bk) 1+gij k(Wi;μk, bk)
%'
=0.
We updateθ by(#ni=1XiXTi)−1#ni=1XiE(W i), and updateσW2 by
n−1
n
i=1
EWi2−2E(W i)θTXi+
θTXi 2
.
In the E-step, we evaluate the conditional expectations of E(R ij k), E(ν ik),
E(νik2),E(ν ikRij k),E(Q ik),E(W i),E(W i2),E{(Wi−tij k)(1−Rij k)}, and
E
&
(1−Qik) nik
j=1
(Wi−tij k)m1
gij k(Wi;μk, bk) {1+gij k(Wi;μk, bk)}m2
'
given the observed dataOi form1=0,1,2 andm2=1,2. Specifically, the condi-tional expectation ofQik givenνik andWi is given by
exp(ηTkXi)jn=ik1Aij k(νik;αk, σk2)
exp(ηTkXi)jn=ik1Aij k(νik;αk, σk2)+njik=1Dij k(νik, Wi;μk, bk,αk, σk2)
,
and the conditional expectation ofRij k is given by
exp(ηTkXi)nikj=1Aijk(νik;αk, σk2) exp(ηTkXi)
nik
j=1Aijk(νik;αk, σ 2
k)+ nik
j=1Dijk(νik, Wi;μk, bk,αk, σ 2
k)
+ {
Aij k(νik;αk,σk2)
gij k(Wi;μk,bk)Bij k(νik;α0k,σk2)+Aij k(νik;αk,σk2)} exp(ηTkXi)
nik
j=1Aijk(νik;αk, σ 2
k)+ nik
j=1Dijk(νik, Wi;μk, bk,αk, σ 2
k)
× nik
j=1 Dijk
νik, Wi;μk, bk,αk, σk2
.
Note that the joint density of(νik, Wi)givenOi is proportional to
hi
Wi;σW2, σδ2
φνik;σkν2 $K
k=1qk(Wi;ηk, μk, bk, α1k, σk2, σkν2 )
qk(Wi;ηk, μk, bk,αk, σk2, σkν2 ) %
×exp(η
T
kXi){ nik
j=1Aij k(νik;αk, σ 2
k)} + nik
j=1Dij k(νik, Wi;μk, bk,αk, σ 2
k) 1+exp(ηTkXi)
and the density of Wi given Oi is proportional to Kk=1qk(Wi;ηk, μk, bk,αk,
σk2, σkν2)hi(Wi;σW2, σδ2). We evaluate the conditional expectations through numer-ical integration overνikandWiwith two-dimensional Gauss–Hermite quadratures. We iterate between the E-step and M-step until convergence.
Acknowledgments. The authors wish to thank the NIH dbGap data repos-itory (accession number phs000222.v3.p2) and the PREDICT-HD study inves-tigators. Data collection and sharing for the ADNI study in this project was funded by the Alzheimer’s Disease Neuroimaging Initiative (ADNI) (National In-stitutes of Health Grant U01 AG024904) and DOD ADNI (Department of Defense award number W81XWH-12-2-0012). ADNI is funded by the National Institute on Aging, the National Institute of Biomedical Imaging and Bioengineering, and through generous contributions from the following: AbbVie, Alzheimer’s Asso-ciation; Alzheimer’s Drug Discovery Foundation; Araclon Biotech; BioClinica, Inc.; Biogen; Bristol-Myers Squibb Company; CereSpir, Inc.; Cogstate; Eisai Inc.; Elan Pharmaceuticals, Inc.; Eli Lilly and Company; EuroImmun; F. Hoffmann-La Roche Ltd and its affiliated company Genentech, Inc.; Fujirebio; GE Healthcare; IXICO Ltd.; Janssen Alzheimer Immunotherapy Research & Development, LLC.; Johnson & Johnson Pharmaceutical Research & Development LLC.; Lumosity; Lundbeck; Merck & Co., Inc.; Meso Scale Diagnostics, LLC.; NeuroRx Research; Neurotrack Technologies; Novartis Pharmaceuticals Corporation; Pfizer Inc.; Pi-ramal Imaging; Servier; Takeda Pharmaceutical Company; and Transition Thera-peutics. The Canadian Institutes of Health Research is providing funds to support ADNI clinical sites in Canada. Private sector contributions are facilitated by the Foundation for the National Institutes of Health (www.fnih.org). The grantee or-ganization is the Northern California Institute for Research and Education, and the study is coordinated by the Alzheimer’s Therapeutic Research Institute at the Uni-versity of Southern California. ADNI data are disseminated by the Laboratory for Neuro Imaging at the University of Southern California.
SUPPLEMENTARY MATERIAL
Supplement A: Supplement to “Early diagnosis of neurological disease using peak degeneration ages of multiple biomarkers” (DOI: 10.1214/18-AOAS1236SUPPA; .pdf). This supplement provides additional information on the theorem and proof on model identifiability, protocol for simulation studies, de-tails on estimating the magnitude of measurement error, and residual plots of the examples.
REFERENCES
BATEMAN, R. J., XIONG, C., BENZINGER, T. L. S., FAGAN, A. M., GOATE, A., FOX, N. C., MARCUS, D. S., CAIRNS, N. J., XIE, X. et al. (2012). Clinical and biomarker changes in domi-nantly inherited Alzheimer’s disease.N.Engl.J.Med.367795–804.
BERNARDO, J. M. (1979). Expected information as expected utility. Ann. Statist. 7 686–690.
MR0527503
DUBOIS, B., FELDMAN, H. H., JACOVA, C., DEKOSKY, S. T., BARBERGER-GATEAU, P., CUM-MINGS, J., DELACOURTE, A., GALASKO, D., GAUTHIER, S. et al. (2007). Research criteria for the diagnosis of Alzheimer’s disease: Revising the NINCDS-ADRDA criteria.Lancet Neurol.6
734–746.
FJELL, A. M., WALHOVD, K. B., FENNEMA-NOTESTINE, C., MCEVOY, L. K., HAGLER, D. J., HOLLAND, D., BREWER, J. B. and DALE, A. M. (2009). One-year brain atrophy evident in healthy aging.J.Neurosci.2915223–15231.
GAO, F., WANG, Y. and ZENG, D. (2019). Supplement to “Early diagnosis of neurological dis-ease using peak degeneration ages of multiple biomarkers.” DOI:10.1214/18-AOAS1236SUPPA,
DOI:10.1214/18-AOAS1236SUPPB.
GARCIA, T., MARDER, K. and WANG, Y. (2017). Statistical modeling of Huntington disease onset. Handb.Clin.Neurol.14447–61.
GNEITING, T., BALABDAOUI, F. and RAFTERY, A. E. (2007). Probabilistic forecasts, calibration and sharpness.J.R.Stat.Soc.Ser.B.Stat.Methodol.69243–268.MR2325275
GOOD, I. J. (1952). Rational decisions.J.Roy.Statist.Soc.Ser.B14107–114.MR0077033
HUNTINGTON STUDY GROUP (1996). Unified Huntington’s disease rating scale: Reliability and consistency.Mov.Disord.11136–142.
HALL, C. B., LIPTON, R. B., SLIWINSKI, M. and STEWART, W. F. (2000). A change point model for estimating the onset of cognitive decline in preclinical Alzheimer’s disease.Stat.Med. 19
1555–1566.
HALL, C. B., YING, J., KUO, L., SLIWINSKI, M., BUSCHKE, H., KATZ, M. and LIPTON, R. B. (2001). Estimation of bivariate measurements having different change points, with application to cognitive ageing.Stat.Med.203695–3714.
HALL, C. B., YING, J., KUO, L. and LIPTON, R. B. (2003). Bayesian and profile likelihood change point methods for modeling cognitive function over time.Comput.Statist.Data Anal.4291–109.
MR1963357
HAMPEL, H., BÜRGER, K., TEIPEL, S. J., BOKDE, A. L. W., ZETTERBERG, H. and BLENNOW, K. (2008). Core candidate neurochemical and imaging biomarkers of Alzheimer’s disease.Alzheimer’s Dement.438–48.
HOGAN, J. W. and LAIRD, N. M. (1997). Mixture models for the joint distribution of repeated measures and event times.Stat.Med.16239–257.
HOPFIELD, J. J. (1982). Neural networks and physical systems with emergent collective computa-tional abilities.Proc.Natl.Acad.Sci.USA792554–2558.MR0652033
JACK, C. R., KNOPMAN, D. S., JAGUST, W. J., SHAW, L. M., AISEN, P. S., WEINER, M. W., PETERSEN, R. C. and TROJANOWSKI, J. Q. (2010). Hypothetical model of dynamic biomarkers of the Alzheimer’s pathological cascade.Lancet Neurol.9119–128.
JACQMIN-GADDA, H., COMMENGES, D. and DARTIGUES, J.-F. (2006). Random changepoint model for joint modeling of cognitive decline and dementia.Biometrics62254–260.MR2226580
JEDYNAK, B. M., LANG, A., LIU, B., KATZ, E., ZHANG, Y., WYMAN, B. T., RAUNIG, D., JE-DYNAK, C. P., CAFFO, B. et al. (2012). A computational neurodegenerative disease progression score: Method and results with the Alzheimer’s disease neuroimaging initiative cohort. NeuroIm-age631478–1486.
disease mutation: The sensitivity and specificity of measuring CAG repeats.N.Engl.J.Med.330
1401–1406.
LITTLE, R. J. A. (1995). Modeling the drop-out mechanism in repeated-measures studies.J.Amer. Statist.Assoc.901112–1121.MR1354029
LONG, J. D., PAULSEN, J. S., MARDER, K., ZHANG, Y., KIM, J.-I. and MILLS, J. A. (2014). Tracking motor impairments in the progression of Huntington’s disease.Mov.Disord.29311– 319.
MACDONALD, M. E., AMBROSE, C. M., DUYAO, M. P., MYERS, R. H., LIN, C., SRINIDHI, L., BARNES, G., TAYLOR, S. A., JAMES, M. et al. (1993). A novel gene containing a trinucleotide repeat that is expanded and unstable on Huntington’s disease chromosomes.Cell72971–983. NELSON, P. T., ALAFUZOFF, I., BIGIO, E. H., BOURAS, C., BRAAK, H., CAIRNS, N. J.,
CASTEL-LANI, R. J., CRAIN, B. J., DAVIES, P. et al. (2012). Correlation of Alzheimer disease neu-ropathologic changes with cognitive status: A review of the literature.J.Neuropathol.Exp. Neu-rol.71362–381.
PAULSEN, J., LONG, J., ROSS, C., HARRINGTON, D., ERWIN, C., WILLIAMS, J., WESTER-VELT, J., JOHNSON, H., AYLWARD, E. et al. (2014a). Prediction of manifest Huntington’s dis-ease with clinical and imaging measures: A prospective observational study.Lancet Neurol.13
1193–1201.
PAULSEN, J. S., LONG, J. D., JOHNSON, H. J., AYLWARD, E. H., ROSS, C. A., WILLIAMS, J. K., NANCE, M. A., ERWIN, C. J., WESTERVELT, H. J. et al. (2014b). Clinical and biomarker changes in premanifest Huntington disease show trial feasibility: A decade of the PREDICT-HD study.Front.Aging Neurosci.61–11.
RIZOPOULOS, D. (2012).Joint Models for Longitudinal and Time-to-Event Data:With Applications in R. CRC Press/CRC, New York.
RUBINSZTEIN, D. C., LEGGO, J., COLES, R., ALMQVIST, E., BIANCALANA, V., CASSIMAN, J.-J., CHOTAI, K., CONNARTY, M., CRAUFURD, D. et al. (1996). Phenotypic characterization of individuals with 30–40 CAG repeats in the Huntington disease (HD) gene reveals HD cases with 36 repeats and apparently normal elderly individuals with 36–39 repeats.Am.J.Hum.Genet.59
16–22.
SAMTANI, M. N., FARNUM, M., LOBANOV, V., YANG, E., RAGHAVAN, N., DIBERNARDO, A. and NARAYAN, V. (2012). An improved model for disease progression in patients from the Alzheimer’s disease neuroimaging initiative.J.Clin.Pharmacol.52629–644.
SHAW, L. M., VANDERSTICHELE, H., KNAPIK-CZAJKA, M., CLARK, C. M., AISEN, P. S., PE-TERSEN, R. C., BLENNOW, K., SOARES, H., SIMON, A. et al. (2009). Cerebrospinal fluid biomarker signature in Alzheimer’s disease neuroimaging initiative subjects. Ann. Neurol. 65
403–413.
SPERLING, R. A., AISEN, P. S., BECKETT, L. A., BENNETT, D. A., CRAFT, S., FAGAN, A. M., IWATSUBO, T., JACK, C. R., KAYE, J. et al. (2011). Toward defining the preclinical stages of Alzheimer’s disease: Recommendations from the National Institute on Aging-Alzheimer’s As-sociation Workgroups on diagnostic guidelines for Alzheimer’s disease.Alzheimer’s Dement.7
280–292.
TSIATIS, A. A. and DAVIDIAN, M. (2004). Joint modeling of longitudinal and time-to-event data: An overview.Statist.Sinica14809–834.MR2087974
F. GAO
DEPARTMENT OFBIOSTATISTICS
UNIVERSITY OFWASHINGTON
SEATTLE, WASHINGTON98195
USA
E-MAIL:[email protected]
Y. WANG
DEPARTMENT OFBIOSTATISTICS
COLUMBIAUNIVERSITY
NEWYORK, NEWYORK10032 USA
D.ZENG
DEPARTMENTOFBIOSTATISTICS
UNIVERSITYOFNORTHCAROLINA
ATCHAPELHILL
CHAPELHILL, NORTHCAROLINA27599
USA