Association of a Novel Mutation in the
Plasmodium
falciparum
Chloroquine Resistance Transporter With
Decreased Piperaquine Sensitivity
Sonia Agrawal,1 Kara A. Moser,2 Lindsay Morton,1 Michael P. Cummings,3 Ankita Parihar,2 Ankit Dwivedi,2 Amol C. Shetty,2
Elliott F. Drabek,2,a Christopher G. Jacob,1,a Philipp P. Henrich,7 Christian M. Parobek,6 Krisada Jongsakul,9 Rekol Huy,5 Michele D. Spring,9
Charlotte A. Lanteri,9,a Suwanna Chaorattanakawee,9,10 Chanthap Lon,4,9 Mark M. Fukuda,9 David L. Saunders,9 David A. Fidock,7,8 Jessica T. Lin,6
Jonathan J. Juliano,6 Christopher V. Plowe,1 Joana C. Silva,2 and Shannon Takala-Harrison1
1Division of Malaria Research, Institute for Global Health, and 2Institute for Genome Sciences, University of Maryland School of Medicine, Baltimore; 3Center for Bioinformatics and Computational Biology, University of Maryland, College Park; 4Armed Forces Research Institute of Medical Sciences, and 5National Center for Parasitology Entomology and Malaria Control, Phnom Penh, Cambodia; 6Division of Infectious Diseases, University of North Carolina at Chapel Hill; 7Department of Microbiology and Immunology, and 8Division of Infectious Diseases, Department of Medicine, Columbia University Medical Center, New York; 9Armed Forces Research Institute of Medical Sciences, Department of Immunology and Medicine, and 10Department of Parasitology and Entomology, Faculty of Public Health, Mahidol University, Bangkok, Thailand
Background. Amplified copy number in the plasmepsin II/III genes within Plasmodium falciparum has been associated with decreased sensitivity to piperaquine. To examine this association and test whether additional loci might also contribute, we per-formed a genome-wide association study of ex vivo P. falciparum susceptibility to piperaquine.
Methods. Plasmodium falciparum DNA from 183 samples collected primarily from Cambodia was genotyped at 33 716 genome-wide single nucleotide polymorphisms (SNPs). Linear mixed models and random forests were used to estimate associations between parasite genotypes and piperaquine susceptibility. Candidate polymorphisms were evaluated for their association with dihydroarte-misinin-piperaquine treatment outcomes in an independent dataset.
Results. Single nucleotide polymorphisms on multiple chromosomes were associated with piperaquine 90% inhibitory concen-trations (IC90) in a genome-wide analysis. Fine-mapping of genomic regions implicated in genome-wide analyses identified multiple SNPs in linkage disequilibrium with each other that were significantly associated with piperaquine IC90, including a novel mutation within the gene encoding the P. falciparum chloroquine resistance transporter, PfCRT. This mutation (F145I) was associated with dihydroartemisinin-piperaquine treatment failure after adjusting for the presence of amplified plasmepsin II/III, which was also associated with decreased piperaquine sensitivity.
Conclusions. Our data suggest that, in addition to plasmepsin II/III copy number, other loci, including pfcrt, may also be involved in piperaquine resistance.
Keywords. malaria; piperaquine; resistance; Plasmodiumfalciparum; chloroquine resistance transporter; plasmepsin.
Artemisinin-based combination therapies (ACTs) are used worldwide and have contributed to reductions in the malaria burden in many areas. In response to inadequate efficacy of ACTs such as artesunate-mefloquine and artemether-lumefan-trine [1, 2], dihydroartemisinin-piperaquine became the drug of choice to treat multidrug-resistant Plasmodium falciparum in regions of Southeast Asia plagued by artemisinin resistance. In
addition, dihydroartemisinin-piperaquine is being used in field evaluations of targeted mass treatment to eliminate malaria within the Greater Mekong subregion in hopes of arresting the spread of resistance [3]. However, dihydroartemisinin-pip-eraquine efficacy rates as low as 46% have been reported in regions of western Cambodia where artemisinin resistance is well established [4–6], and decreased in vitro piperaquine sus-ceptibility has been seen in parasites collected from these areas [7, 8]. These findings suggest the emergence of piperaquine resistance in addition to existing artemisinin resistance, which bodes poorly for the ability to treat P. falciparum in this part of the world.
Molecular assays to detect markers of antimalarial drug resis-tance are valuable surveillance tools. Mutations within PfKelch13 have been identified and genetically confirmed as markers of resistance to the artemisinins [9–11]. Two recent studies have indicated that copy number variation in the plasmepsin II and III
genes, located on chromosome 14 of P. falciparum, may serve as a molecular marker for decreased piperaquine sensitivity [12, 13];
Received 24 May 2017; editorial decision 10 July 2017; accepted 12 July 2017; published online July 17, 2017.
Presented in part: Annual Meeting of the American Society of Tropical Medicine and Hygiene, Philadelphia, Pennsylvania, November 2015. Presentation number: LB-5375.
aPresent affilation/address: Atreca, Inc., Redwood City, California (E. F. D.); Wellcome Trust
Sanger Institute, Hinxton, United Kingdom (C. G. J.); Uniformed Services University of the Health Sciences, Rockville, Maryland (C. A. L.).
Correspondence: S. Takala-Harrison, PhD, Division of Malaria Research, Institute for Global Health, University of Maryland School of Medicine, 685 W Baltimore St, HSF1-480, Baltimore, MD 21201 ([email protected]).
The Journal of Infectious Diseases® 2017;216:468–76
DOI: 10.1093/infdis/jix334
XX
however, other loci may be involved. Using samples collected from Cambodia, we performed a genome-wide association study of ex vivo P. falciparum susceptibility to piperaquine to identify candidate resistance loci. Here we report that in, addi-tion to plasmepsin II/III copy number, other loci are associated with decreased piperaquine sensitivity, including a novel muta-tion within the pfcrt gene.
METHODS
Study Samples
Samples used in the genome-wide association study were col-lected from individuals with clinical malaria participating in 1 of the 3 following studies (Supplementary Table 1): (1) a clini-cal trial of artesunate conducted in Battambang province from 2006–2007 (n = 30) [14]; (2) a malaria survey conducted from 2009–2014 in 8 Cambodian provinces: Battambang, Pailin, Koh Kong, Kampot, Kampong Speu, Oddar Meanchey, Preah Sihanouk, and Preah Vihear (n = 145) [7]; and (3) a single-arm clinical evaluation of artesunate-mefloquine conducted in Kanchanaburi province, Thailand (n = 8). One hundred eighty-three samples had both genotypes and phenotypes available.
Samples used in the validation dataset (n = 53) were collected as part of a therapeutic efficacy study conducted in Oddar Meanchey province that assessed the efficacy of a 3-day course of dihydroartemisinin-piperaquine [5]. In this study, using polymerase chain reaction (PCR) genotyping of P. falciparum msp1, msp2, and glurp, the PCR-adjusted 42-day recrudescence rate was found to be 54% by modified intention-to-treat anal-ysis [5].
Samples were collected under informed consent as approved by the Walter Reed Army Institute of Research and local in-country institutional review boards and were approved for use by the University of Maryland School of Medicine.
Parasite Genotypes
DNA extracted from leukocyte-depleted venous blood was gen-otyped using a P. falciparum–specific NimbleGen 4.2M probe DNA microarray that types a total of 33 716 single nucleotide polymorphisms (SNPs) [15]. One hundred seventeen isolates also underwent whole-genome sequencing using Illumina HiSeq 2000, using 101 base pair–paired end reads, without prior ampli-fication. Illumina sequencing was also performed separately at the University of North Carolina to generate whole-genome sequence data for the 53 additional samples used as a valida-tion dataset [16]. Statistics describing the breadth of genome coverage and read depth for both datasets can be found in Supplementary Table 2. Single nucleotide polymorphism calling for both datasets was performed at University of Maryland fol-lowing Genome Analysis Toolkit’s best practices [17–19] using Unified Genotyper v3.1.1. Single nucleotide polymorphisms were filtered on phred-based quality score, read depth, strand bias, and mapping quality to generate a high-confidence SNP
call set. The SNP array data have been submitted to the National Institutes of Health Gene Expression Omnibus for public access (www.ncbi.nlm.gov/geo/; accession number: GSE100704). Whole genome sequences were submitted to GenBank (acces-sion numbers: SAMN06175892–SAMN06176015).
Phenotype
Ex vivo piperaquine 90% inhibitory concentrations (IC90s) were assessed using a histidine-rich protein-2 enzyme-linked immunosorbent assay (HRP-2 ELISA) as previously described [20, 21]. All assays were performed in the same laboratory at the Armed Forces Research Institute of Medical Science [21]. Piperaquine concentrations in the assay ranged 0.9–674 nM, including a no drug control. In 2013, we began to observe iso-lates with the ability to grow in the maximum concentration of drug used in the standard range. As a result, starting in 2014, an increased range of piperaquine concentrations (3.4–53 905 nM) was used in addition to the standard dilutions. To estimate piperaquine IC90 of parasites that grew in the maximum con-centration of drug from the standard range (0.9–674 nM), the curves were replotted by fitting “zero-growth” HRP-2 optical density values at the extrapolated piperaquine concentration of 53 905 nM. Dose–response curves for isolates with a range of susceptibilities have been described previously [20, 22]. Ninety percent inhibitory concentration was used as the phenotype because it was better correlated with treatment outcome in our validation dataset and in other studies [20] compared with IC50. A recent article also reported that IC90 values were more reliable than IC50 values when quantifying differences in piperaquine susceptibility [23]. The piperaquine survival assay [8] was not performed on isolates included in this study.
ADMIXTURE Analysis and Single Nucleotide Polymorphism Imputation ADMIXTURE 1.23 [24] was used to group parasites into sub-populations for the purpose of imputation and to adjust for confounding in the association analysis. The number of subpop-ulations, K, was varied from 1 to 15, with 10 replicate runs per K. Cross-validation errors were used to determine the appropri-ate K. Parasites clustered into 6 subpopulations. Ancestry values were used from the replicate with the greatest log-likelihood, and isolates were assigned to a subpopulation based on their greatest ancestry value (Supplementary Figure 1).
Quality Control
The proportion of missing SNP calls was plotted by SNP and by sample. Invariant nucleotide positions across 183 samples, SNPs with >40% missing calls, and samples with >40% miss-ing calls were excluded before analysis. These criteria resulted in the removal of 28 253 SNPs (23 271 invariant SNPs and 4982 with a high proportion of missing calls) and 30 samples. An additional 2751 SNPs with minor allele frequency <5% were removed before analysis. After quality control, the final genome-wide association analysis included 2712 SNPs and 153 samples.
Correspondence Between Genetic Subpopulations
A hierarchical clustering approach using a proportional dis-tance matrix, performed on previously published P. falciparum
sequences from Cambodia [26] (Dwivedi et al, submitted), was used to determine the correspondence between genetic subpop-ulations in this study and those from the Dwivedi study. A total of 2474 SNPs from 320 samples (153 from this study and 167 from the Dwivedi study) were used in the analysis. Dwivedi and colleagues have shown that stable clusters can be obtained with as few as 1000 SNPs. The correspondence between the subpop-ulations is shown in Supplementary Figures 2 and 3.
Regression
Genome-wide mixed model association (GEMMA) [27] was used to estimate the association between each SNP and log10-transformed piperaquine IC90 (treated as a continuous variable), adjusting for genetic subpopulation, the presence of mutations in the kelch13 gene, and the first 3 principal ponents of a principal components analysis. Principal com-ponents were estimated from a matrix of pair-wise sample identity-by-state metrics [28]. An identity-by-state allele-shar-ing matrix was included as a random effect to account for the correlation between genetically similar individuals that results from population structure. The GEMMA method was used to estimate coefficients and P values. A Bonferroni threshold (0.05/number of SNPs analyzed) was used to evaluate genome-wide significance. Quantile-quantile plots for P values were used to assess the robustness of modeling approaches in min-imizing false-positive results due to population structure or other confounding.
Random Forests
Random forest analyses [29] were done using the randomForest package [30] of the R statistical computing environment [31]. Because there is not an explicit way to control for confound-ing due to population structure in random forests, analysis was performed within the genetic subpopulation containing most parasites with the highest IC90 values (subpopulation 2, n = 22). The number of variables tested at each split ranged 323–1097, and the number of trees in the forest was 100 000. The impor-tance of each SNP in predicting log-transformed piperaquine
IC90 (treated as a continuous variable) was assessed based on the percentage increase in mean-squared error.
Linkage Disequilibrium
The program Haploview [32] was used to determine linkage disequilibrium (LD) around SNPs associated with piperaquine susceptibility in genome-wide analyses. Linkage disequilib-rium windows were defined to include all SNPs upstream and downstream of the associated SNP or mutation of interest up to but not including the next SNP with minor allele frequency (MAF) > 0.05 and R2 < 0.3. For associated SNPs, LD windows
(Supplementary Table 3) were defined within parasites with the highest IC90 values (ie, log10 IC90 > 3.0) in genetic subpopulation 2 to avoid false LD estimates due to population structure.
Gene Copy Number Analysis
Copy number variation was assessed across the 117 samples for which whole-genome sequences were generated. Raw paired-end sequences from each sample were aligned against the P. fal-ciparum 3D7 (PlasmoDB version 24) reference sequence using bowtie2 (version 2.2.4) [33]. For each sample, we calculated the number of reads that overlap known coding sequence intervals based on the P. falciparum 3D7 reference annotation general feature format file. The overlapping reads for each sample were normalized by mean coverage of the sample. Gene coverage in P. falciparum telomeric and internal hypervariable repeat regions [34] was excluded. Linear regression was used to model normalized coverage of P. falciparum core genes as a function of log-transformed piperaquine IC90. To estimate the number of copies of the plasmepsin II and III genes within samples with whole genome sequence data, copy number variations across chromosome 14 were determined by applying a previously described procedure [34].
Association With Treatment Outcome
Cox proportional hazards was used to model the time to P. fal-ciparum recurrence in individuals with a given mutation (eg, PfCRT F145I or amplified plasmepsin II/III copy number) com-pared with those without that mutation in the independently sequenced validation dataset. Hazard ratios (HRs) and 95% confidence intervals (CIs) were estimated using SAS v.9.3.
RESULTS
A total of 183 samples had both SNP array data and ex vivo phe-notypes available (Supplementary Table 1). After quality con-trol, a total of 2712 SNPs and 153 samples were included in the final genome-wide association analysis. Of these 153 samples, 117 successfully underwent whole-genome sequencing for use in fine-mapping and copy number variation analyses.
Phenotype Distribution
clustered into the same genetic subpopulation (subpopulation 2, n = 22). Parasites from subpopulation 2 corresponded with the arte-misinin-resistant KH2.2 subpopulation from a study conducted by Dwivedi and colleagues (Dwivedi et al, submitted) (Supplementary Figure 2). No parasites from this study corresponded with the arte-misinin-sensitive ancestral Southeast Asian subpopulation KH1.1 from the Dwivedi study (Supplementary Figure 3).
Genome-Wide Associations
Ten SNPs on chromosomes 6, 10, 11, 12, and 14 achieved genome-wide significance in linear mixed models of the
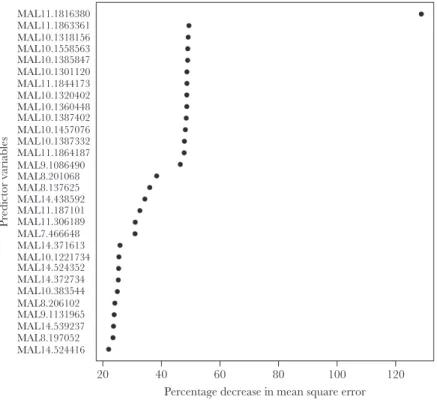
association between each SNP on the array and piperaquine IC90 (Figure 2). The random forests analysis identified an SNP on chromosome 11 as the best predictor of piperaquine IC90 (MAL11:1816380), with SNPs on chromosomes 7, 8, 9, 10, and 14 also being among the top predictors of log-transformed IC90 (Figure 3). All SNPs from the array that were associated with piperaquine susceptibility are shown in Supplementary Table 5.
Fine-Mapping Using Whole-Genome Sequences
Regions of LD are defined for each SNP in Supplementary Table 5 (Supplementary Table 3). From these regions of the genome, all SNPs identified in parasites that underwent whole-genome sequencing were included in linear mixed mod-els of the association between log-transformed piperaquine IC90 and each locus. Nineteen SNPs, many of which were in perfect LD with each other, achieved genome-wide significance and had a positive coefficient (ie, the nonreference allele was associated with the phenotype) (Table 1). These loci included the SNP encoding a mutation at position 145 within the pfcrt
gene (F145I), SNPs within a large region of chromosome 10, and SNPs on chromosomes 9 and 14. Based on gene ontol-ogy classification in PlasmoDB, only 1 gene in Table 1, pfcrt, has a predicted function related to drug response, transport, or hemoglobin metabolism.
Copy Number Analysis
Linear regression was used to model normalized read coverage of P. falciparum core genes as a function of log-transformed piperaquine IC90 in samples for which whole-genome sequence was available (n = 117). Read coverage of 2 genes on chromo-some 14, plasmepsin II and III, showed the strongest association with piperaquine IC90 (Figure 4). Read coverage of the pfmdr1
gene was not significantly associated with piperaquine IC90 after accounting for multiple comparisons (P = .01).
1 6
5
4
3
–Log
10
(
p
)
2
1
0
2 3 4
Chromosome
5 6 7 8 9 10 11 12 13 14
Figure 2. Manhattan plot of the association between genome-wide parasite genotypes and piperaquine 90% inhibitory concentrations (IC90). Linear mixed models were used to estimate the association between single nucleotide polymorphisms (SNPs) on the DNA microarray and a continuous measure of log-transformed piperaquine IC90 (n = 153). The SNPs achieving genome-wide significance are shown in red. The SNPs on chromosomes 6, 10, 11, 12, and 14 were significantly associated with the phenotype. The SNP in PfCRT encoding the F145I mutation was not included in the microarray and was only detected by whole-genome sequencing.
1 2 3 4
Subpopulation 50000
5000
500
PPQ IC90 (nM)
100
50
10
5 6
20 40 60 80
Percentage decrease in mean square error
100 120
MAL14.524416 MAL8.197052 MAL14.539237 MAL9.1131965 MAL8.206102 MAL10.383544 MAL14.372734 MAL14.524352 MAL10.1221734 MAL14.371613 MAL7.466648 MAL11.306189 MAL11.187101 MAL14.438592 MAL8.137625 MAL8.201068
Predictor variables
MAL9.1086490 MAL11.1864187 MAL10.1387332 MAL10.1457076 MAL10.1387402 MAL10.1360448 MAL10.1320402 MAL11.1844173 MAL10.1301120 MAL10.1385847 MAL10.1558563 MAL10.1318156 MAL11.1863361 MAL11.1816380
Figure 3. Random forest variable importance plot identifying loci from the DNA microarray that best predict piperaquine 90% inhibitory concentrations (IC90). Random forests were used to identify loci that were the best predictors of a continuous measure of log-transformed piperaquine IC90 in samples from genetic subpopulation 2 (n = 22). The single nucleotide polymorphisms (SNPs) showing the greatest percentage increase in mean squared error (x-axis) are the best predictors of the phenotype. The SNPs on chromosomes 7, 8, 9, 10, 11, and 14 were the top predictors of log-transformed IC90.
Table 1. Single Nucleotide Polymorphisms Associated With Piperaquine 90% Inhibitory Concentrations in Fine-Mapping Analysis of Whole-Genome Sequence Data
SNP Gene (mutation) P value
MAL7:404010 PF3D7_0709000 (Chloroquine resistance transporter, F145I) 3.61E-07
MAL9:1233153 PF3D7_0930800 (Conserved membrane protein, T2490I) 3.61E-07
MAL9:1233160 PF3D7_0930800 (Conserved membrane protein, 2492S) 3.61E-07
MAL9:1279569 PF3D7_0932100 (Conserved membrane protein, intronic) 3.61E-07
MAL9:1279572 PF3D7_0932100 (Conserved membrane protein, intronic) 3.61E-07
MAL10:1318156 PF3D7_1032900 (RNA polymerase II–associated protein 1, 932L) 8.75E-07
MAL10:1343706 PF3D7_1033500 (WD repeat-containing protein 70, I687M) 3.61E-07
MAL10:1351775 PF3D7_1033800 (Plasmepsin VII, intronic) 3.61E-07
MAL10:1362218 PF3D7_1034100 (Conserved protein, 118G) 3.61E-07
MAL10:1369153 PF3D7_1034400 (Flavoprotein subunit of succinate dehydrogenase, Q13K) 3.61E-07
MAL10:1372810 PF3D7_1034500 (Conserved protein, C651Y) 3.61E-07
MAL10:1391842 PF3D7_1035100 (Probable protein, D133A) 3.61E-07
MAL10:1392054 PF3D7_1035100 (Probable protein, S204R) 3.61E-07
MAL10:1400026 PF3D7_1035300 (Glutamate-rich protein, P278S) 3.61E-07
MAL10:1401296 PF3D7_1035300 (Glutamate-rich protein, S701F) 3.61E-07
MAL10:1506404 PF3D7_1038000 (Antigen UB05, 51I) 3.61E-07
MAL10:1546332 PF3D7_1038400 (Gametocyte-specific protein,) 3.61E-07
MAL10:1552425 PF3D7_1038600 (Exported protein, H210R) 3.61E-07
MAL14:408912 PF3D7_1410300 (WD repeat-containing protein, 2717P) 3.61E-07
Validation Dataset
To validate the observed associations, we examined sequences generated from parasites collected during a study evaluating the therapeutic efficacy of dihydroartemisinin-piperaquine (n = 53) [5]. In this independent dataset, the unadjusted haz-ard of P. falciparum recurrence in patients with parasites con-taining >1 copy of the plasmepsin II gene (n = 34) compared with patients with a single copy of this gene was 5.59 (95% CI = 1.30–24.06) (Table 2). The unadjusted hazard of recur-rence in patients with parasites having the PfCRT 145I muta-tion (n = 13) compared with those with the wildtype F145 was 5.12 (95% CI = 2.10–12.49). The association between PfCRT 145I remained significant after adjusting for parasites having >1 copy of plasmepsin II and log-transformed parasitemia at diag-nosis (adjusted HR = 4.61; 95% CI = 1.73–12.28) (Table 2). In this dataset, all but 4 parasites had a PfKelch13 propeller muta-tion, such that the presence of a PfKelch13 mutation was not
significantly associated with recurrence and not included in the final model.
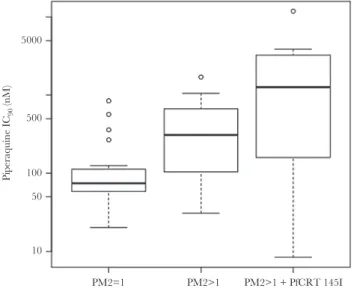
In addition, the mean piperaquine IC90 was significantly greater in parasites with both the PfCRT 145I mutation and multiple copies of plasmepsin II, compared with parasites with amplified plasmepsin II and without 145I (linear regression,
P = .03) and compared with parasites with a single copy of
plasmepsin II and without 145I (linear regression, P = .0001) (Figure 5; Supplementary Table 6). The PfCRT 145I mutation only occurred in parasites with amplified plasmepsin II/III.
PfCRT and Other Mutations
Within both the fine-mapping and validation datasets, 46 infec-tions contained parasites with multiple copies of the plasmepsin II/III genes, 64% of which did not have the 145I mutation, and 36% of which did have the 145I mutation. In addition, the PfCRT 145I mutation only occurred on a Dd2 PfCRT back-ground (ie, in parasites with mutations at positions 75, 326, 356, and 371), and all parasites with 145I showed a single haplotype in SNPs flanking and in LD with the pfcrt gene (Supplementary Figure 4). All parasites with PfCRT 145I had the 580Y muta-tion at the kelch13 locus, whereas 85% (n = 23/27) of parasites with amplified plasmepsin II/III but without 145I had 580Y. The PfCRT 97Y and 97L mutations [8] were observed in 4 and 2 parasites, respectively, in the fine-mapping dataset. Position 97 was not associated with piperaquine IC90 in linear mixed models (P = .60). The 97Y mutation was not observed, and the 97L mutation was observed only once in parasites within the Table 2. Cox Proportional Hazards Models of Time to Plasmodium
falci-parum Recurrence
Variable Hazard ratio (95% CI) P value
Plasmepsin II >1 5.59 (1.30–24.06) .02
PfCRT 145I 5.12 (2.10–12.49) .0003
Plasmepsin II >1 4.14 (.89–19.37) .07
PfCRT 145I 4.61 (1.73–12.28) .002
Parasitemia at diagnosis 1.53 (1.00–2.36) .051
Abbreviation: CI, confidence interval. 16
14
12
10
8
−
Log
10
(p-value)
6
4
2
0
0 500 1000 1500 2000 2500 3000
Genes in chromosomal order
Plasmepsin III
Plasmepsin II
3500 4000 4500 5000
Figure 4. Association between gene copy number and piperaquine 90% inhibitory concentrations (IC90). Linear regression was used to model normalized coverage of
Plasmodium falciparum core genes in 117 whole-genome sequences as a function of log-transformed piperaquine IC90 (treated as a continuous variable). Normalized coverage
validation dataset. No parasites in either dataset had mutations at PfCRT positions 343 and 353, positions implicated in a previ-ous study of piperaquine susceptibility conducted in a different region of Cambodia [8].
DISCUSSION
Amplification of plasmepsin II/III is associated with decreased piperaquine sensitivity and may serve as a useful marker for surveillance [12, 13]. We performed a genome-wide associa-tion study of ex vivo P. falciparum susceptibility to piperaquine to identify loci that are associated with decreased sensitivity. Single nucleotide polymorphisms on multiple chromosomes were associated with piperaquine IC90 in a genome-wide anal-ysis. Fine-mapping of genomic regions implicated in genome-wide analyses identified multiple SNPs in LD with each other that were significantly associated with piperaquine IC90, includ-ing a mutation within the pfcrt gene. This mutation (PfCRT F145I) was associated with P. falciparum recurrence following treatment with dihydroartemisinin-piperaquine after adjusting for the presence of multiple copies of the plasmepsin II gene. Although plasmepsin II/III copy number was associated with piperaquine IC90 and dihydroartemisinin-piperaquine treat-ment outcome, our data suggest that other loci may also be involved in resistance.
Amato and colleagues recently reported an association between a mutation within an exonuclease on chromosome 13 and piperaquine IC50 [35]. We did not see any evidence of an
association between piperaquine IC50 or IC90 and SNPs on chro-mosome 13 in our genome-wide analysis. We did, however, see some overlap in SNPs identified in the Amato study and regions of the genome identified in our genome-wide analysis, including SNPs on chromosome 12 (MAL12:1787279) and chromosome 14 (MAL14:2385550, MAL14:2395752, and MAL14:2411942). Wang and colleagues [36] also showed an association between piperaquine IC50 and an SNP in a similar region of chromo-some 12 (MAL12:1959796), as well as an SNP on chromochromo-some 8 (MAL8:280180) that is in a region of the chromosome iden-tified in our genome-wide analysis. Although these regions of chromosomes 8, 12, and 14 did not show significant associa-tions in our fine-mapping analysis of whole genome sequences, they were identified in multiple studies and thus warrant fur-ther investigation.
We observed a large region of LD on chromosome 10 that was associated with piperaquine IC90, both in the regression and random forest analyses. This pattern is consistent with a selec-tive sweep localizing to this region of the genome, which har-bors 54 genes (chromosome 10: 1318156–1552425). Of these 54 genes, 9 (PF3D7_1033000, PF3D7_1034000, PF3D7_1034700, PF3D7_1036300, PF3D7_1036400, PF3D7_1036800, PF3D7_1037300, PF3D7_1037500, PF3D7_1038100) had gene ontology terms suggesting a function in hemoglobin metab-olism, drug response, or transport, and 1 (PF3D7_1036300, encoding Duffy binding-like merozoite surface protein 2) has been implicated in resistance to halofantrine, mefloquine, and lumefantrine [37]. However, none of these 9 genes had poly-morphisms that were significantly associated with piperaquine IC90 in our fine-mapping analysis of whole-genome sequences. This region of the genome is also in LD with PfCRT F145I, so it is not clear which mutations are driving the signal, but it is possible that additional loci within this region of chromosome 10 are contributing to decreased sensitivity.
PfCRT has been implicated in previous studies of piperaquine susceptibility, supporting our evidence that variants of this transporter can contribute to resistance to this chloroquine-like bisquinoline. Specifically, PfCRT 101F was identified in Dd2 parasites exposed to continuous piperaquine pressure that had elevated piperaquine IC50s [38], and this mutation was able to mediate piperaquine resistance in vitro when introduced via gene editing into Dd2 parasites [23]. Mutations at PfCRT posi-tions 97, 343, and 353 have also been associated with decreased piperaquine sensitivity [8]. In our datasets, mutations at PfCRT position 97 were not associated with piperaquine IC90, and no mutations were observed at positions 343 and 353 in either the fine-mapping or validation datasets.
In this study, we only observed the PfCRT 145I mutation in samples collected from Oddar Meanchey province in the years 2013–2014. Because samples were not available from other provinces for these years of the study (Supplementary Table 7), it is not possible for us to determine the distribution of this
PM2=1 5000
500
100
Piperaquine IC
90
(nM)
50
10
PM2>1 PM2>1 + PfCRT 145I
mutation in other regions of Cambodia, which is a limitation of the study. This mutation was not noted in other studies of piper-aquine susceptibility that used clinical samples from Cambodia [12, 13]. Although these studies did not sample isolates from Oddar Meanchey province, they did include isolates from neighboring Preah Vihear province. Future studies will examine the distribu-tion of PfCRT 145I in other geographic regions and its associadistribu-tion with dihydroartemisinin-piperaquine treatment efficacy.
The PfCRT 145I mutation was only observed in parasites with amplified plasmepsin II/III copy number, suggesting that perhaps in nature this mutation has only occurred or only attains high frequency on a background of amplified plasmepsin II/III. This observation could suggest that 145I has emerged on a background of resistance and that its association with resis-tance is not causal. However, this scenario is not supported by the observation that the association between PfCRT 145I and treatment outcome remained significant after adjusting for the presence of amplified plasmepsin II/III. Moreover, the mean piperaquine IC90 was greater in parasites with both amplified
plasmepsin II/III and PfCRT 145I compared with parasites with just amplified plasmepsin II/III, suggesting that 145I results in an additional resistance effect beyond that caused by ampli-fied plasmepsin II/III. Experiments to introduce PfCRT 145I into parasites both with and without elevated plasmepsin II/III
copy number and to remove this mutation from parasites with elevated copy number will be important for understanding the independent effect of the PfCRT 145I mutation and examin-ing any interaction between this locus and the plasmepsin II/ III genes.
Supplementary Data
Supplementary materials are available at The Journal of Infectious Diseases online. Consisting of data provided by the authors to benefit the reader, the posted materials are not copyedited and are the sole responsibility of the authors, so questions or com-ments should be addressed to the corresponding author.
Notes
Disclaimers. Material has been reviewed by the Walter Reed Army Institute of Research. There is no objection to its presentation and/or publication. The opinions or assertions contained herein are the private views of the author, and are not to be construed as official or as reflecting the views of the US Department of the Army, the US Department of Defense, or the US government. In addition, the contents of this publica-tion do not necessarily reflect the views, opinions, or policies of Uniformed Services University of the Health Sciences.
Financial support. This research was supported by grants from the National Institutes of Health (R01 AI101713 and R01 AI125579 to S. T.-H.); R01 AI089819 to J. J. J.; R01 AI124678, R01 AI109023, R01 AI50234to D. A. F.; and U19AI110820 to C. Fraser [project leader J. C. S.]).
Potential conflicts of interest. All authors: No reported con-flicts of interest. All authors have submitted the ICMJE Form for Disclosure of Potential Conflicts of Interest. Conflicts that the editors consider relevant to the content of the manuscript have been disclosed.
References
1. Denis MB, Tsuyuoka R, Lim P, et al. Efficacy of arte-mether-lumefantrine for the treatment of uncomplicated falciparum malaria in northwest Cambodia. Trop Med Int Health 2006; 11:1800–7.
2. Denis MB, Tsuyuoka R, Poravuth Y, et al. Surveillance of the efficacy of artesunate and mefloquine combination for the treatment of uncomplicated falciparum malaria in Cambodia. Trop Med Int Health 2006; 11:1360–6.
3. Lwin KM, Imwong M, Suangkanarat P, et al. Elimination of
Plasmodium falciparum in an area of multi-drug resistance. Malar J 2015; 14:319.
4. Leang R, Taylor WR, Bouth DM, et al. Evidence of
Plasmodium falciparum malaria multidrug resistance to artemisinin and piperaquine in western Cambodia: dihy-droartemisinin-piperaquine open-label multicenter clin-ical assessment. Antimicrob Agents Chemother 2015; 59:4719–26.
5. Spring MD, Lin JT, Manning JE, et al. Dihydroartemisinin-piperaquine failure associated with a triple mutant includ-ing kelch13 C580Y in Cambodia: an observational cohort study. Lancet Infect Dis 2015; 15:683–91.
6. Amaratunga C, Lim P, Suon S, et al. Dihydroartemisinin-piperaquine resistance in Plasmodium falciparum malaria in Cambodia: a multisite prospective cohort study. Lancet Infect Dis 2016; 16:357–65.
7. Chaorattanakawee S, Saunders DL, Sea D, et al. Ex vivo drug susceptibility testing and molecular profiling of clin-ical Plasmodium falciparum isolates from Cambodia from 2008 to 2013 suggest emerging piperaquine resistance. Antimicrob Agents Chemother 2015; 59:4631–43.
8. Duru V, Khim N, Leang R, et al. Plasmodium falciparum
dihydroartemisinin-piperaquine failures in Cambodia are associated with mutant K13 parasites presenting high sur-vival rates in novel piperaquine in vitro assays: retrospective and prospective investigations. BMC Med 2015; 13:305. 9. Ariey F, Witkowski B, Amaratunga C, et al. A molecular
marker of artemisinin-resistant Plasmodium falciparum
malaria. Nature 2014; 505:50–5.
10. Ghorbal M, Gorman M, Macpherson CR, Martins RM, Scherf A, Lopez-Rubio JJ. Genome editing in the human malaria parasite Plasmodium falciparum using the CRISPR-Cas9 system. Nat Biotechnol 2014; 32:819–21.
12. Witkowski B, Duru V, Khim N, et al. A surrogate marker of piperaquine-resistant Plasmodium falciparum malaria: a phenotype-genotype association study. Lancet Infect Dis 2017; 17:174–83.
13. Amato R, Lim P, Miotto O, et al. Genetic markers associated with dihydroartemisinin-piperaquine failure in Plasmodium falciparum malaria in Cambodia: a genotype-phenotype association study. Lancet Infect Dis 2017; 17:164–73. 14. Noedl H, Se Y, Schaecher K, Smith BL, Socheat D, Fukuda
MM; Artemisinin Resistance in Cambodia 1 (ARC1) Study Consortium. Evidence of artemisinin-resistant malaria in western Cambodia. N Engl J Med 2008; 359:2619–20. 15. Jacob CG, Tan JC, Miller BA, et al. A microarray platform
and novel SNP calling algorithm to evaluate Plasmodium falciparum field samples of low DNA quantity. BMC Genomics 2014; 15:719.
16. Parobek CM, Lin JT, Saunders DL, et al. Selective sweep sug-gests transcriptional regulation may underlie Plasmodium vivax resilience to malaria control measures in Cambodia. Proc Natl Acad Sci U S A 2016; 113:E8096–105.
17. DePristo MA, Banks E, Poplin R, et al. A framework for variation discovery and genotyping using next-generation DNA sequencing data. Nat Genet 2011; 43:491–8.
18. McKenna A, Hanna M, Banks E, et al. The Genome Analysis Toolkit: a MapReduce framework for analyzing next-genera-tion DNA sequencing data. Genome Res 2010; 20:1297–303. 19. Van der Auwera GA, Carneiro MO, Hartl C, et al. From FastQ data to high confidence variant calls: the Genome Analysis Toolkit best practices pipeline. Curr Protoc Bioinformatics 2013; 11:11.10.1–33.
20. Chaorattanakawee S, Lon C, Jongsakul K, et al. Ex vivo piperaquine resistance developed rapidly in Plasmodium falciparum isolates in northern Cambodia compared to Thailand. Malar J 2016; 15:519.
21. Rutvisuttinunt W, Chaorattanakawee S, Tyner SD, et al. Optimizing the HRP-2 in vitro malaria drug susceptibility assay using a reference clone to improve comparisons of
Plasmodium falciparum field isolates. Malar J 2012; 11:325. 22. Saunders DL, Chaorattanakawee S, Gosi P, et al. Atovaquone-proguanil remains a potential stopgap therapy for multi-drug-resistant Plasmodium falciparum in areas along the Thai-Cambodian border. Antimicrob Agents Chemother 2015; 60:1896–8.
23. Dhingra SK, Redhi D, Combrinck JM, et al. A variant PfCRT isoform can contribute to Plasmodium falciparum
resistance to the first-line partner drug piperaquine. MBio 2017; 8:e00303–17.
24. Alexander DH, Novembre J, Lange K. Fast model-based estimation of ancestry in unrelated individuals. Genome Res 2009; 19:1655–64.
25. Browning SR, Browning BL. Rapid and accurate haplotype phasing and missing-data inference for whole-genome association studies by use of localized haplotype clustering. Am J Hum Genet 2007; 81:1084–97.
26. Miotto O, Almagro-Garcia J, Manske M, et al. Multiple pop-ulations of artemisinin-resistant Plasmodium falciparum in Cambodia. Nat Genet 2013; 45:648–55.
27. Zhou X, Stephens M. Genome-wide efficient mixed-model analysis for association studies. Nat Genet 2012; 44:821–4. 28. Price AL, Patterson NJ, Plenge RM, Weinblatt ME, Shadick
NA, Reich D. Principal components analysis corrects for stratification in genome-wide association studies. Nat Genet 2006; 38:904–9.
29. Breiman L. Random forests. Machine Learning 2001; 45:5–32.
30. Liaw A, Wiener M. Classification and regression by ran-domForest. R News 2002; 2:18–22.
31. R Core Team. A language and environment for statistical computing. Vienna, Austria: R Foundation for Statistical Computing, 2016.
32. Barrett JC, Fry B, Maller J, Daly MJ. Haploview: analysis and visualization of LD and haplotype maps. Bioinformatics 2005; 21:263–5.
33. Langmead B, Salzberg SL. Fast gapped-read alignment with Bowtie 2. Nat Methods 2012; 9:357–9.
34. Miles A, Iqbal Z, Vauterin P, et al. Indels, structural vari-ation, and recombination drive genomic diversity in
Plasmodium falciparum. Genome Res 2016; 26:1288–99. 35. Allison AC. Polymorphism and natural selection in human
populations. Cold Spring Harb Symp Quant Biol 1964; 29:137–49.
36. Wang Z, Cabrera M, Yang J, et al. Genome-wide association analysis identifies genetic loci associated with resistance to multiple antimalarials in Plasmodium falciparum from China-Myanmar border. Sci Rep 2016; 6:33891.
37. Van Tyne D, Park DJ, Schaffner SF, et al. Identification and functional validation of the novel antimalarial resistance locus PF10_0355 in Plasmodium falciparum. PLoS Genet 2011; 7:e1001383.