TIME COURSE OF NEUROMUSCULAR ADAPTATIONS DURING HIGH-INTENSITY INTERVAL TRAINING
Jacob A. Mota
A dissertation submitted to the faculty of the University of North Carolina at Chapel Hill in partial fulfillment of the requirements for the degree of Doctor of Philosophy in the Curriculum of
Interdisciplinary Human Movement Science program in the School of Medicine.
Chapel Hill 2020
Approved by: Eric D. Ryan Troy Blackburn David Couper
iii ABSTRACT
Jacob A. Mota: Time course of neuromuscular adaptations during high-intensity interval training (Under the direction of Eric Ryan)
High-intensity interval training (HIIT) is a popular mode of exercise that is safe, time efficient, and effective at improving cardiorespiratory function (peak VO2), but its effects on neuromuscular function are unknown. The purpose of the present investigation was to: 1) determine the time-course of neuromuscular adaptations from modified, low-volume HIIT, 2) to examine the influence of HIIT on spinal and corticospinal excitability, 3) to determine the preliminary effectiveness of HIIT to improve occupational and functional task performance. Forty-six healthy, previously untrained men and women (61% Female; age, 24 ± 5 years; BMI, 23.3 ± 3.0) were recruited for this study. All participants were randomly allocated into a bi-weekly, cycle-based HIIT or control group for 6-weeks. Participants underwent pre- and post-intervention assessments of: body composition, ultrasound derived muscle volume and echo intensity (EI), leg extension and leg press isometric strength, muscle activation and %voluntary activation (%VA), corticospinal (active motor threshold) and spinal (H/MMAX) excitability,
occupational and functional assessments (stair climb, vertical jump, and balance), peak VO2, and time to exhaustion (TTE). Additional ultrasound and leg press strength measures were assessed on three separate occasions within the intervention period (mid-testing). The intervention group performed 10, 1-min bouts of cycling at 90% peak VO2 at each of the 12 training sessions. Data were analyzed using the intention-to-treat framework, with
iv
v
ACKNOWLEDGMENTS
This 11-year journey through higher education was truly a trip, and I am grateful for the ride. As has been said by many others before me, a dissertation is not something that can be completed alone.
Thank you to the National Strength and Conditioning Association Foundation, who awarded me the graduate student research grant to fund my dissertation project. Your
continued support of applied sports science research and student success is a train I am happy to support and promote. To my doctoral advisor Dr. Eric Ryan, thank you for advising me these last few years through the countless document edits, job advice, and helping begin my
independent line of research. To my dissertation committee: Drs. Troy Blackburn, David Couper, Brian Pietrosimone, Abbie Smith-Ryan. Each of you were available at a moment’s notice throughout this project for anything I needed. You were each instrumental in defining the path of my research. Thank you for each of your positive influences on my career.
vi
Mickey Gavino, Eric Trexler, Gena Gerstner, Meg McKenna, Abbie Trivisonno, JC Carr, Ryan Colquhoun, FJ Goodwin, Mitch Margrini, David Church. Thank each of you for your continued support over the last 5+ years. You have truly and consistently been there for me in your own ways, helping me along the way in different capacities which have ultimately led me to this moment.
My acknowledgement would be incomplete without thanking my loving family. To my mom and dad, thank you for sacrificing so much for me and turning me into who I am. I hope you are both proud. To Laura and Sammy, thank you for always keeping me grounded with La Familia. Special thanks to Hope (our dog) for being the friendliest co-author and reviewer ever. Much of this very document was written with you always by my side. Finally, and most
importantly, to my loving wife, Emily. Thank you for being with me every step of the way. You were there from the beginning; from before “research” and “graduate school.” For some strange reason you always believed in me when many others didn’t. For being a constant source of encouragement and support, I love and admire you darling.
vii
TABLE OF CONTENTS
LIST OF FIGURES ... x
LIST OF TABLES ... xi
LIST OF ABBREVIATIONS ... xii
CHAPTER I: INTRODUCTION ... 1
Specific Aims ... 3
Delimitations ... 3
Limitations ... 4
Assumptions ... 4
CHAPTER II: REVIEW OF LITERATURE ... 5
Physical Inactivity ... 5
High-Intensity Interval Training ... 5
Determinants of Muscle Strength ... 7
The influence of resistance training and high-intensity interval training on muscular and neural factors ...12
The time course of neural vs hypertrophic factors during resistance training ...14
Methodology ...16
Specific Aims ...22
Specific Aim 1: To determine the time-course of neuromuscular adaptations from modified low-volume HIIT. ...22
Specific Aim 2: To examine the influence of HIIT on spinal and supraspinal function. ...23
viii
CHAPTER III: METHODOLOGY ...26
Participants and Screening ...26
Study Design ...26
Body Composition ...28
Ultrasound Assessments ...28
Strength Assessments ...30
Surface Electromyography ...31
Direct Quadriceps Muscle Stimulation Procedures ...32
Femoral Nerve Stimulation Procedures ...32
Quadriceps Cortical Excitability ...33
Signal Processing ...34
Occupational and Functional Assessments ...35
Graded Exercise Testing ...37
Exercise Intervention ...38
Statistical Analyses ...38
CHAPTER IV: RESULTS ...41
Participant characteristics ...41
Aim 1 ...41
Aim 2 ...47
Exploratory aim ...49
CHAPTER V: DISCUSSION ...55
Maximal Muscle Strength ...55
Muscle Activation ...56
Muscle Size and Quality ...59
Occupational and Functional Performance ...61
ix
Body Composition ...63
Conclusions ...64
APPENDIX 1: TABLE 1 ...65
APPENDIX 2: TABLE 2 ...66
APPENDIX 3: TABLE 3 ...67
APPENDIX 4: TABLE 4 ...68
x
LIST OF FIGURES
Figure 1: A schematic representation of the experimental design
associated with the proposed study. ...27 Figure 2: CONSORT diagram for study enrollment ...42 Figure 3: Effects of 6-weeks of modified low-volume, cycle-based
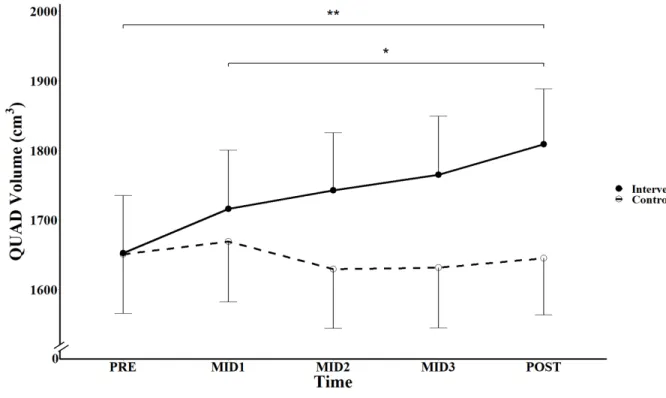
HIIT on total quadriceps muscle volume across time...44 Figure 4: Effects of 6-weeks of modified low-volume, cycle-based
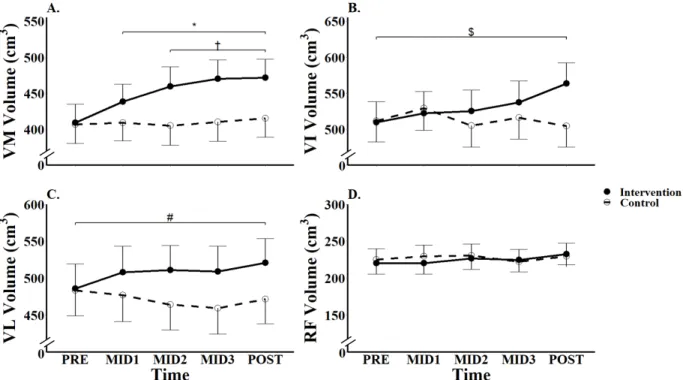
HIIT on vastus medialis (VM; A.), intermedius (VI; B.), lateralis (VL; C.),
and rectus femoris (RF; D.) muscle volume across time ...47 Figure 5: Effects of 6-weeks of modified low-volume, cycle-based HIIT
on anterior reach (AR, A.), posteriolateral reach (PLR, B.),
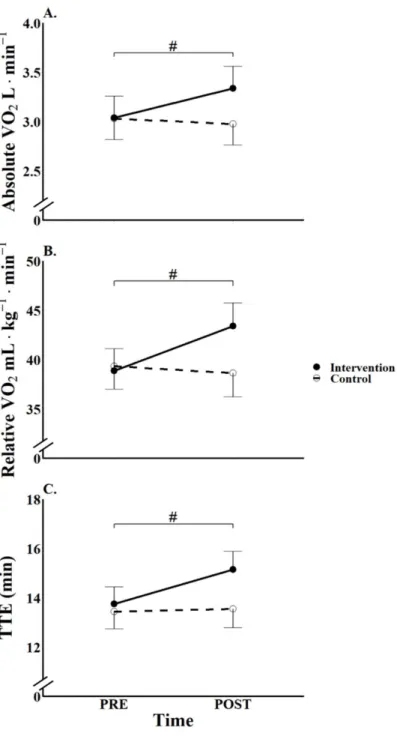
posteriomedial reach (PMR, C.), and composite (D.) values across time. ...51 Figure 6: Effects of 6-weeks of modified low-volume, cycle-based HIIT
on absolute VO2 (A.), relative VO2 (B.), and time to exhaustion (TTE, C.)
xi
LIST OF TABLES
Table 1. Baseline participant characteristics (Mean ± SD)...65 Table 2. Baseline measures of muscle volume and function (Mean ± SD) ...66 Table 3. Baseline outcomes for the graded exercise test, stair climb time,
xii
LIST OF ABBREVIATIONS
%fat Body fat percentage
%VA Percent voluntary activation 4-C 4-compartment model
ACSA Anatomical cross-sectional area AMT Active motor threshold
ANOVA Analysis of variance
BIS Bioelectrical impedance spectroscopy B-Mode Brightness mode
CC Complete Case
DEXA Dual energy x-ray absorptiometry EI Echo intensity
EMG Electromyography FAM Familiarization FFM Fat-free mass
FM Fat mass
HIIT High-intensity interval training HMAX Maximum H-reflex amplitude
ITT Intention-to-treat MEP Motor evoked potential MMAX Maximum M-wave amplitude MV Muscle volume
MVC Maximum voluntary contraction
PF Peak Force
xiii RMS Root mean squared
SD Standard deviation SE Standard error
SEBT Star excursion balance test
SENIAM Surface EMG for the non-invasive assessment of muscles SIT Sprint interval training
TBW Total body water
TMS Transcranial magnetic stimulation TTE Time to exhaustion
VI Vastus intermedius VL Vastus lateralis VM Vastus medialis VO2 Volume of oxygen
1
CHAPTER I: INTRODUCTION
The American College of Sports Medicine recommends at least 150 minutes of moderate-intensity physical activity, or 75 minutes of vigorous-intensity physical activity per week (American College of Sports Medicine, 2018). Unfortunately, over 40% of US adults do not meet the minimum physical activity requirements (Hallal et al., 2012; World Health
Organization, 2009), despite its ability to reduce the risk of many common health conditions including cardiovascular disease, type 2 diabetes, and obesity (Biener et al., 2019). Common barriers to regular exercise include a lack of time and motivation (Reichert et al., 2007).
High-intensity interval training (HIIT) is a mode of exercise that has gained popularity because of its ability to overcome these barriers (among others), is safe and effective for many clinical
populations (Gibala, 2007), and has promising long term adherence rates (Aamot et al., 2016).
Despite its low time requirements, HIIT offers similar or more robust physiological effects on cardiovascular and metabolic health, when compared to traditional long duration, low-to-moderate intensity exercise (Batacan et al., 2017; Kessler et al., 2012).
Although HIIT has traditionally been considered a training modality to improve endurance performance, the intermittent nature and high workloads make it an attractive strategy to concurrently improve neuromuscular function. In fact, some recent studies show initial promise with HIIT demonstrating improvements in neuromuscular function (Blue et al., 2018; Kinnunen et al., 2019; Martinez-Valdes et al., 2017; Vera-Ibañez et al., 2017).
Specifically, an increase in vastus lateralis muscle cross-sectional area, leg extensor strength, and motor unit firing rates have been reported following ≤ 3 weeks of modified low-volume HIIT (Blue et al., 2018; Martinez-Valdes et al., 2017). However, two recent studies have reported
2
following ≤ 4 weeks of HIIT (Kinnunen et al., 2019; Vera-Ibañez et al., 2017). While there is
potential for HIIT to improve neuromuscular function, the few and contrasting initial studies demonstrate the need for a more thorough investigation of the influence of HIIT on
neuromuscular function.
Historically, resistance training is considered the gold standard for improving maximal muscle strength, which is attributed to alterations in both neural (e.g., muscle activation) and hypertrophic (e.g., muscle volume) factors (Aagaard et al., 2001; Aagaard et al., 2002; Enoka, 1988; Krutki et al., 2017; Moritani et al., 1979). Previous resistance training studies have
examined neural and hypertrophic factors during short-term (i.e., ≤ 8 weeks) training periods to identify a time-course of these factors from the onset of training (DeFreitas et al., 2011;
Seynnes et al., 2007; Stock et al., 2017; Stock et al., 2016). Future studies are needed to
extend upon these findings by more thoroughly investigating the time course of the neural- vs hypertrophic-adaptations at the onset of HIIT, while also employing a protocol (i.e., modified low-volume) more commonly utilized in practice. Furthermore, given the potential for HIIT to influence the nervous system (Kinnunen et al., 2019; Martinez-Valdes et al., 2017; Vera-Ibañez et al., 2017), future investigations are needed to examine the potential location(s) of neural adaptation(s) (i.e., spinal, supraspinal) at the onset of HIIT.
Given the documented improvements in endurance performance and potential
improvements in neuromuscular function, it is possible that HIIT may also improve athletic and occupational performance, while targeting common musculoskeletal injury risk factors. For example, previous studies have reported various types of cycling or HIIT interventions (i.e., steady state cycling, repeated all-out sprints) may improve dynamic balance (Bouillon et al., 2009) and vertical jump height (Kinnunen et al., 2019). However, there has not been any investigation into the potential of modified, low-volume, cycle based HIIT on performance and injury risk outcomes. These findings would make HIIT an attractive training modality for a
3 Specific Aims
Specific Aim 1: To determine the time-course of neuromuscular adaptations from modified low-volume HIIT.
Hypothesis 1: It is hypothesized that there will be a progressive increase in maximal muscle strength over the training period, with concurrent increases in muscle activation, and delayed increases in muscle size in the training group when compared to controls.
Specific Aim 2: To examine the influence of HIIT on spinal and supraspinal function. Hypothesis 2: We hypothesize that HIIT will increase spinal (H/MMAX ratio) and supraspinal (AMT) excitability in the training group when compared to controls. Exploratory Aim: To determine the preliminary effectiveness of HIIT to improve occupational and functional task performance.
Exploratory Aim Hypothesis: We hypothesize that HIIT will significantly improve weighted stair climb time, vertical jump performance, and star excursion balance in the training group when compared to controls.
Delimitations
• Participants included both males and females between the ages of 18-35 years of age
and were randomly allocated to intervention or control groups
• Participants were healthy, ambulatory, and were classified as recreationally active,
defined by an exercise history of ≤ 3 hrs/week of vigorous physical activity
• The study consisted of eight testing visits, and an additional 12 “training” visits for those
4 Limitations
• Participants were be recruited from the campus of the University of North Carolina at Chapel Hill and the local community through flyers or word of mouth. Therefore, the sample may not be truly random.
• Findings may not be applicable to individuals below 18 or above 35 years of age, or those who are more than recreationally active.
• The active motor threshold was unable to determine between differences in cortical spinal excitatory or inhibitory adaptations.
• Muscle size was estimated using B-mode ultrasound and regression equations.
Assumptions
• Participants provided accurate self-report data on the health and exercise history enrollment questionnaire
• Participants provide maximal effort during HIIT and VO2MAX testing
• Participants maintain activity levels and dietary habits throughout the intervention period • Participants abstained from sport nutrition products that may influence neuromuscular
adaptations (i.e., creatine monohydrate, beta-alanine)
• Participants were honest regarding compliance with pre-testing instructions • Healthy adults recruited for participation in this study were representative of other
5
CHAPTER II: REVIEW OF LITERATURE
Physical Inactivity
Over 30% of adults worldwide are considered physically inactive (Hallal et al., 2012), and the worldwide prevalence of inactive and insufficiently active adults combined is 58% (World Health Organization, 2009). Physical inactivity is the fourth leading cause of death worldwide (World Health Organization, 2009), and may cause 6-10% of major
non-communicable diseases (i.e., cardiovascular disease, diabetes) (Lee et al., 2012). Furthermore, inadequate physical activity may contribute to over $130 billion in health care expenditures per year (Carlson et al., 2015; Ding et al., 2017). Many previous studies have indicated regular participation in exercise and physical activity may decrease complications from cardiovascular disease (Haskell et al., 2007), diabetes (Nelson et al., 2007), and various other health disorders (i.e., obesity) (Physical Activity Guidelines Advisory Committee, 2018; Piercy et al., 2018; Warburton et al., 2010).
High-Intensity Interval Training
High-intensity interval training (HIIT) has been studied as an effective exercise modality for improving cardiorespiratory function for decades (Allemeier et al., 1994; Bayati et al., 2011; Boutcher, 2010; Buśko et al., 2008; Creer et al., 2004; Harridge et al., 1998; Laursen et al.,
2002; Perrey et al., 2010; Sleivert et al., 1995; Thorstensson et al., 1975). Classically, HIIT
6
examining HIIT protocols using various types of cycle ergometers (i.e., mechanically, electronically, or air braked) (Allemeier et al., 1994; Buśko et al., 2008; Creer et al., 2004; Harridge et al., 1998; Hwang et al., 2019; Sleivert et al., 1995; Vera-Ibañez et al., 2017), though
HIIT has also been utilized in other exercise modalities such as with treadmills (Aamot et al., 2016; Kohn et al., 2011; Lattier et al., 2004; Schaun et al., 2019; Thorstensson et al., 1975;
Wiewelhove et al., 2018), swimming (Mohr et al., 2014) or with “hill sprints” (Kinnunen et al.,
2019).
It is possible to manipulate classic HIIT programs by adjusting the time, intensity,
volume, and exercise modality. Accordingly, due to the high intensity required to perform sprint HIIT protocols, adjustments have been made to increase its utility and application. Modified, low-volume HIIT has been proposed as a more approachable version of HIIT, and is
characterized by programs that use a 1:1 work:rest ratio at high intensities (e.g., 85 – 95%
maximum heart rate or peak power) vs. “all-out” sprints for ≤ 30 s (Bayati et al., 2011; Gillen et al., 2014; Little et al., 2010). Despite deviations from the classical version, modified low-volume HIIT programs can be performed in ≤ 30 minutes (i.e., time efficient) and it may still be just as
effective as traditional endurance exercise (Bayati et al., 2011; Granata et al., 2016; Harridge et al., 1998; Laursen et al., 2002; Metcalfe et al., 2012), thereby allowing it to overcome common
barriers to exercise (i.e., lack of time, motivation) and achieve high long-term adherence rates (Aamot et al., 2016; Reichert et al., 2007; Thum et al., 2017). It is also likely that HIIT may be able to upregulate both glycolytic and oxidative enzymatic activity, particularly in type II fibers (Billat, 2001; MacDougall et al., 1998), increase fat oxidation (Essen et al., 1977), and improve
skeletal muscle buffering capacity (Stepto et al., 1999), though these mechanisms may differ between upper- and lower-extremities (Zinner et al., 2016). In addition to improving skeletal muscle function, HIIT may also positively impact a variety of health disorders. Indeed, previous works suggest that, when compared to moderate-intensity continuous exercise, HIIT may
7
Little et al., 2010), which may improve glycemic control or insulin sensitivity in individuals with diabetes (Batacan et al., 2017; Kessler et al., 2012; Nybo et al., 2010). Furthermore, due to HIIT’s ability to improve VO2 max, endothelial function, and triglycerides, it may serve as an intervention for individuals suffering from cardiovascular disease (i.e., coronary heart disease, peripheral artery disease) (Batacan et al., 2017; Cornish et al., 2011; Currie et al., 2013; Elliott et al., 2015; Lee et al., 2018; Nybo et al., 2010; Rognmo et al., 2004; Swain et al., 2006; Wisloff
et al., 2007).
Determinants of Muscle Strength
Muscle strength may be defined as the maximum force or torque a muscle can produce (Enoka, 1988; Semmler et al., 2000). Maximal muscle strength is influenced by various factors
including muscle size, composition, and architecture, muscle activation and co-activation, biomechanical factors, and various muscle fiber type specific properties.
Muscle size
Maximal muscle strength is often considered to be influenced by muscle size (Bamman et al., 2000; Gilliver et al., 2009; Krivickas et al., 2011). Traditional measures of muscle size (i.e., lean mass, cross sectional area, muscle thickness) commonly demonstrate positive associations between size and strength (r = 0.146 – 0.823) (Balshaw et al., 2017; Bamman et al., 2000; Castro et al., 1995; Erskine et al., 2014; Ikegawa et al., 2008; Maughan et al., 1983a; Maughan et al., 1983b; Trezise et al., 2016). When examined at the level of the muscle fiber,
8
fascicle length, and has been suggested to be a more appropriate assessment of muscle size in pennate muscles (Erskine et al., 2011; Erskine et al., 2009).
Muscle composition
When examining muscle size, it is also important to account for the accumulation of non-contractile tissues, which include inter- and intra-muscular fat and/or connective tissue. Recent works have suggested that intramuscular fat may influence muscle fiber contraction properties (Choi et al., 2015) or tissue structure (Rahemi et al., 2015) which may influence force
production. Specifically, a higher infiltration of non-contractile tissue within a muscle (i.e., lower muscle quality) decreases contraction speed and power capabilities of a muscle fiber (Choi et al., 2015; Rahemi et al., 2015). This concept is supported by studies finding a negative relationship between muscle quality (assessed through ultrasound echo intensity) and rate of velocity development (Jenkins et al., 2015; Mota et al., 2018) and strength (Fukumoto et al., 2012; Mota et al., 2017a; Watanabe et al., 2013b).
Muscle architecture
Muscle architecture (i.e., pennation angle, fascicle length) directly influence muscle strength (Trezise et al., 2016). Pennation angle is defined as the angle between a muscle fascicle and its intersection with the aponeurosis. It has been suggested that pennation angle represents the amount of sarcomeres in parallel and directly influences maximal muscle force (Jones et al., 1987; Kawakami et al., 1993). Specifically, as pennation angle increases, the
force developed at the tendon decreases as a function of cosine of pennation angle (Kawakami et al., 1993; Powell et al., 1984; Sacks et al., 1982). This relationship is further supported by
9
trained individuals with large amounts of muscle, and subsequently large pennation angles (i.e., bodybuilders), may not have the same force generating capacity of similarly trained individuals with lesser pennation angles (i.e., weightlifters) (Ikegawa et al., 2008). Fascicle length
represents the amount of sarcomeres in series, which influences the maximum shortening velocity of a given muscle (Bodine et al., 1982; Powell et al., 1984; Sacks et al., 1982; Spector et al., 1980). Fascicle length of lower limb muscles have been shown to be greater in elite
sprinters and sumo wrestlers compared to long distance athletes and recreationally active individuals, respectfully (Abe et al., 2000b; Kearns et al., 2000).
Muscle activation
The motor unit is the final common pathway by which the central nervous system controls movement. The recruitment and rate modulation of motor units, depends on the interaction between the synaptic input received by the motor neuron pool and the intrinsic properties of the motor neurons (Basmajian et al., 1957; Datta et al., 1990; De Luca et al., 2010; Van Cutsem et al., 1998). The number of action potentials discharged by the motor neurons innervating the muscle constitutes the neural drive from the spinal cord to the muscle
10
firing rates) may influencing the signal (Farina et al., 2004, 2014). To overcome these
limitations, previous studies have suggested normalizing surface EMG amplitude to the maximal peak-to-peak M-wave (Lanza et al., 2018; Millet et al., 2011). It has been suggested that
normalizing surface EMG to the maximal M-wave accounts for peripheral changes in membrane excitability and provides an indicator of central drive (Millet et al., 2011; Rodriguez-Falces et al., 2018).
An additional approach to examine muscle activation includes the interpolated twitch technique to evaluate the capacity of the central nervous system to activate skeletal. The interpolated twitch technique uses a ratio of the force increment during a maximal contraction at the time of stimulation (i.e., superimposed twitch) to the torque generated from a control twitch (i.e., potentiated twitch) to serve as an estimation of percent voluntary activation (Shield et al., 2004). While untrained, healthy adults are able activate much of their contractile tissue, injured or diseased populations may be unable to (which may negatively impact force production
capabilities) (Hurley et al., 1994; Nørregaard et al., 1994; Nørregaard et al., 1995). Additionally, antagonist muscle co-activation may impact net joint moment (i.e., the joint moment generated by the agonist muscles minus that of the antagonist muscles) (Aagaard et al., 2000; Kellis, 1998; Kellis et al., 1997). While antagonist muscle co-activation may provide increased joint
stability in dynamic contractions (Kellis, 1998), it is possible that co-activation may be as high as 30% and may therefore play a significant role in the maximum force production capabilities of an agonist muscle group (Carolan et al., 1992; De Vito et al., 2003; Macaluso et al., 2002).
Biomechanics
11
properties (i.e., muscle size and activation) suggest that the moment arm may have limited influence on force production (Erskine et al., 2009; Trezise et al., 2016). However, calculating moment arm length is required to examine the intrinsic force production of skeletal muscle (i.e., specific force) (Erskine et al., 2009; Trezise et al., 2016). It is also possible that muscle force not only travels in a direct line from the sarcomere to the tendon, but also laterally through myofascial and extracellular matrix components (Huijing et al., 2005; Street, 1983). The lateral transmission of force can be influenced by the connective tissues within and surrounding the muscle, though it’s true impact on maximal muscle strength is dependent on relative location within the muscle (i.e., proximal, distal) and requires further investigation (Huijing et al., 2005; Street, 1983).
Fiber type
Whole muscles are composed of various fiber types that may influence whole muscle force production. While at least 6 fiber types (I, IC, IIC, IIA, IIAX, IIX) exist (Staron et al., 2012), skeletal muscle fibers are often categorized into two distinct categories, slow- and fast-twitch as determined through myosin heavy chain (MHC) composition (i.e., MHC I, MHC II) (Bottinelli et al., 1996; Harridge et al., 1998; Stienen et al., 1996). The proportions of these MHC isoforms have been shown to reflect contractile force-velocity properties. For instance, muscles that contain a greater proportion of MHC II isoforms are able to produce greater contractile force and power (Aagaard et al., 1998; Edstrom et al., 1972). This was shown in a classic study by
Aagaard et al. (1998) who reported the percentage of MHC II isoforms in the vastus lateralis
12
The influence of resistance training and high-intensity interval training on muscular and neural factors
Changes in muscle size and architecture
Many previous studies have indicated that resistance training (of sufficient duration) results in increases in the size of the whole muscle and individual muscle fibers, due to
increases in myofibrillar size and number (Aagaard et al., 2001; Harridge et al., 1999; Haun et al., 2019a; Haun et al., 2018; Hubal et al., 2005; Kawakami et al., 1995; Morton et al., 2018;
Narici et al., 1996; Narici et al., 1989; Psilander et al., 2019; Reeves et al., 2004; Tesch et al.,
2004; Verdijk et al., 2009; Walker et al., 2014). Muscle hypertrophy (increase in muscle size) is caused by an increase in muscle protein synthesis beyond that of muscle protein breakdown (i.e., positive net protein balance). Protein synthesis may be initiated through a variety of molecular pathways via mechanical or nutritional stimuli (i.e., resistance training, protein ingestion) (Glass, 2005; Hornberger, 2011; Ogasawara et al., 2016; Ogasawara et al., 2019; You et al., 2018). While the specifics of the various protein synthesis stimulating pathways are
complex, many are targeted through downstream effects of the Akt/mammalian target of rapamycin (mTOR) and p70S6 Kinase pathways (Atherton et al., 2012; Glass, 2005), and this may be impacted by relative load (e.g., percentage of maximal strength; percentage of one repetition maximum) (Lysenko et al., 2019). While the accumulation of protein synthesis over time causes an increase in muscle size (or mass), the process of satellite cell proliferation may begin only hours after an exercise session, which is linked to muscle hypertrophy (Bell et al., 2015; Bellamy et al., 2014). Various factors may further influence the hypertrophic response from training including contraction mode (Ato et al., 2019; Lysenko et al., 2019), satellite cell content (Bellamy et al., 2014), pre-training muscle size (Haun et al., 2019a), androgen receptor content (Morton et al., 2018), age (Hakkinen et al., 1998; Welle et al., 1996), and/or sex
13
architecture. For example, previous studies have reported increases in pennation angle and fascicle length (Aagaard et al., 2001; Blazevich et al., 2003; Kawakami et al., 1995; Reeves et al., 2004; Valamatos et al., 2018). However, not all studies report a change in fascicle length
(Erskine et al., 2011; Erskine et al., 2010) or pennation angle (Baroni et al., 2013). The lack of consistency in regards to changes in muscle architecture may be due to the contraction mode, as eccentric exercises more frequently cause an increase in fascicle length, while concentric muscle actions cause an increase in pennation angle (Ato et al., 2019)
Neural adaptations
Resistance training may influence muscle activation (Aagaard, 2003; Aagaard et al., 2002b; Aagaard et al., 2000; Balshaw et al., 2017; Pucci et al., 2006; Walker et al., 2014). For
example, many studies have shown an increase in EMG amplitude (Aagaard, 2003; Aagaard et al., 2002a; Pucci et al., 2006) or percent voluntary activation (Erskine et al., 2011; Reeves et al., 2004) following training, though conflicting reports of no change in muscle activation exist (Garfinkel et al., 1992; Harridge et al., 1999; Narici et al., 1996; Reeves et al., 2005; Weir et al., 1995). The increase in muscle activation (i.e., EMG amplitude, percent voluntary activation) may be related to an increase in the occurrence of doublet firings when examining single motor unit function after dynamic training in healthy adults (Van Cutsem et al., 1998), increased spinal excitability (Nordlund Ekblom, 2010), maximal motor unit firing rates (Del Vecchio et al., 2019; Kamen et al., 2004), or enhanced reflex potentiation (Aagaard et al., 2002b; Milner-Brown et al., 1975). However, conflicting reports on the ability for resistance training to alter motor unit firing
14
able to reach full motor unit activation prior to the exercise intervention (Gandevia et al., 1996; Garfinkel et al., 1992; Harridge et al., 1999; Narici et al., 1996).
High intensity interval training
Although there are very few studies that have examined the influence of HIIT on various neuromuscular factors, initial studies show promise. For example, Blue et al. (2018) reported an increase in vastus lateralis muscle CSA after just 3 weeks of cycle-based HIIT, and no changes in ultrasound EI values suggesting these improvements were likely not due to swelling often seen during delayed onset muscle soreness. In addition, recent papers have shown increases in leg extensor strength and firing rates of high threshold motor units (Martinez-Valdes et al., 2017) and increased spinal reflex excitability without a change in plantar-flexor
strength (Vera-Ibañez et al., 2017) using modified low-volume and repeated Wingate HIIT protocols, respectively. Though, a recent report presents conflicting evidence, suggesting that the use of a different HIIT protocol (repeated hill-sprints) did not demonstrate alterations in spinal responses following 2.5 weeks of training in trained female athletes (Kinnunen et al., 2019). However, the authors did report a significant increase in plantar flexor strength and supraspinal excitability (i.e., V-wave:Maximal M-wave ratio), in addition to a decrease in antagonistic co-activation (Kinnunen et al., 2019). Given the aforementioned ability for HIIT to improve cardiovascular function, and its ability to stimulate muscle protein synthesis (Bell et al., 2015), further studies should focus on the ability for HIIT to alter neuromuscular function.
The time course of neural vs hypertrophic factors during resistance training
Original classic work suggests that the time-course of strength adaptations from an exercise intervention are due primarily to neural adaptations, with hypertrophic adaptations occurring only after 8+ weeks (Moritani et al., 1979). However, as many studies report that
15
associated with muscle hypertrophy) (Bickel et al., 2005) or shifts in fiber type percentages (Staron et al., 1994) can occur in a matter of hours after exercise, the potential for an
accumulation of whole-muscle hypertrophy in a time period ≤ 8 weeks is possible. Furthermore, it is likely that a major limitation in previous works is that the measures used to assess muscle hypertrophy were not sensitive enough to detect it at the whole muscle level (e.g., skinfold and limb circumference estimations of muscle CSA). More recent studies have begun to provide support that muscle hypertrophy may occur much earlier (DeFreitas et al., 2011; Loenneke et al., 2017; Seynnes et al., 2007; Stock et al., 2017; Stock et al., 2016; Tesch et al., 2004) using a
variety of more sensitive measures (i.e., MRI, CT, DEXA). For example, Seynnes et al. (2007) used magnetic resonance imaging (MRI) to examine the time-course of hypertrophy using a novel, fly-wheel based leg extension machine and reported a significant increase in muscle size after 20 days of exercise. This finding was supported by DeFreitas et al. (2011) and Stock et al. (2016) who reported a significant increase in muscle size after three and four weeks of training, respectively. Perhaps most interestingly, DeFreitas et al. (2011) reported an increase in muscle size (measured via pQCT) after just one week of training. However, the authors (DeFreitas et al., 2011) note that the increase in muscle size after one week could have been due to other factors (i.e., edema), and suggest that a meaningful increase in size was present after three weeks. To more appropriately account for edema’s effect on muscle size, the authors statistically examined changes in CSA relative to week one, where they believe the greatest amount of muscle damage (and therefore, swelling) may have occurred (DeFreitas et al., 2011). The authors suggest that, after accounting for any muscle damage, there was a significant increase in muscle CSA after three weeks of training (DeFreitas et al., 2011).
16
previously untrained men. Based on changes in the ratio of ultrasound echo intensity (a measure of pixel brightness) to muscle CSA, Damas et al. (2016) suggested that increased muscle size within the first three weeks of training were due to edema and not hypertrophy itself. In response, a recent report by Stock et al. (2017) examined the effects of four weeks of concentric only arm flexor training on muscle size in previously untrained men. The authors (Stock et al., 2017) reported that increases in muscle thickness and lean mass (assessed
through DEXA) were present following three and four weeks of training, respectively, without a significant change in echo intensity or self-reported muscle soreness. While this recent work suggests it may be possible for an increase in muscle size to be present without detected muscle damage, future studies using more sensitive measures of muscle size (i.e., muscle CSA) in conjunction with measures of muscle damage (i.e., ultrasound echo intensity) are needed to further examine the time-course of neural- vs. hypertrophic-adaptations to exercise.
Methodology
Measures of muscle size
Measures of muscle size and/or mass have been studied for decades (Goldspink, 1964; Helander, 1961), however imaging modalities such as dual-energy X-ray absorptiometry, computed tomography, ultrasound, and magnetic resonance have risen in popularity in recent years (Haun et al., 2019b; Heymsfield et al., 2014; Kane et al., 2004; Prado et al., 2014).
Dual-energy X-ray absorptiometry
17
al., 2014). During the assessment, a low-dose of ionizing radiation x-rays of two different photon energy levels pass through the body and are measured by a photon detector which assesses the amount of signal attenuation by soft tissue and bone at each pixel (Roubenoff et al., 1993). Though DEXA provides a dose of ionizing radiation (1-10 µSv, depending on unit type; similar to one day of background radiation), it is much less than that of other imaging modalities (i.e., computed tomography, discussed below) (International Atomic Energy Agency, 2011), while also being easier to use and less expensive (Heymsfield et al., 1997). While DEXA has been validated to provide mass, density, and volume measurements of biological tissues (International Atomic Energy Agency, 2011; Smith-Ryan et al., 2017), it’s validity to accurately assess skeletal muscle mass (i.e., lean body mass) has been questioned by some (Nelson et al., 1996; Schoeller et al., 2005; Tylavsky et al., 2003). When compared against reference standards (i.e., computed tomography), DEXA has been suggested to underestimate the true change in lean mass of the thigh over time (Delmonico et al., 2008), though this may be improved upon with small, custom regions of interest (Hansen et al., 2007; Nana et al., 2015). This is an important factor to consider, especially in short-term intervention studies where the changes in mass may be minimal. Furthermore, DEXA is unable to distinguish between muscle groups (i.e., quadriceps vs. hamstrings of the thigh), and it can be influenced by hydration status (Nana et al., 2015). Despite these shortcomings, DEXA may still be used as a reliable measure of gross and regional lean body mass.
Computed tomography
18
density). Standard reference ranges exist for various structures (i.e., bone, skeletal muscle, adipose tissue) which allow for their identification. CT is considered a reference standard for its ability to track changes in skeletal muscle size over time with high reliability (ICC ≥ 0.997) and
low coefficients of variation (0.6%) across repeated scans of muscle CSA (Verdijk et al., 2009). However, CT scanning exposes subjects to much larger doses of ionizing radiation (routine body CT scan = ~10000 µSv) compared to DEXA (International Atomic Energy Agency, 2011) and is much more expensive per scan, which may not make it ideal for longitudinal research studies (Prado et al., 2014).
Ultrasound imaging
Ultrasound imaging is a common, non-invasive imaging modality used for body and muscle composition research, in addition to various clinical applications. Images are created when an ultrasound signal is propagated through the skin and subsequent tissues, with a portion of the original signal then reflected back to the transducer when the signal encounters underlying tissues such as subcutaneous adipose tissue, skeletal muscle, or bone (Daniels et al., 2013; Smith et al., 2010). The degree of signal reflection is proportional to acoustic impedance (i.e., how likely it is to attenuate sound signals); air will absorb all of the signal, whereas bone will reflect much more back to the source. When the reflected signal is received by the transducer, it is converted into electronic signal and processed by a computer, which is then used to form into a 2-dimentional image (Daniels et al., 2013). Various utilities of
ultrasound imaging have been popularized in skeletal muscle research, two of which are muscle thickness and CSA assessments.
19
muscle. Though muscle thickness is a reliable measure (intra-class correlation coefficient (ICC) range = 0.65–0.94) (Thoirs et al., 2009), it only assesses muscle in one dimension and may not appropriately represent muscle size. Therefore, while muscle thickness assessed by B-mode ultrasound may be fast and reliable, it may misrepresent the muscle of interest by not
encompassing the available contractile tissue in its entirety (Vigotsky et al., 2018b). Muscle CSA can be assessed using the extended field of view function in many
commercially available ultrasound machines (Cooperberg et al., 2001). Extended field of view ultrasound imaging utilizes image software to “stitch” together a series of B-mode ultrasound images which can together be reconstructed to form a single, 2-dimensional image that is larger than the field of view of the ultrasound probe (Cooperberg et al., 2001; Lichtwark, 2017). To assess cross sectional area of a muscle, a researcher can utilize image processing software to trace a region of interest (i.e., a given muscle belly) that includes as much muscle as possible without including the surrounding fascia (Mota et al., 2018; Rosenberg et al., 2014). This technique has been found to be reliable in the assessment of muscle ACSA and architecture (McMahon et al., 2016; Nelson et al., 2016; Rosenberg et al., 2014). However, while ultrasound derived ACSA scans agree well with CT imaging (Noorkoiv et al., 2010), they are typically lower than what is found in magnetic resonance imaging scans (Scott et al., 2012). Further, error associated with ultrasound imaging can be heavily influenced by the experience level of an ultrasound technician, as any variance in pressure by the ultrasound probe to the skin may influence the outcome measure (Dankel et al., 2018). Given these limitations, ultrasound is still considered an excellent method of determining muscle size due to it being non-invasive,
reliable, and cost-effective.
Magnetic resonance imaging
20
being generated in a structure of interest (e.g., skeletal muscle) which aligns the available hydrogen nuclei into a single direction (Smith et al., 2010). After which, a radiofrequency pulse is applied and the signal to be absorbed by hydrogen protons present within the tissue. The hydrogen protons release energy after cessation of the radiofrequency pulse and the protons return to their original orientation (i.e., resonance) (Smith et al., 2010). This release of energy is detected by a receptor and used to create the images, with tissues containing different densities of hydrogen atoms (e.g., adipose tissue vs. skeletal muscle tissue) having different relaxation times, thus creating the contrast within the image (Jordan et al., 2013; Smith et al., 2010). Image analyses software can then determine volume, area, or mass of tissues based on the voxel (volume and pixel) information and known density values for specified tissue. As MRI does not require ionizing radiation for its contrast source, it is safe for longitudinal research. While MRI produces high quality, reliable images (Smeulders et al., 2010), it carries a heavy financial burden per scan and requires great technical experience to for image analyses.
Measures of spinal reflexes
The Hoffman (H) reflex has been used in a number of studies as an estimate of alpha motor neuron excitability (Palmieri et al., 2004; Pierrot-Deseilligny et al., 2000; Zehr, 2002). Percutaneous electrical stimulation of a peripheral nerve is used to elicit the H-reflex, which is measured as an EMG signal response representing action potentials that are generated by alpha motor neurons traveling through efferent fibers from the spinal column to the
Vila-21
Chã et al., 2012). There are a variety of factors to consider when assessing the H-reflex including stimulus constancy (e.g., relative placement of stimulating electrode on the nerve), post-activation depression (e.g., stimulus timing after activation), in addition to the H-reflex being potentially dependent on body position and background relaxation levels (Pierrot-Deseilligny et al., 2000; Zehr, 2002). However, these limitations may be overcome by normalizing the maximal H-reflex with the maximal M-wave, or only assessing H-reflex at a known percentage of maximal M-wave along the recruitment curve (e.g., 15% maximal M-wave) (Carroll et al., 2011; Pierrot-Deseilligny et al., 2000; Zehr, 2002).
Measures of supraspinal activity
Volitional movement first requires input from the corticospinal motor neurons to the spinal motor units which innervate skeletal muscles. Transcranial magnetic stimulators have risen in popularity recently due to their ability to study motor cortex excitability (Barker et al., 1985; Kidgell et al., 2017; Sanes et al., 2000). Transcranial magnetic stimulation can activate
cortical neurons through a rapidly changing magnetic field targeted to the motor cortex and is detected as a muscle response on an EMG signal, termed motor evoked potential (MEP) (Groppa et al., 2012). One parameter used to study corticospinal excitability is the motor threshold, which is defined as the lowest stimulus required to evoke a measurable MEP at least 50% of the time (Kalmar, 2018; Luc et al., 2014; Pietrosimone et al., 2013). The motor
threshold represents the corticospinal excitability of corticospinal neurons within the motor cortex, as well as excitability of motor neurons within the spinal cord (Rossini et al., 1994; Rossini et al., 2015; Rossini et al., 2007). A higher motor threshold is suggestive of decreased
22
previous meta-analysis has suggested that strength training does not influence motor threshold (Kidgell et al., 2017). However, as many of these works examined motor threshold in a resting
muscle (i.e., resting motor threshold), it is possible that motor thresholds measured during a relatively light muscle contraction (i.e., active motor threshold) may provide further insight to motor cortex plasticity (Groppa et al., 2012; Kidgell et al., 2017). Examining active motor threshold may reduce the temporal dispersion of the induced volleys, which increases the efficacy of TMS compared to resting muscles (Groppa et al., 2012).
Specific Aims
Specific Aim 1: To determine the time-course of neuromuscular adaptations from modified low-volume HIIT.
Hypothesis 1: It is hypothesized that there will be a progressive increase in maximal muscle strength over the training period, with concurrent increases in muscle activation, and delayed increases in muscle size in the training group when compared to controls
An increase in maximal muscle strength has been reported to occur following strength training interventions (Aagaard et al., 2001; DeFreitas et al., 2011; Moritani et al., 1979; Seynnes et al., 2007; Staron et al., 1994; Stock et al., 2017; Stock et al., 2016) and may occur following cycle-based exercise programs (Buśko et al., 2008). As discussed above, the training-related adaptations in strength may be due to several mechanisms including alterations in muscle size (Aagaard et al., 2001; Harridge et al., 1999; Haun et al., 2019a; Haun et al., 2018; Hubal et al., 2005; Kawakami et al., 1995; Morton et al., 2018; Narici et al., 1996; Narici et al., 1989; Psilander et al., 2019; Reeves et al., 2004; Tesch et al., 2004;
23
neural drive (Aagaard, 2003; Aagaard et al., 2002a; Erskine et al., 2011; Pucci et al., 2006; Reeves et al., 2004). While the specific time-course of adaptations from HIIT has yet to be investigated, it is likely that a similar time-course of training related neuromuscular adaptations may occur compared to traditional resistance training. Furthermore, for individuals who refrain from exercise over a similar period of time, it is possible that no-change or a decrease in maximal muscle strength may occur. As is such, we
hypothesize that there may be a progressive increase in maximal muscle strength, with concurrent increases in muscle activation, and delayed increases in muscle size, in the training group when compared to non-exercise controls.
Specific Aim 2: To examine the influence of HIIT on spinal and supraspinal function.
Hypothesis 2: We hypothesize that HIIT will increase spinal (H/MMAX ratio) and supraspinal (AMT) excitability in the training group when compared to controls. The plasticity of the nervous system remains a popular and relevant area of
24
neuromuscular adaptation may occur (Morton et al., 2019). Therefore, we hypothesize that HIIT may increase spinal (H/MMAX ratio) and supraspinal (AMT) excitability in the training group when compared to controls, as seen in previous investigations (Aagaard et al., 2002b; Griffin et al., 2007; Mason et al., 2018).
Exploratory Aim: To determine the preliminary effectiveness of HIIT to improve occupational and
functional task performance.
Exploratory Aim Hypothesis: We hypothesize that HIIT will significantly improve weighted stair climb time, vertical jump performance, and star excursion balance in the training group when compared to controls.
As HIIT has many documented improvements in endurance/cardiovascular function in addition to the potential improvements in neuromuscular function, it is possible that HIIT may influence athletic and occupational performance, while also targeting common musculoskeletal injury risk factors. Given the high prevalence of obesity and musculoskeletal injuries in the tactical workplace (Jahnke et al., 2013; Mota et al., 2019; Poston et al., 2011), public safety administrators seek interventions that improve injury risk factors and worker health, while also being time efficient. If HIIT were found to be able to improve functional or occupational performance, it may serve as an attractive training modality to a number of populations where time constraints are high and available time is low. The stair climb is a critical, occupation specific task. Given the potential for increased neuromuscular function (i.e., strength) in the lower limbs, it is possible that HIIT may improve stair climb time. Vertical jump is often used as a functional measure of neuromuscular performance and may similarly improve as a function of training related improvements, as seen with traditional resistance training interventions
25
26
CHAPTER III: METHODOLOGY
Participants and Screening
We recruited forty-six healthy men and women, from the local community to participate in this study (Table 1). We excluded those who recently (≤ 3 months) participated in structured HIIT, team-sports, and/or lower-body resistance type exercise (Psilander et al., 2019), or those who have gained or lost 10 or more pounds in the previous month. Furthermore, through the use of a health history questionnaire and transcranial magnetic stimulator (TMS) screener, we also excluded those with: 1) any known cardiovascular, metabolic, or neuromuscular disorders or injuries that may make it unsafe for them to participate in HIIT, 2) a history (≤ 3 months) of ≥ 3 hrs/week of vigorous physical activity (e.g., running, or moderate bicycling at 12-14 MPH), 3) a history of lower extremity surgery, 4) a recent (≤ 3 months) musculoskeletal injury or otherwise
experiences pain in the lower extremities during exercise, 5) the inability to abstain from
tobacco, alcohol, and exercise within 24 hours and caffeine within 8 hours of testing, 6) a history
(≤ 3 months) of regular usage of nutritional or sports supplements designed to augment
performance (i.e., creatine monohydrate, beta-alanine), 7) implanted devices in the brain (i.e., deep brain stimulators, cochlear implants), 8) a history of epilepsy, and 9) a recent (≤ 6 months)
concussion or unresolved concussive symptoms.
Study Design
27
control (n = 22; 59.1% female) group. Participants were not aware of their group designation until after the completion of the familiarization trial. The randomization process was performed with a random number generator prior to study initiation. In addition to a thorough familiarization session (FAM), all participants performed separate pre- (PRE 1 and 2), mid- (MID 1, 2, and 3), and post-intervention (POST 1 and 2) testing. The first testing visits at both PRE and POST included body composition, ultrasonography, nerve stimulation (i.e., H-reflex), a multi-joint strength assessment, and the stair climb. The second testing visits at both PRE and POST included a comprehensive neuromuscular assessment (including TMS and M-wave), a graded exercise test on a cycle ergometer, and functional performance assessments (i.e., vertical jump and balance). Furthermore, all participants returned to the Neuromuscular Assessment
Laboratory every 1.5 weeks (i.e., after every three training sessions for those in the intervention group; Figure 1) to perform additional neuromuscular assessments (i.e., muscle activation and size) to assess the time course of neural and hypertrophic adaptations associated with HIIT. All testing was performed on the dominant limb, determined by which limb the participant would use to kick a ball (Hunter et al., 2000). Those randomly assigned to the intervention group were asked to return to the laboratory two additional times per week for six weeks (twelve total
training sessions) to perform programmed, modified low-volume HIIT. Those randomly
allocated to the control group attended all testing sessions (PRE, MID 1, MID 2, MID 3, POST), but did not perform the exercise intervention and were asked to maintain their habitual physical activity levels throughout their time in the study.
28 Body Composition
Total percent body fat (%fat) was determined using a 4-compartment (4-C) model (Wang et al., 2002). The 4-C equation was used to determine fat mass (FM), fat free mass (FFM), and %fat from measurements of total body volume and bone mineral from dual-energy X-ray
absorptiometry (DEXA), in addition to total body water from bioelectrical impedance spectroscopy (BIS) (Smith-Ryan et al., 2017).
Following an 8-hr fast before (PRE1) and after (POST1) the intervention period, body
volume and total body bone mineral content was determined via DEXA (Lunar iDEXA, GE Healthcare, Chicago, IL). Whole body fat mass, lean mass, and bone mineral was assessed to estimate body volume (Smith-Ryan et al., 2017). Prior to the scan, participants were placed on the scanning table in accordance with manufacture instructions, wearing athletic clothing and free of any metallic objects. All participants were instructed to remain still throughout the entire scan.
A multi-frequency BIS (SFB7, ImpediMed, Queensland, Australia) has been validated to assess total body water (TBW) (Moon et al., 2009). Participants were asked to lie supine on an examination table, with their shoe and sock removed from their right foot. Two single tab electrodes were placed at the distal end of the participant’s right wrist and hand, and right ankle and foot, with 5 cm between each respective set of electrodes. Prior to electrode placement, the skin was prepared using isopropyl alcohol to remove any interference. The BIS estimates TBW and body composition by conducting a harmless and imperceptible electrical current through the body.
Ultrasound Assessments
29
intermedius (VI) anatomical cross-sectional area (ACSA; cm2) were assessed with a portable, brightness mode (B-Mode) ultrasound imaging device (LOGIQ e 5, General Electric Company, Milwaukee, WI) in conjunction with a multi-frequency linear-array probe (12L-RS, 5-13 MHz, 38.4 mm field of view, General Electric Company, Milwaukee, WI) using the extended field of
view function. As to not influence the shape of the muscle, a minimal and consistent amount of pressure was applied to the skin during scanning. The ultrasound probe was covered in
generous amounts of acoustic coupling gel to enhance image acquisition and the image settings were optimized per participant and are then held constant throughout the study. ACSA scans were taken of the VL, VI, and RF at 25%, 50%, and 75% of the muscle length, as assessed with
ultrasound. As found through extensive pilot testing, the shape of the VM differs from that of the VL and RF, and more distal scans are less feasible. Thus, scans were taken at 33%, 50%, and 66% of the length of the VM muscle.
All images were analyzed in an open source imaging program (ImageJ, National Institutes of Health, Bethesda, MD) and scaled from pixels to centimeters prior to analyses. Each ACSA was measured by selecting a region of interest that includes as much muscle as possible without including the surrounding fascia, as done in previous studies (Mota et al., 2018; Mota et al., 2017a; Mota et al., 2017b). Echo intensity (EI) was averaged from each ACSA scan
(e.g., 25, 50, 75% of the muscle length) for each respective quadriceps muscle. The polygon
function in ImageJ was used to outline the boarders of each quadriceps muscle, and EI was assessed by computer-aided gray-scale analysis using the histogram function (Mota et al., 2018; Mota et al., 2017a; Mota et al., 2017b). The EI values were determined as the
corresponding index of muscle quality ranging from 0 to 255 arbitrary units (a.u.; black = 0; white = 255). Subcutaneous fat thickness was quantified with ImageJ’s straight-line function as the distance between the skin-muscle interface and the superior border of the muscle’s
30
𝐶𝐶𝐶𝐶𝐶𝐶𝐶𝐶𝐶𝐶𝐶𝐶𝐶𝐶𝐶𝐶𝐶𝐶𝐸𝐸𝐸𝐸=𝐶𝐶𝑟𝑟𝑟𝑟𝐸𝐸𝐸𝐸+ (𝑠𝑠𝑠𝑠𝑠𝑠𝐶𝐶𝑠𝑠𝐶𝐶𝑟𝑟𝑠𝑠𝐶𝐶𝐶𝐶𝑠𝑠𝑠𝑠𝑓𝑓𝑟𝑟𝐶𝐶𝐶𝐶ℎ𝑖𝑖𝐶𝐶𝑖𝑖𝑠𝑠𝐶𝐶𝑠𝑠𝑠𝑠 [𝐶𝐶𝑐𝑐] × 40.5278)
Muscle volume (MV; cm3) of each quadriceps muscle (i.e., VOLVL, VOLRF,VOLVM, and VOLVI) was estimated from the respective ACSAs using the Cavalieri technique (Lund et al., 2002), which has previously demonstrated favorable precision when compared to magnetic resonance imaging (Nordez et al., 2009). A measure of total quadriceps femoris muscle volume (VOLQUAD) was taken by summing each muscle (i.e., VOLVL + VOLRF + VOLVM + VOLVI) together. The Cavalieri technique assumes an ideal cylinder shape of the muscle between the available slices, and uses the following equation to estimate MV:
1. 𝑀𝑀𝑀𝑀 = ∑ 𝐶𝐶𝑛𝑛 𝑖𝑖 × 𝐶𝐶𝐶𝐶𝐶𝐶𝑖𝑖
Where n is the number of slices used, and ei is the distance between available slices i and i + 1 (Lund et al., 2002; Nordez et al., 2009).
Strength Assessments
31
A separate measure of isometric leg extensor strength was assessed before (PRE) and after (POST) the intervention period for the dominant limb. Participants were seated on a calibrated commercial dynamometer (HUMAC Norm, Computer Sports Medicine Inc., Stoughton, MA) and were restrained with straps over the shoulders, hips, and non-dominant thigh. The participant’s dominant knee joint was visually aligned with the input axis of the dynamometer, and their leg extended to 60° below the horizontal plane. The participants performed a brief warm-up, followed by three, 3-4 second MVCs of the leg extensors, each separated by two minutes of rest. Participants were instructed to “push” as “hard and fast as possible” without any countermovement or pretension, while being provided with strong verbal encouragement. Each MVC was screened for any countermovement or pretension prior to the MVC. If a countermovement or pretension was found, additional MVCs were performed.
Surface Electromyography
To assess muscle activation of the agonist muscles, pre-amplified, bipolar surface electromyographic (EMG) sensors (Ag/AgCl disk electrodes, TSD150B Biopac Systems, Santa Barbara, CA) were placed over the belly of VL, RF, VM, and BF muscles of the dominant thigh in accordance with the recommendations from the surface EMG for the non-invasive
assessment of muscles (SENIAM) project (Hermens et al., 2000). A pre-gelled, disposable electrode (Ag/AgCl, Quinton Quick Prep, Quinton Instruments Co, Bothell, WA) was placed over the tibial tuberosity to serve as a reference electrode. Prior to electrode placement, the skin was shaved, mildly abraded, and cleansed with isopropyl alcohol; electrodes were secured to the skin with hypoallergenic tape. At the conclusion of each data collection trial, the skin over each muscle was lightly marked with a permanent marker (BodyMark Temporary Tattoo Marker, BIC USA INC., Shelton, CT) to ensure the sensors were placed in the same position for
32 Direct Quadriceps Muscle Stimulation Procedures
During the leg press strength assessments at all testing points, direct muscle stimulation was used to determine MMAX (peak-to-peak), which was then be used to normalize the EMG amplitude (Lanza et al., 2018). The quadriceps muscles were stimulated using a high-voltage, constant current stimulator (DS7AH, Digitimer, Herthfordshire, UK) via 2 large (7 X 13 cm)
self-adhesive electrodes (Dura Stick II, Chattanooga Group, Hixson, TN) positioned on the distal vastus medialis muscle and proximal vastus lateralis muscle (Luc-Harkey et al., 2017). Single rectangular pulses (1 ms duration) were delivered from the stimulator and progressively increased until a MMAX was found in this leg press dynamometer set-up.
Femoral Nerve Stimulation Procedures
Before (PRE1) and after (POST1) the intervention period, the femoral nerve was electrically stimulated to elicit a maximum H-reflex (HMAX) and M-wave (MMAX). Participants were laying down on an examination table that was separated from the rest of the laboratory with a privacy screen. Participants were also asked to remain relaxed throughout the procedure and were provided with headphones that played white noise to minimize any distractions. Transcutaneous electrical stimuli were delivered to the femoral nerve using the aforementioned constant current stimulator with a bar electrode (EL351, Biopac Systems Inc., Goleta, CA) covered in electrode gel (SIGNAGEL, Parker Laboratories, Inc., Fairfield, NJ). After the probe was affixed to the skin with hypoallergenic tape and a small external load, stimulation intensity was increased by small increments (5-10 mA) to find HMAX and MMAX, with finer adjustments (1-5 mA) used when necessary. The average of five stimulations were used to quantify HMAX, and subsequently normalized to MMAX.
33
stimulator and a handheld stimulating probe acting as a cathode. The cathode was covered in a water-soaked sponge and pressed into the femoral triangle while the anode was placed midway between the greater trochanter and the iliac crest to close the stimulating current loop (Klass et al., 2016). Optimal probe location within the femoral triangle was determined via single, square wave pulses (1 ms in duration). After determination of the optimal probe location, the stimulus intensity was increased (~30 mA) until a plateau in the peak-to-peak M-wave amplitude was determined (i.e., MMAX). In order to ensure all possible motor units are recruited, 20% was added to the amperage that yields the highest peak-to-peak current to assure a supramaximal stimulus (i.e., 120% of Mmax). For the twitch interpolation procedure, the supramaximal stimulus was delivered as a doublet stimulus (10 ms interval) during the plateau region of an MVC (superimposed twitch), and an additional resting doublet stimulus was delivered ~3 s following the MVC (potentiated twitch). Throughout testing, positioning of the head, arms, and legs was standardized. Careful attention was used to ensure similar pressure and placement of the probe between trials and testing days. Percent voluntary activation (%VA) was calculated with the following equation:
2. %𝑀𝑀𝐶𝐶=�1− �𝑠𝑠𝑠𝑠𝑠𝑠𝑠𝑠𝑠𝑠𝑖𝑖𝑠𝑠𝑠𝑠𝑠𝑠𝑠𝑠𝑠𝑠𝑠𝑠𝑠𝑠𝑠𝑠𝑡𝑡𝑠𝑠𝑛𝑛𝑡𝑡𝑖𝑖𝑝𝑝𝑡𝑡𝑠𝑠𝑠𝑠𝑡𝑡𝑡𝑡𝑖𝑖𝑡𝑡𝑡𝑡ℎ𝑡𝑡𝑡𝑡𝑖𝑖𝑡𝑡𝑡𝑡ℎ��× 100
Where the superimposed twitch refers to the twitch torque response from the superimposed stimulus, and the potentiated twitch refers to the twitch torque response from the potentiated stimulus during and following MVC, respectively.
Quadriceps Cortical Excitability
34
double-cone TMS coil (Magstim Company, Wales, UK). While seated in the commercial dynamometer, a lycra swim cap was placed on the participants head. The swim cap had straight lines that were drawn vertically in the sagittal and frontal planes to allow for the
identification of the approximate motor cortex location (Luc et al., 2014; Norte et al., 2010). The TMS coil was positioned over the intersected lines (i.e., vertex of the cranium) and moved in increments of 0.5 cm in anterior-to-posterior and medial-to-lateral directions until the optimal stimulating point was detected using 55% of the maximum stimulator output. The optimal stimulating point was defined as the location producing the greatest motor evoked potential (MEP) amplitude in the quadriceps (Groppa et al., 2012; Livingston et al., 2008; Luc et al., 2014; Norte et al., 2010).
Following location of the optimal stimulating point, the AMT was determined. The participants were instructed to relax while maintaining constant head and eye position with their eye’s focused on a large computer monitor in front of them. The participants were asked to clear their mind of any thoughts and to remain awake and alert throughout testing (Groppa et al., 2012). The participants were asked to maintain an isometric contraction at 5% of their MVC and were subsequently allowed to relax between stimulation trials (Carroll et al., 2001; Luc-Harkey et al., 2017; Luc et al., 2014). The AMT was defined as the lowest TMS activity required
to evoke a measurable (>100 μV) MEP in five out of 10 trials (Luc-Harkey et al., 2017; Luc et
al., 2014; Pietrosimone et al., 2013; Rossini et al., 2015). After AMT was determined, 10 stimuli were delivered at 120% of AMT stimulus to elicit MEP. These 10 MEP peak-to-peak amplitudes were then averaged and subsequently normalized to MMAX found during the leg extension
strength assessments.
Signal Processing
35
stored on a personal computer. Custom-written software (LabVIEW 18, National Instruments, Austin, TX) was used to process all the signals offline. The force and torque signals were corrected for baseline passive tension and filtered using a fourth order, zero phase shift low pass (150 Hz) Butterworth filter (Thompson, 2018). Isometric peak torque was calculated as the average torque value during the 500 ms epoch immediately before the superimposed twitch (Ryan et al., 2008). Isometric peak force (leg press) was determined as the highest 500 ms
epoch during the plateau of the MVC. Surface EMG signals were simultaneously collected during same epoch as peak force/torque, respectively, and were filtered using a fourth order, zero phase shift bandpass filter (10-500 Hz). The EMG amplitude was quantified using a root mean squared (RMS) function with all MID and POST testing values normalized to PRE testing values. Furthermore, EMG amplitude values were also normalized to MMAX (Keller et al., 2018; Lanza et al., 2018). The peak-to-peak amplitudes of the HMAX and MEP were recorded and
subsequently normalized to MMAX (Palmieri et al., 2004; Zehr, 2002).
Occupational and Functional Assessments
All participants performed a weighted stair climb assessment at PRE1 and POST1 testing, as described previously (Kleinberg et al., 2016). Participants were outfitted with a 22.73 kg weight vest (Z Fitness, San Jose, CA) which was secured to the torso with Velcro straps. This weight vest was chosen to simulate the equipment worn by select public safety officers (e.g., a self-contained breathing apparatus) during occupation specific tasks. To begin the stair climb assessment, participants were given a verbal command “3, 2, 1, GO!”, then ascended and descended the flight of stairs (hitting each step) four times (104 total steps) without stopping or holding onto the handrails. The participants were asked to move as quickly and safely as possible, with a member of the research team waiting at the top of the stairs to ensure
36
completion (s); Time began when the verbal command was given, and the test ended once both feet of the participant were touching the bottom landing.
Additionally, at PRE2 and POST2 testing, all participants performed a countermovement vertical jump to assess maximal jump height and velocity. A linear position transducer (Tendo Sports Machines, Trencin, Slovak Republic) was used to measure velocity (m∙s-1) in conjunction with a contact mat (Just Jump or Run, Probotics, Inc., Huntsville, AL, USA) to assess jump height (cm) for the countermovement vertical jump. The linear position transducer was attached to the waist of the participants via adjustable leather belt and all jump attempts occurred while standing on the contact mat. The participants were asked to stand with their feet shoulder-width apart and were instructed to jump vertically as high as possible with their hands on their hips (Ryan et al., 2014). A total of three jumps were performed by each participant, each separated by 1 min of rest. The highest jump was used for subsequent analyses. In the event of a jump-related error (i.e., landed off the mat), the participants performed additional countermovement jumps.
At PRE2 and POST2 testing, all participants performed the modified star excursion balance test (SEBT). The SEBT has been used to assess dynamic balance in a variety of populations for over 20 years (Gribble et al., 2012; Hertel, 2008; Hertel et al., 2006; Hertel et al., 2000; Kinzey et al., 1998; Steffen et al., 2013). While the original version of the SEBT required
an assessment of balance in eight separate reach directions (Kinzey et al., 1998), previous work has suggested that only three directions (anterior, posteromedial, posterolateral) are required (Hertel, 2008; Hertel et al., 2006). Following a thorough explanation and demonstration of the
SEBT, participants practiced six trials on each leg in each of the three directions prior to formal testing to minimize the learning effect (Hertel et al., 2000) on each testing day. All testing was performed in athletic shoes on a non-slip surface. While maintaining single leg stance, the participants reached with the free limb in the anterior, posterolateral, and posteromedial