THE LASSITER RANK II: A RENEWED RANKING SYSTEM AND ANALYIS OF DIVISION I ATHLETIC DERPARTMENT SUCCESS
Brett LeClair
A thesis submitted to the faculty of the University of North Carolina at Chapel Hill in partial fulfillment of the requirements for the degree of Master of Arts in the Department of Exercise
and Sport Science (Sport Administration).
Chapel Hill 2020
Approved by:
Barbara Osborne
Edgar Shields
ii © 2020 Brett LeClair
iii ABSTRACT
Brett LeClair: The Lassiter Rank II: A Renewed Ranking System and Analysis of Division I Athletic Department Success
(Under the Direction of Barbara Osborne)
Prior to 2001, there was a void in collegiate athletics research as it related to ranking
athletic departments on their all-around success. Traditional ranking systems only considered
on-field performance, despite the NCAA, conferences, and individual athletic departments stating
overtly that their missions were to do so much more than win games. Zack Lassiter sought to fill
that void with his 2001 study “The Lassiter Rank,” which ranked NCAA Division I on their
athletic success, academic success, and commitment to gender equity. This study will provide a
checkup on the Lassiter Rank (2001) nearly two decades after its release, following the same
iv
TABLE OF CONTENTS
LIST OF TABLES………...…..vii
CHAPTER ONE: INTRODUCTION……….….1
Introduction.……….1
Statement of Purpose………....5
Research Questions.……….5
Assumptions……….………...…….6
Delimitations……….…………...6
Limitations……….………..6
Significance of Study……….………..6
CHAPTER TWO: REVIEW OF LITERATURE ……….…8
The Lassiter Rank (2001)………...……….8
Directors’ Cup………...11
Academic Progress Rate (APR)………...….13
Graduation Success Rate (GSR)………...14
v
Research on Athletic Department Rankings………17
CHAPTER THREE: METHODOLOGY.……….19
CHAPTER FOUR: RESULTS………..23
Research Question 1………24
Research Question 2………25
Research Question 3………25
Research Question 4………25
Research Question 5………25
Research Question 6………26
Research Question 7………26
Research Question 8………26
CHAPTER FIVE: DISCUSSION………..27
Conference and Geographical Trend.………..27
Different Paths to Success………...27
Lassiter II Rank versus Total Budget Rank………28
Lassiter Rank (2001) and Lassiter Rank II (2020) Comparisons………28
Commitment to Academics……….29
vi
Opportunities for Future Research……….………..31
Conclusion.………..33
APPENDIX A: Final Rankings……….34
vii
LIST OF TABLES
TABLE 2.1 –Directors’ Cup Point Allocation Example………..11
TABLE 3.1 –Lassiter II Ranking Example………...21
TABLE 4.1 –Final Lassiter II Rank Top Ten………...23
TABLE 4.2 –Lassiter II Rank Correlation Matrix………24
TABLE 4.3 –Total Budget Rank Correlation Matrix………...24
1
CHAPTER ONE: INTRODUCTION
Introduction
The world of higher education is heavily rooted in competition- universities compete with one another for US News rankings, for funding and grants, for esteemed faculty, and for
prospective students. These institutions’ athletic departments are certainly no different as they compete with one another for championships on the playing field, for positioning in media and coaches’ polls, and for student-athletes they recruit for their teams. Competition by definition, however, needs to have winners and losers… so when it comes to intercollegiate athletics, which athletic departments are the best?
Such a simple question could garner infinite different responses due to how complex the industry has become. Some may argue that Alabama or Clemson is the best right now because they have dominated the nation’s most popular sport of football in recent years (Norman, 2019). Others may say that Stanford or North Carolina is the best because they have sustained success across many sports. There may even be a contingency that believes Harvard or Yale is the best because of their athletic success relative to the academic rigors at their institutions. In order to provide a more definitive answer of which athletic programs are doing the best, understanding the purpose of collegiate athletics is crucial.
Article Two of the NCAA Division I manual outlines sixteen Principles of Intercollegiate Athletics, and none of them mentions winning games, scoring goals, or competing for
2
Principle of Gender Equity, the Principle of Sound Academic Standards, and the Principle of Amateurism, among others (NCAA, 2019b, p. 3). What the general public sees on game days may seem like a commercialized business focused on wins, championships and revenue generation, but as the NCAA explains, intercollegiate athletics is rooted in the overall development and experience of its student-athletes at its heart.
Article 2 of the NCAA Manual contains the governing Principles that the collective NCAA Division I members have voted to institute. These principles are supported at the
conference level through various mission statements. At the conference level, the Big 12 states in their mission statement that they strive to “advance standards of scholarship, sportsmanship and equity consistent with the highest ideals of conference membership” and to “support the
development of national championship caliber intercollegiate athletic programs (“Big 12,” 2020). The Pac 12 provides a similar mission, stating they are “dedicated to developing the next
generation of leaders by championing excellence in academics, athletics, and the well-being of student-athletes (“Pac-12,” 2020).
At the institutional level, athletic departments also state broad goals they strive to achieve. The University of Virginia athletic department (2020), for example, proudly displays this mission statement on their website:
3
women and minorities. The Department of Athletics pursues its mission by uniting the varied constituencies of the University community through its intercollegiate and intramural programs. These programs are designed to build support for and add value to the academic purposes of the institution while developing students with strong values of leadership, sportsmanship, equity, citizenship, physical fitness, teamwork, and a commitment to excellence (“Virginia,” 2020)”
Another high-profile athletic department, the University of Texas, outlines seven goals for their athletic department in addition to their mission statement, which are:
• “Recruit and retain talented individuals who represent the Texas Athletics' mission, purpose, values and goals
• Demand and cultivate a culture of integrity, trust and respect.
• Commit to fiscal sustainability and responsibility, while providing the resources, facilities and support programs/services necessary to achieve excellence.
• Honor Longhorns traditions and celebrate excellence.
• Commit to Diversity, Inclusion, Community Engagement and Gender Equity.
• Maintain alignment with campus priorities and initiatives, as Athletics is integral to the life of the University, the city of Austin and the state of Texas.
• Host best-in-class events and fan experiences (“Texas,” 2020).”
Considering these diverse missions, visions, and goals across the national, conference and institutional levels of intercollegiate athletics, it is difficult to know which athletic departments are superior.
4
three criteria that were common in the above mission statements to build this ranking: athletic success, academic success, and gender equity.
To measure competitive success, Lassiter used standings in the Sears Cup (now the Learfield IMG College Directors’ Cup). The Directors’ Cup gives points to institutions based on the postseason success that each one of their teams have in that year, thus crowning the athletic department with the most all-around success on the playing field the champion. While the scoring of the Directors’ Cup has changed many times over the years, it is still trusted as the best measure of broad-based success within the realm of intercollegiate athletics (Lawrence, Li, Regas, & Kander, 2012).
For academic rankings, Lassiter (2001) used universities’ Federal Graduation Rates (FGR). At the time, the federal rate was the most prominent way to measure strength of academics, and it did so by showing what percentage of a freshman cohort graduates in a six-year window starting from the fall semester of their freshman six-year (NCAA, 2019c). The method had many flaws when interpreting it to intercollegiate athletics, however, and the NCAA has since implemented stronger measures of academic standing, in the Academic Progress Report (APR) and Graduation Success Rate (GSR) (NCAA, 2019a; NCAA, 2019d).
Lastly, gender equity was quantified in the Lassiter Ranking to show a commitment to diversity and inclusion. While many aspects of Title IX and gender equity are difficult to measure and compare across institutions, gender proportionality rates are easily attainable and comparable across schools. The gender proportionality rate was found by comparing the
5
In addition to these inputs used in the overall rankings, Lassiter ranked all schools based on their total athletic department budget, and used those rankings for statistical analysis to explore if spending was significantly related to the rankings.
Statement of Purpose
The purpose of this research is to build upon Lassiter’s (2001) holistic ranking by
maintaining the same theoretical framework and implementing new statistics (such as APR) that have become available since its publishing. In producing a ranking from the same framework for the 2017-2018 academic year and answering the same research questions that Lassiter did in 2001, this thesis will also serve as a point of comparison for the changes that have transpired in recent years.
Research Questions
RQ1: Is there a significant relationship between a school’s Directors’ Cup rank and its Lassiter II rank?
RQ2: Is there a significant relationship between a school’s APR rank and its Lassiter II rank? RQ3: Is there a significant relationship between a school’s equity rank and its Lassiter II rank? RQ4: Is there a significant relationship between a school’s total budget rank and its Lassiter II rank?
RQ5: Is there a significant relationship between a school’s total budget rank and its Directors Cup rank?
6 Assumptions
It is assumed in this study that Learfield IMG College accurately assembled the 2017-2018 Director’s Cup scores. It is also assumed that each institution’s 2017-2017-2018 APR scores were accurately calculated. Lastly, it is assumed that each institution filed their 2017-2018 Equity in Athletics Disclosure Act (EADA) report accurately and honestly.
Delimitations
This study was delimited to NCAA Division I (FBS, FCS and non-football) institutions and thus may not be generalized to NCAA Division II or III, National Association of
Intercollegiate Athletics (NAIA), Junior College, or institutions of any other intercollegiate athletic governing body.
Limitations
This study was limited to NCAA Division I (FBS, FCS and non-football) institutions during the 2017-2018 academic year.
Significance of the Study
Before the Lassiter Rank (2001), there existed a hypocritical void in the space of
collegiate athletics. The NCAA, conferences, and individual athletic departments had outlined a number of goals and missions that they strived to achieve, but the systems in place to evaluate their success did not accurately reflect those objectives. Popular ranking metrics such as
7
8
CHAPTER TWO: REVIEW OF LITERATURE
“The Lassiter Rank”
The Lassiter Rank (2001) laid the groundwork that this study was built upon. The purpose of the Lassiter Rank was to develop a system that ranked athletic departments on what they claim collegiate athletics is supposed to do- to provide a positive and well-rounded athletic, academic and personal experience for their student-athletes (Virginia 2020; Texas, 2020).
Popular ranking metrics traditionally include only performance on the playing field as a means of determining who is the best, but this study also incorporated graduation rates and gender
proportionality to provide a more holistic view of the Division I athletics landscape.
The first of those three factors, on-field performance, was measured using standings in the Sears Cup (now the Learfield IMG College Directors’ Cup) which awards athletic
departments points based on their on-field success across their sport offerings. The Directors’ Cup is the most popular metric for determining the broad-based success of an athletic
department, as opposed to polls for individual teams (Lawrence, Li, Regas, & Kander, 2012). The second factor that the Lassiter Rank (2001) used to measure the success of an athletic department was each institution’s graduation rates. This factor was meant to judge how
9
This percentage was calculated for each institution’s general student population and student-athlete population, and the schools were ranked based on the difference between those
two figures. At the time of the Lassiter Rank (2001) this was the best way of measuring student-athlete educational success, but there have since been new metrics developed to measure
academic ratings.
The final metric used to gauge the overall success of an athletic department was their gender proportionality rate. Compliance with Title IX is of the utmost importance for collegiate athletic departments, and the Lassiter Rank (2001) aimed to score departments on their gender equity rates. This proportionality rate is calculated by finding the difference between the percent of a school’s student-athletes that are female and the percent of the general student body that is female. Lassiter (2001) then ranked all Division I athletic departments based on the gap between those two rates, with the first place school being that with the lowest percent difference in female athlete percentage to female student percentage.
Once all Division I athletic departments were ranked in those categories, their three rankings were summed to produce their overall Lassiter Ranking with the lowest sum of rankings being the first place school.
After completing this ranking process for all of Division I, Lassiter then used statistical procedures to find significance between the above variables as well as each department’s budget size. This analysis provided interesting results, including:
• A moderately significant relationship between Directors’ Cup ranking and Lassiter Rank.
• No significant relationship between graduation rate and Lassiter Rank.
10
• A moderately significant relationship between total budget and Lassiter Rank.
• A strongly significant relationship between budget size and Directors’ Cup Rank.
• A significant negative relationship between total budget size and graduation rank.
• A small significant relationship between total budget rank and proportionality rank.
In addition to these statistical findings, a number of interesting points were made by Lassiter in regard to the final rankings. For example, there was no clear pattern of the schools at the top of the list. Large “Power-5” schools like Ohio State and Wisconsin found themselves near the top of the Lassiter Ranking, but were joined by small mid-majors San Diego State and Fresno State in the top ten of the list. The difference in popularity and visibility of these schools proved that multiple different approaches can achieve overall success in the Lassiter Rankings. For example, there was found to be a strong correlation between total budget size and Directors’ Cup ranking, but a department lacking those financial resources to climb the Directors’ Cup rankings can over-index on gender proportionality or graduation rates and find success in the Lassiter Rank as San Diego State did.
11 Directors’ Cup
The most widely respected measure of overall on-field success amongst college
administrators is the Learfield IMG College Directors’ Cup (previously Learfield Directors’ Cup, United States Sports Academy Directors’ Cup, NACDA Directors’ Cup, and Sears Directors’ Cup) (Lawrence, Li, Regas, & Kander, 2012). This program began in 1993 as a joint venture by the National Association of Collegiate Directors of Athletics (NACDA) and USA Today to rank NCAA Division I athletic departments on their on-field success across a breadth sports, which is in contrast to traditional rankings and polls which only score programs in each individual sport (NACDA, 2019b). The rankings have since been expanded to NCAA Divisions II and III, National Association of Intercollegiate Athletics (NAIA) and National Junior College Athletic Association (NJCAA) institutions, although this study only focused on NCAA Division I.
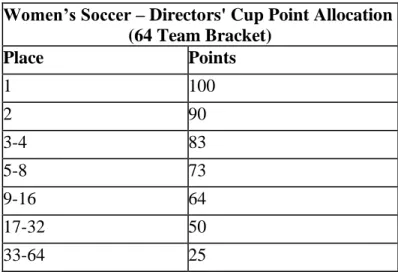
The scoring system has been altered in several ways over time but has remained constant in the concept that teams are awarded a pre-determined number of Directors’ Cup points based on their national positioning at the end of the season. For example, the point allocation for the sport of women’s soccer is found in table 2.1 (NACDA, 2017).
TABLE 2.1 – Directors’ Cup Point Allocation Example
Women’s Soccer – Directors' Cup Point Allocation
(64 Team Bracket)
Place Points
1 100
2 90
3-4 83
5-8 73
9-16 64
17-32 50
33-64 25
12
Following this allocation, the national champion is awarded one-hundred points, runner-up ninety points, semi-finalists eighty-three points and so on. For team sports that follow a post-season bracket (a sixty-four-team bracket in the case of women’s soccer) only the teams that make the post-season are awarded points. The points that each institution accumulates across their teams are then added up at the end of each year to determine the final Directors’ Cup rankings (NACDA, 2019a). In the most current iteration of scoring, each school must count their points from men’s basketball, women’s basketball, baseball and volleyball, followed by their next fifteen highest scores for a total of nineteen sports used in their final calculation. This count of nineteen teams is used because the Division I average for sports sponsored is just over
nineteen (19.1 teams per department) (NACDA, 2017).
One of the most crucial details of the Directors’ Cup is that each sport counts equally towards a school’s total- there is no weighting system for revenue sports (football, men’s and women’s basketball) as some rankings use (NACDA, 2017). For example, one of the strongest brands in present day collegiate athletics is Clemson Football, having won both the 2016 and 2018 College Football Playoff championships. However, the Clemson athletic department is ranked only seventy-third in the 2018-2019 Directors’ Cup standings with 305 points, a robust 1,198.75 points behind first-place Stanford. Clemson’s football championship may have
garnered much public attention, but this one title is worth the same one-hundred points towards a school’s total as all other NCAA national championships. Despite a slightly disappointing season for the Stanford football team, the rest of the athletic department boasted six total national
13
Standing atop the Directors’ Cup rankings is not new territory for Stanford, as they have claimed the last twenty-five championships. The University of North Carolina won the inaugural award in 1993-1994, but each subsequent title has gone to the Cardinal. As North Carolina Director of Athletics Bubba Cunningham joked “we won it, and the last twenty-four years Stanford’s gotten lucky” (Morris, 2019). It is certainly more than luck that has helped Stanford maintain their dominance, however. The award favors departments that experience wide-spread athletic success, stating the mission of the rankings is to “honor institutions maintaining a broad-based program, achieving success in many sports, both men's and women's” (NACDA, 2019a). The traditional mainstays at the top of the Directors’ Cup like Stanford, UCLA, Florida and North Carolina have found success by investing in and nurturing their Olympic sport programs across genders, and have not rested upon success in high-profile revenue sports (Steinbach, 2006).
Academic Progress Rate (APR)
The Academic Progress Rate (APR) is a measure of academic success instituted by the NCAA in 2003. The APR provides institutions a report every academic semester, scoring each of their athletic teams based on the eligibility and retention of their student athletes (NCAA,
2019a).
14
transfers penalizes the team they transfer from by counting as a non-graduate, and they do not count for the team they transfer to as the rate only includes those enroll during the Fall semester of their freshman year (NCAA, 2017) (Petr & McArdle, 2012).
The APR aims to fix those flaws by giving real time scores that are specifically tailored for NCAA teams. The rate is calculated through the following guidelines from the NCAA (2019a):
• “Each student-athlete receiving athletically related financial aid earns one point for staying in school and one point for being academically eligible.
• A team’s total points are divided by points possible and then multiplied by 1,000 to equal the team’s Academic Progress Rate.
• In addition to a team’s current-year APR, its rolling four-year APR is also used to determine accountability.
• Teams must earn a four-year average APR of 930 to compete in championships.”
In addition to a possible post-season ban for a sub-930 four-year APR, teams are also subject to penalties ranging from a reduction in allowable practice times, to coaching suspensions and financial aid restrictions.
Graduation Success Rate (GSR)
15
factoring into their rate as a “non-graduate” since they would not obtain a degree from that school. They would also harm the school they transfer to, as even if they are to obtain a degree from that institution, they do not factor into their rate as a graduate since they did not begin at that school. (NCAA, 2019d). The federal rate also does not account for student-athletes who enroll in school mid-year, as the freshman cohort they base their calculations on is solely the fall semester enrollees (NCAA, 2019d).
The GSR, in contrast, takes into account the thousands of student-athletes who transfer each academic year – even including two-year to four-year school transfers and mid-year enrollees. If these student-athletes remain in good standing and graduate within six years, they will count as a graduate for their university as any graduate in the federal rate would. On average, the NCAA reports GSR rates being 10-15 points higher than federal rates because of these corrections (NCAA, 2019d).
Despite being a more appropriate way to calculate graduation success of student-athletes, the GSR was not used in this iteration of rankings since there is a six-year lag that comes with the data. This means that for academic year 2017-2018, the published GSR scores are measuring the success of student-athletes that enrolled in school in 2011-2012. Because of that
inconsistency, GSR was be factored in this study. Title IX
16
to discrimination under any education program or activity receiving federal financial assistance” (20 U.S.C. § 1681). This means that all schools – not just public schools – are obligated to comply with Title IX regulations.
According to Article 2, Chapter 3, Section 1 of the NCAA Division I manual, it is each NCAA member institution’s responsibility to comply with all federal and state laws regarding gender equity (NCAA, 2019b, p. 3).
Despite Title IX being federal law and the NCAA mandating all its members abide by it, not everybody is compliant with its regulations. In fact, a study by Anderson, Cheslock, and Ehrenberg (2006) found that across all three divisions of the NCAA, 80-82% of schools are out of compliance with Title IX in regard to gender proportionality. According to the 1979 Policy Interpretation from the Office of Civil Rights in the US Department of education, institutions are able to prove compliance with the effective accommodation regulation of Title IX if they achieve one aspect of what is known as the “Three Part Test. The three parts of this test are:
“(1) Whether intercollegiate level participation opportunities for male and female students are provided in numbers substantially proportionate to their respective enrollments: or,
(2) Where the members of one sex have been and are underrepresented among
intercollegiate athletes, whether the institution can show a history and continuing practice of program expansion which is demonstrably responsive to the developing interests and abilities of the members of that sex: or,
17
that sex have been fully and effectively accommodated by the present program” (Policy Interpretation, 1979).
While institutions could satisfy any of the above three parts to prove Title IX compliance, this study focused solely on the first part in gauging gender equity due to the subjective and impossible to measure nature of the latter two parts of the test. Also, the first part of the test was used because participation rates are publicly available figures and can easily be compared across all Division I departments. Independent of the three-part test, this study also examined equitable spending across men’s and women’s teams for all Division I athletic departments as a means of gauging gender equity.
Research on Athletic Department Rankings
Aside from Lassiter (2001), academic research that ranks Division I athletic departments on holistic measures is non-existent. Popular ways of ranking college athletics are often done through individual sport polls, such as the Associate Press poll which began for NCAA football in 1936, for men’s basketball in 1948-1949 and for women’s basketball in 1976-1977
18
19
CHAPTER THREE: METHODOLOGY
This iteration of the Lassiter Rank follows the framework developed in the Lassiter Rank (2001) by scoring schools based on their on-field success, academic success, and gender equity. Each of these areas was scored by using data that is readily available to the public. As was the case in the original rankings, on-field success was scored by standings in the Learfield IMG College Directors’ Cup. Academic success was scored based on average APR scores for each athletic department, which was in contrast to the Lassiter Rank (2001) using the federal graduation rate. Lastly, gender equity rankings were calculated by averaging two measures of department’s commitment to inclusion – participation rates and spending. In addition to those inputs, schools were ranked in terms of their total athletic department budget so that statistical analysis could be run to explore relationships between spending and these aforementioned variables. It should be noted that while the Lassiter Rank (2001) used only Division IA (now, FBS) (n=111) schools in its ranking, this iteration scored all regular member Division I institutions (n=349).
The Learfield IMG College Directors’ Cup is the most widely accepted measure of “on-field” success for athletic departments (Lawrence, Li, Regas, & Kander, 2012). Each team within an athletic department is granted a certain number of points based on their final national
positioning, and those points are tallied to give a total number of points for the athletic
20
NACDA releases reports on these standings at various times over the course of an academic year, but only the final rankings were used for this study.
The second variable used in this ranking system, Academic Progress Rate, (APR) was used to determine the relative academic success of each athletic department. The NCAA
provides a searchable, online database where each team’s APR scores can be easily found. This study took department-wide APR scores for the given year and divide them by the number of sports they sponsor to give an average APR score. Since athletic departments can vary by as many as twenty teams in their sport offerings, the averaging of the APR scores provided a standard that can be objectively evaluated. Each Division I athletic department was ranked on these average APR scores, with the first-place institution being the one with the highest average score. It should be noted that single-year APR scores are not published by the NCAA, instead the APR scores released for a given year are a four-year rolling average of scores.
Lastly, gender equity rankings were calculated by averaging athletic departments’ rankings on two criteria. The first, similar to the Lassiter Rank (2001), was participation proportionality rates. To find these rates, the percentage of general students at a university that are female was subtracted from the percentage of student-athletes at that school that are female. This shows how equitable each school’s opportunities for athletic participation are for each gender. The institutions were ranked in accordance of these ratios, with the number one school having percent difference closest to 0.00% in regard to female athletes compared to general female students.
21
The school with the closest to 0.00% difference in men’s and women’s team expenditures was then ranked number one.
After all Division I schools were ranked on their participation proportionality rates and expense rates, the two rankings were averaged to produce one “equity rank.”
Once these three rankings – on-field, academic, and equity - were calculated, they were used to determine the overall Lassiter Rank. Each school’s rank in these three categories was added up to give them a certain number of “Lassiter Points.” The school with the fewest Lassiter Points was the number one school in the Lassiter Ranking, the second fewest points number two, and so on. A visual representation of this ranking system is found below in Table 3.1.
TABLE 3.1 – Lassiter II Ranking Example
Institution Directors’ Cup
Ranking APR Ranking Equity Rank
Lassiter Points
Lassiter Rank
University A 1st 1st 1st 3 1
University B 3rd 2nd 3rd 8 2
University C 2nd 5th 2nd 9 3
In this scenario, University A received one point for its Directors’ Cup ranking, one point for its APR ranking, and one point for its equity ranking for a total of three Lassiter
Points. University B received three points for its Directors’ Cup ranking, two points for its APR ranking, and three points for its equity ranking for a total of eight Lassiter
22
After the final Lassiter Rankings were completed, a series of statistical tests were run to determine if there are any significant relationships between the variables. The following tests were run to determine relationships among variables:
• Spearman’s rho correlation of Directors’ Cup rank versus Lassiter II rank
• Spearman’s rho correlation of APR rank versus Lassiter II rank
• Spearman’s rho correlation of equity rank versus Lassiter II rank
• Spearman’s rho correlation of Total Budget rank versus Lassiter II rank
• Spearman’s rho correlation of Total Budget rank versus Directors’ Cup rank
• Spearman’s rho correlation of Total Budget rank versus APR rank
• Spearman’s rho correlation of Total Budget rank versus equity rank
23
CHAPTER FOUR: RESULTS
Rankings for all Division I schools were compiled based on Total Budget, Directors’ Cup, APR, and equity to yield the final Lassiter II ranks. The entirety of these rankings can be found in Appendix A, but the top ten of the Lassiter II rank is also found below in Table 4.1. TABLE 4.1 – Final Lassiter II Rank Top Ten
Institution Directors’
Cup Rank APR Rank Equity Rank
Lassiter II Points
1
Stanford University 1 18 79 98
2
Northeastern University 137 20 1 158
3
Dartmouth College 92 5 65 162
4 University of New
Hampshire 71 53 53 177
5
Pepperdine University 89 47 43 179
6
Villanova University 66 4 111 181
7
Gonzaga University 113 3 73 189
8
Harvard University 65 34 91 190
9 University of
Connecticut 84 67 46 197
10 University of Illinois
24
Following the compilation of these rankings, several statistical tests were run using SPSS to explore the relationships between these variables per the research questions. Below is a
synopsis of the Spearman’s rho correlations that were run in this study.
TABLE 4.2 - Lassiter II Rank Correlation Matrix
Directors’ Cup Rank
APR Rank Equity Rank Budget Rank
Lassiter II Rank .545 .824 .571 .466
P < .001 P < .001 P < .001 P < .001
** ** ** **
TABLE 4.3 - Total Budget Rank Correlation Matrix
Directors’ Cup Rank
APR Rank Equity Rank
Budget Rank .769 .392 -.181
P < .01 P < .01 P = .001
** ** **
TABLE 4.4 - Multiple Regression Output
Model Summary: R = .988 R2 = .975 Adjusted R2 = .975
Ind. Variable r Beta r x Beta (% Explained) Significance
Directors’ Cup Rank .545 .457 24.9% .000**
APR Rank .824 .540 44.5% .000**
Equity Rank .571 .495 28.3% .000**
25
Research Question 1:
The first research question explored the relationship between schools’ Directors’ Cup rank and their Lassiter II rank. The Spearman test for this research questions found a moderately significant, positive correlation between these two variables with a correlation coefficient of .545.
Research Question 2:
The second research question explored the relationship between schools’ APR rank and their Lassiter II rank. In positive news, it was found that there was a highly significant
relationship between these two variables with a correlation coefficient of .824. Of all the tests, this one yielding the strongest relationship between two variables.
Research Question 3:
The third research question explored the relationship between schools’ equity ranks and their Lassiter II rank. Similar to the first research question, there was a moderately significant relationship between these two variables with a correlation coefficient of .571. This is not overwhelming, but the relationship between the two variables cannot be explained by chance.
Research Question 4:
26
reassuring to find that athletic departments cannot simply “buy” their way to the top of the Lassiter II rank.
Research Question 5:
The fifth research question further explored relationships with budgets, this time comparing spending to Directors’ Cup rankings. This test found a strong, positive correlation between the two variables with a correlation coefficient of .769. This was not terribly surprising as the large, Power-5 schools tend to dominate the top of the Directors’ Cup standings.
Research Question 6:
This research question explored the relationship between schools’ total budget rank and APR rank. While the relationship was significant with a p value < .01, the correlation was rather weak with a coefficient of .392. This was the weakest of the positive correlation coefficients found in the Spearman tests.
Research Question 7:
The most disturbing result found in this study was that there is a significant, negative relationship between total budget rank and its equity rank. Albeit a very weak correlation of -.181, this was still the only negative correlation found.
Research Question 8:
27
28
CHAPTER FIVE: DISCUSSION
This study aimed to further the research that Zachary Lassiter had done in his 2001 study, the Lassiter Rank. As Lassiter himself stated in his piece, the purpose of the research was never to crown who the best athletic department is, but rather to fill the void of a ranking system based on holistic criteria. While this study improved upon the 2001 framework by using new ranking criteria that better fits collegiate athletics, such as APR scores and equitable spending measures, it certainly is not a perfect instrument for measuring success. Regardless, this study yielded a number of interesting findings as it relates to overall athletic department success as defined by the traits identified in athletics department mission statements.
Conference and Geographic Trends
At the top of the Lassiter II rankings there was quite a wide, random dispersion of
schools. The only conference that boasted multiple schools in the top ten of the rankings was the Ivy League (Dartmouth-3rd, Harvard 8th) while the other eight each came from a separate
conference. This was perhaps the most interesting finding of the study, as it proved that no single conference is definitively superior when it comes to holistic athletic department success. While no conference dominated the top of the Lassiter II rankings, it was rather interesting to find that six of the top ten institutions hail from the northeast – Northeastern (MA), Dartmouth (NH), UNH (NH), Villanova (PA), Harvard (MA), UConn (CT).
29
Another interesting finding at the top of the Lassiter II ranks was the different ways in which each school achieved great overall success. Stanford, as they have all but one year, held the top spot in the Directors’ Cup and had solid scores in both the APR and equity ranks to run away with first place. Northeastern and Dartmouth, the second and third places schools, over-indexed on one particular category and had decent scores in the others to round out the top three. What is quite interesting, however, is that the University of New Hampshire came in fourth place while not being in the top fifty of any of the particular rankings. This was a very exciting result, as it gives great support to the purpose of the rankings which was to gauge all around athletic department success. New Hampshire showed that you do not have to be incredible at any one thing, but if you are able to achieve balanced success across a breadth of criteria then you can be considered elite in this industry.
Lassiter II Rank versus Total Budget Rank
One final observance of the top ten schools in the Lassiter II rank is that having a big budget did not mean big overall success. While the statistical analysis showed a significant relationship between the two variables, only first-place Stanford had an overall budget in the top twenty at 13th place. Six of the top ten Lassiter II ranked schools did not even have a budget in the top 100, and the second highest budget in the Lassiter II top ten was in 45th place.
Lassiter Rank (2001) and Lassiter Rank II (2020) Comparisons
30
the rankings, many schools would have seen their rankings plummet for no other reason than new schools being included. With that drastic of a change in population, there are no meaningful statistical analyses to be done on change of overall ranking.
Commitment to Academics
As stated in Chapter Four, APR rankings explained the highest percentage of overall Lassiter II rank at 44.5% and this was reflected in the top twenty of the rankings. Within those top twenty schools according to Lassiter II rank, only one was outside the top 100 in terms of APR rank. For comparison, there were six schools outside the top 100 of the Directors Cup and seven outside the top 100 of equity rankings. This was a reassuring finding as collegiate athletic departments explicitly define themselves as an extension of the academic mission of their university. Universities should take notice of this finding, and be reassured that committing to the academic success of their students can reflect overall success.
Another finding of note in this study was that there was a very strong, significant relationship between schools’ APR rank and their Lassiter II rank. This contrasts with the Lassiter Rank (2001) discovery of no significant relationship between graduation rate and Lassiter rank. The difference in those two findings is great reassurance for the use of APR as a metric of overall academic success of student-athletes versus the federal graduation rate, whose flaws have been discussed greatly in the literature review (NCAA, 2017) (Petr & McArdle, 2012).
Other Implications of Research Questions
31
research questions. Many of those findings come from relationships found between total budget rankings and the input variables. For example, the Spearman’s rho test found a correlation coefficient of .769 for total budget rank compared to Directors’ Cup standings. This should not come as much of a surprise as the top of the Directors’ Cup rankings each year are almost exclusively made up of high-budget, Power-5 institutions with the smaller mid-majors lagging behind. A strong, positive correlation (.842) was also found between these two variables in the original Lassiter Rank (2001) which points to the consistency of high-major schools to sustain success.
In addition to the consistency in correlation between Directors’ Cup and budget rank, there was also a consistent finding with equity rank and budget rank. With a correlation coefficient of .289, the Lassiter Rank (2001) found that there wasn’t much of a relationship between these variables. This study also identified a weak relationship between these two, but it exaggerated that finding by producing a negative correlation coefficient of -.181. This is a very peculiar and rather disturbing trend for college athletics, however, it cannot be simply stated that the industry is less inclusive now than in 2001 since this study included equitable spending in the equity rankings which the Lassiter Rank (2001) did not. Future researchers may be interested in further exploring this topic, and could potentially generate more conclusive answers by
comparing years with consistent ranking criteria.
32
graduation rate. It would be intuitive that large budget schools are the most likely to have players leave school early to pursue professional careers, and thus produce a poor relationship between budget and graduation rates. Since APR does not penalize student-athletes for leaving early, that is likely a cause of this statistical change.
While this relationship between budget size and academic ranking is inconsistent with the Lassiter Rank (2001), it was very consistent with existing research on APR scores. Bouchet and Scott, (2009), Gurney and Southhall (2012), LaForge and Hodge (2009), and Stowkowski et al. (2017) for example all found significant, positive correlations between total budget size and individual sport APR scores. It was found that schools with larger budgets have the luxury of providing more academic resources, and specifically academic counselors, to their student-athletes which is a primary indicator of higher APR scores for athletic teams.
Finally, a major statistical finding of this study was the correlation coefficient of .466 for Lassiter II rank compared to budget rank. While there is moderate relationship between the two, it is reassuring that budget rank was not a primary predictor of Lassiter II rank since budget is one area that athletic departments cannot actively change. It is reasonable to assume that
institutions can boost their APR and equity rankings with proper commitments, which according to the multiple regression in this study, explains 72.8% of their overall Lassiter II rank. This approach was illustrated beautifully by Northeastern University, who ranked in the top 20 of APR and equity rank, and outside the top 125 of Directors’ Cup, but still earned the second overall spot in the Lassiter II rank.
33
This study was limited solely to NCAA Division I athletic departments during the 2017-2018 academic year, and naturally, future researchers have the opportunity to apply this
framework to different academic years. Also, as the Directors’ Cup and EADA produce data for all levels of intercollegiate athletics, future research may apply this framework to non-Division I institutions (NCAA Divisions II and III, NAIA, Junior College, etc.) although the academic rankings would need to be altered since the NCAA only tracks APR data for Division I. Future researchers may also be interested in introducing new variables to test against the ranking system, for example, formally exploring trends among conferences, number of sports sponsored, specific sports sponsored, and private versus public institutions to name a few.
In addition to those potential changes to this ranking framework, I would invite future researchers to explore ways to further improve the ranking criteria in the same way that this study improved upon the first Lassiter Rank of 2001. While the Directors’ Cup is the current standard of measuring all-around athletic success, perhaps future researchers may try to refine that model so departments with fewer sports be more represented at the top of the list. Or, perhaps other goals of athletic departments are attempted to be quantified and factored into the rankings, such as student-athlete development or post-graduation career success.
Another opportunity for this study to be furthered would be to explore ranking
34
Lastly, as previously stated, this study was unable to provide statistical analyses of change in ranks from the Lassiter Rank (2001) and now due to the drastic change in population. If future researchers replicate this study for a different year and use all of Division I, they could then analyze changes in rankings.
Conclusion
35
APPENDIX A: FINAL RANKINGS
2017-2018 Directors Cup Rankings
INSTITUTION NAME DIRECTORS’
CUP RANK
DIRECTORS’ CUP POINTS
Stanford University 1 1442.00
University of California, Los Angeles 2 1326.00
University of Florida 3 1216.00
University of Southern California 4 1147.00
University of Texas at Austin 5 1143.25
University of Michigan 6 1131.00
The Ohio State University 7 1118.00
University of Georgia 8 1046.35
Florida State University 9 1038.75
Texas A&M University 10 1005.50
Duke University 11 1004.25
Pennsylvania State University 12 978.25
University of North Carolina at Chapel Hill 13 917.50
University of Alabama 14 913.00
North Carolina State University 15 894.75
University of Arkansas 16 870.50
University of Kentucky 17 862.00
Auburn University 18 856.25
University of Minnesota 19 852.00
University of California, Berkeley 20 830.25
University of Virginia 21 830.00
University of Notre Dame 22 804.00
University of Wisconsin-Madison 22 804.00
University of Oregon 24 786.75
University of Oklahoma 25 785.75
University of South Carolina 26 768.00
Louisiana State University 27 749.25
Virginia Polytechnic Institute and State University 28 735.50
University of Washington 29 693.25
University of Louisville 30 690.50
Arizona State University 31 686.00
Oklahoma State University 32 683.75
University of Missouri 33 660.75
Northwestern University 34 644.00
36
University of Illinois Urbana-Champaign 36 592.00
University of Colorado, Boulder 37 591.50
University of Mississippi 38 588.50
Purdue University 39 585.50
Princeton University 40 579.50
Texas Tech University 41 577.00
Mississippi State University 42 568.50
Baylor University 43 555.75
University of Nebraska 44 553.00
Brigham Young University 45 552.50
Syracuse University 46 539.75
University of Denver 47 529.25
Wake Forest University 48 496.50
Indiana University, Bloomington 49 491.00
Michigan State University 50 475.75
University of Arizona 51 472.50
Clemson University 52 471.75
University of Maryland 53 467.50
University of Iowa 54 457.50
Vanderbilt University 55 450.00
Iowa State University 56 436.00
University of Kansas 57 412.50
Texas Christian University 58 394.00
Boise State University 59 387.50
Oregon State University 60 383.00
University of Utah 61 382.50
University of Miami (Florida) 62 382.00
West Virginia University 63 380.75
University of New Mexico 64 373.25
Harvard University 65 365.00
Villanova University 66 363.00
University of Houston 67 351.00
United States Air Force Academy 68 345.50
Columbia University 69 339.00
Northern Arizona University 70 327.00
University of New Hampshire 71 325.00
Kansas State University 72 315.00
Furman University 73 307.50
United States Naval Academy 74 298.00
Kent State University 75 294.25
37
Colorado State University 77 267.00
Utah State University 78 265.25
Yale University 79 262.00
Washington State University 80 260.50
James Madison University 81 252.50
Cornell University 82 242.50
San Diego State University 83 242.00
University of Connecticut 84 233.00
University of South Florida 85 231.00
University of Central Florida 86 230.00
Wichita State University 87 223.50
North Dakota State University 88 219.00
Pepperdine University 89 213.50
Stony Brook University 90 206.50
Southern Utah University 91 205.50
Dartmouth College 92 205.00
Georgetown University 93 202.50
Middle Tennessee State University 94 199.00
Boston College 95 198.00
South Dakota State University 96 197.50
Campbell University 97 194.00
California State University, Fullerton 98 189.00 North Carolina A&T State University 99 187.00
University of Hawaii, Manoa 100 184.00
Sam Houston State University 101 178.50
Eastern Michigan University 102 178.00
University of Pennsylvania 103 177.50
University of Cincinnati 104 175.50
University of San Francisco 105 174.50
Army West Point 106 173.00
Providence College 107 170.00
Rutgers University 107 170.00
University of South Dakota 107 170.00
University of Northern Iowa 110 168.50
University of Pittsburgh 111 167.00
University of the Pacific 112 165.00
Gonzaga University 113 164.50
Central Michigan University 114 163.50
SUNY at Albany 115 163.00
University of Wyoming 116 158.00
38
Florida International University 117 157.00
Colgate University 119 154.00
University of San Diego 120 153.00
Georgia Institute of Technology 121 151.50
Long Beach State University 122 148.50
University of North Carolina Wilmington 123 147.00
New Mexico State University 124 145.00
Kennesaw State University 125 144.00
Liberty University 126 143.50
University of Memphis 127 142.50
Southern Methodist University 128 142.00
Murray State University 129 141.00
Butler University 130 139.00
Eastern Kentucky University 130 139.00
SUNY at Buffalo 130 139.00
Boston University 133 138.00
University of Nevada, Reno 134 136.00
University of Tulsa 135 135.00
St. John's University (New York) 136 134.50
Northeastern University 137 127.00
Creighton University 138 125.00
Virginia Commonwealth University 138 125.00
Samford University 140 122.50
University of Portland 141 118.50
Missouri State University 142 117.50
Miami University (Ohio) 143 117.00
Old Dominion University 144 116.00
University of Southern Mississippi 145 115.50
Loyola University Maryland 146 113.00
Jacksonville University 147 108.50
Hofstra University 148 108.00
Jacksonville State University 148 108.00
University of Central Arkansas 150 103.00
Brown University 151 102.00
Alabama State University 152 100.00
Drake University 152 100.00
Fairfield University 152 100.00
Marquette University 152 100.00
Monmouth University 152 100.00
Saint Francis University (Pennsylvania) 152 100.00
39
Arkansas State University 159 99.50
Fordham University 160 98.00
George Washington University 161 96.50
McNeese State University 162 96.00
Towson University 162 96.00
University of North Florida 162 96.00
Florida Atlantic University 165 95.00
Georgia State University 165 95.00
Marshall University 165 95.00
Ohio University 165 95.00
Iona College 169 94.50
University of Nevada-Las Vegas 170 94.00
University of California, Irvine 171 93.60
University of Texas at El Paso 172 93.00
University of North Carolina Greensboro 173 91.00
Temple University 174 90.00
Tennessee Technological University 175 89.00
Western Michigan University 175 89.00
Texas State University 177 87.50
Lehigh University 178 85.00
Wagner College 178 85.00
South Carolina State University 180 83.50
Loyola University Chicago 181 83.00
University of Maryland, Baltimore County 181 83.00
Troy University 183 82.50
Northern Illinois University 184 82.00
University of Rhode Island 184 82.00
Fresno State University 186 81.00
LIU Brooklyn 187 80.00
University of Northern Colorado 188 76.50
DePaul University 189 75.00
Florida Gulf Coast University 189 75.00
High Point University 189 75.00
Mercer University 189 75.00
Quinnipiac University 189 75.00
Seattle University 189 75.00
University of South Alabama 189 75.00
University of Vermont 189 75.00
Rice University 197 73.00
Santa Clara University 198 72.60
40
Montana State University 199 72.00
Weber State University 201 70.00
Wofford College 201 70.00
University of Idaho 203 69.00
Appalachian State University 204 67.00
California State University, Bakersfield 205 66.00
American University 206 65.50
College of Charleston 207 64.50
Stetson University 208 64.00
University of California, Davis 208 64.00
California Polytechnic State University 210 61.00
Utah Valley University 211 55.50
Cleveland State University 212 55.00
University of Richmond 212 55.00
Saint Joseph's University 214 53.00
University of Delaware 214 53.00
Youngstown State University 216 51.00
Canisius College 217 50.00
East Tennessee State University 217 50.00
Elon University 217 50.00
Grambling State University 217 50.00
Lamar University 217 50.00
Lipscomb University 217 50.00
Nicholls State University 217 50.00
Radford University 217 50.00
Seton Hall University 217 50.00
Texas Southern University 217 50.00
University of Illinois at Chicago 217 50.00
University of Louisiana at Lafayette 217 50.00 University of Massachusetts, Amherst 217 50.00
University of North Texas 217 50.00
University of Toledo 217 50.00
William and Mary 217 50.00
Winthrop University 217 50.00
Wright State University 217 50.00
Xavier University 217 50.00
Northwestern State University 236 47.00
University of Texas at Arlington 236 47.00
Louisiana Tech University 238 45.00
University of Louisiana Monroe 239 43.50
41
New Jersey Institute of Technology 241 42.00
Grand Canyon University 242 41.00
Drexel University 243 39.00
Fairleigh Dickinson University 244 35.00
Sacramento State University 245 34.50
University of the Incarnate Word 246 34.00
University of Missouri-Kansas City 247 33.60
Sacred Heart University 248 32.00
Central Connecticut State University 249 30.00
Davidson College 249 30.00
Indiana University-Purdue University Indianapolis 249 30.00
Prairie View A&M University 249 30.00
University of Nebraska Omaha 249 30.00
Abilene Christian University 254 28.00
Rider University 254 28.00
University of Texas at San Antonio 256 27.00
University of Tennessee at Chattanooga 257 25.50
Austin Peay State University 258 25.00
Belmont University 258 25.00
Bethune-Cookman University 258 25.00
Bryant University 258 25.00
California State University, Northridge 258 25.00
Eastern Washington University 258 25.00
Howard University 258 25.00
La Salle University 258 25.00
Morehead State University 258 25.00
Morgan State University 258 25.00
Oral Roberts University 258 25.00
Presbyterian College 258 25.00
Robert Morris University 258 25.00
St. Bonaventure University 258 25.00
St. Francis College Brooklyn 258 25.00
Stephen F. Austin State University 258 25.00
Tulane University 258 25.00
University of Alabama at Birmingham 258 25.00
University of Arkansas at Little Rock 258 25.00 University of California, Santa Barbara 258 25.00
University of Dayton 258 25.00
University of Hartford 258 25.00
University of Maine 258 25.00
42
University of North Dakota 258 25.00
University of Saint Louis 258 25.00
University of Wisconsin-Green Bay 258 25.00
Western Illinois University 258 25.00
Norfolk State University 286 23.50
Houston Baptist University 287 19.00
George Mason University 288 15.50
Binghamton University 289 11.00
Saint Mary's College of California 290 8.60
Bradley University 291 5.00
North Carolina Central University 291 5.00
43
2017-2018 APR Rankings
INSTITUTION NAME APR
RANK
AVERAGE APR
Bradley University 1 998.1176
Columbia University 2 998.1071
Gonzaga University 3 997.7368
Villanova University 4 997.6154
Dartmouth College 5 997.1333
College of the Holy Cross 6 997.1071
University of Pennsylvania 7 996.9000
Lehigh University 8 996.5556
Colgate University 9 996.5385
University of Notre Dame 10 995.7857
Northwestern University 11 995.6316
Brown University 12 995.4571
Vanderbilt University 13 995.4375
Siena College 14 995.3913
Belmont University 15 995.3684
Yale University 16 995.2581
Georgetown University 17 995.0000
Stanford University 18 994.9375
William and Mary 19 994.8800
Northeastern University 20 994.8421
Bucknell University 21 994.7931
Bryant University 22 994.4583
Davidson College 23 993.7826
Syracuse University 24 993.1905
University of Hartford 25 993.1053
Miami University (Ohio) 26 993.0000
Saint Louis University 27 992.8500
Xavier University 28 992.6500
University of Cincinnati 29 992.3810
Indiana University-Purdue University Indianapolis 30 992.3000
Princeton University 31 992.0000
University of Alabama at Birmingham 31 992.0000
University of Michigan 33 991.9677
Harvard University 34 991.9167
George Washington University 35 991.7200
44
Saint Joseph's University 37 991.5238
Seton Hall University 38 991.4286
Boston College 39 991.2903
University of Dayton 40 991.2353
Duke University 41 991.2069
Lafayette College 42 991.2000
Stony Brook University 43 991.1579
Drexel University 44 991.1333
University of Richmond 45 991.0588
Quinnipiac University 46 991.0500
Pepperdine University 47 991.0000
University of Minnesota 48 990.9259
Rice University 49 990.8889
University of Illinois Urbana-Champaign 50 990.8696
Canisius College 51 990.8636
University of Vermont 52 990.8000
University of New Hampshire 53 990.7727
Marist College 54 990.7083
Santa Clara University 55 990.7000
University of Mississippi 56 990.5500
Boise State University 57 990.4286
Arizona State University 58 990.4074
Auburn University 59 990.3636
University of Portland 60 990.2941
Boston University 61 990.2917
Cornell University 62 990.2333
Hofstra University 63 990.1765
Southern Illinois University-Edwardsville 64 990.1667
Ohio University 65 990.0588
Providence College 66 990.0476
University of Connecticut 67 990.0000
Georgia Institute of Technology 68 989.8947
University of North Carolina Asheville 69 989.8333
DePaul University 70 989.8235
Murray State University 71 989.8125
University of Wisconsin-Milwaukee 72 989.7647
Rutgers University 73 989.6923
Loyola University Maryland 74 989.6111
Loyola University Chicago 75 989.5294
45
University of North Carolina at Chapel Hill 77 989.4000
University of Virginia 78 989.3704
University of Wisconsin-Madison 79 989.2400
Florida Atlantic University 80 989.2000
California Polytechnic State University 81 989.1304
Elon University 82 989.0000
Florida Gulf Coast University 82 989.0000
Fairfield University 84 988.8947
University of Northern Iowa 84 988.8947
Niagara University 86 988.8421
University of Louisville 87 988.7600
St. Bonaventure University 88 988.7222
Middle Tennessee State University 89 988.6842
University of Rhode Island 90 988.5000
University of Massachusetts Lowell 91 988.4444
Butler University 92 988.3636
University of South Carolina 93 988.2727
Wake Forest University 94 988.2000
University of Evansville 95 988.1579
University of California, Berkeley 96 988.0667
Creighton University 97 988.0000
Lipscomb University 97 988.0000
North Dakota State University 99 987.9444
University of Nebraska 100 987.9200
LIU Brooklyn 101 987.9048
Mercer University 102 987.8947
University of North Florida 103 987.8095
University of Southern California 104 987.6800
University of Denver 105 987.6471
Saint Francis University (Pennsylvania) 106 987.4800
Fordham University 107 987.4091
Virginia Polytechnic Institute and State University 108 987.3750
University of South Alabama 109 987.3684
University of Miami (Florida) 110 987.3158
University of California, Davis 111 987.2800
Furman University 112 987.2727
University of Tennessee, Knoxville 112 987.2727
Colorado State University 114 987.2222
Iowa State University 115 986.9500
46
University of Washington 117 986.9130
University of Texas at Austin 118 986.9091
American University 119 986.8889
Binghamton University 120 986.8696
University of Illinois at Chicago 121 986.8500
North Carolina State University 122 986.8000
Duquesne University 123 986.7895
University of North Carolina Wilmington 124 986.7619
University of San Diego 125 986.5882
Marquette University 126 986.4444
University of Idaho 127 986.3333
San Diego State University 128 986.2500
Clemson University 129 986.2000
University of Delaware 130 986.0455
University of California, Los Angeles 131 986.0000
Baylor University 132 985.8947
Michigan State University 133 985.6667
Manhattan College 134 985.6190
University of Toledo 135 985.5882
University of Kentucky 136 985.5417
University of Utah 137 985.3158
Houston Baptist University 138 985.2105
West Virginia University 139 985.0526
Kent State University 140 985.0000
Seattle University 141 984.9091
University of Colorado, Boulder 142 984.8947
Robert Morris University 143 984.8824
New Jersey Institute of Technology 144 984.8095
University of South Dakota 145 984.7895
Indiana University, Bloomington 146 984.7308
Sacred Heart University 147 984.7188
Towson University 148 984.5500
Eastern Michigan University 149 984.2000
University of Massachusetts, Amherst 150 984.1739
East Tennessee State University 151 984.1500
University of Florida 152 984.1304
Central Michigan University 153 984.0000
George Mason University 154 983.9583
Valparaiso University 155 983.9565
47
University of San Francisco 157 983.9333
James Madison University 158 983.8421
Ball State University 159 983.8000
Campbell University 160 983.7391
Presbyterian College 161 983.7333
Pennsylvania State University 162 983.6970
University of Missouri-Kansas City 163 983.6111
Southern Methodist University 164 983.5882
University of Wyoming 165 983.5263
Appalachian State University 166 983.4545
Mount St. Mary's University 167 983.3684
Oregon State University 168 983.3529
Old Dominion University 169 983.3125
Texas A&M University-Corpus Christi 170 983.1667
Purdue University Fort Wayne 171 983.1333
University of Alabama 172 983.1304
Illinois State University 173 983.0476
Florida State University 174 983.0455
Loyola Marymount University 175 982.8636
South Dakota State University 176 982.7500
Long Beach State University 177 982.6667
University of Tulsa 178 982.5789
Louisiana State University 179 982.4783
University of New Mexico 180 982.4000
Southern Illinois University-Carbondale 181 982.3333
Grand Canyon University 182 982.2174
University of Maine 183 982.2105
Wagner College 184 982.1250
University of the Pacific 185 982.1176
Bowling Green State University 186 982.1053
Rider University 187 982.0909
University of Georgia 187 982.0909
La Salle University 189 982.0385
Montana State University 190 981.9412
Wofford College 191 981.9048
Northern Illinois University 192 981.8889
Missouri State University 193 981.7778
Utah Valley University 194 981.7222
University of Northern Colorado 195 981.7143
48
St. John's University (New York) 197 981.6111
University of Missouri 198 981.4091
University of Central Arkansas 199 981.3500
Tulane University 200 981.3333
University of Pittsburgh 201 981.3000
University of Oklahoma 202 981.2609
Kansas State University 203 981.2222
Fairleigh Dickinson University 204 981.1905
University of Tennessee at Chattanooga 205 981.1875
Iona College 206 981.1364
University of Central Florida 207 981.0588
Wichita State University 208 981.0000
High Point University 209 980.9444
University of North Dakota 210 980.8421
University of Iowa 211 980.6154
College of Charleston 212 980.5294
Idaho State University 212 980.5294
Samford University 214 980.5263
Eastern Kentucky University 215 980.4706
University of Arizona 216 980.4545
University of Arkansas 217 980.4286
Oklahoma State University 218 980.3684
California State University, Sacramento 219 980.3636
Radford University 220 980.2941
Mississippi State University 221 980.2222
Troy University 222 980.1667
Eastern Illinois University 223 980.1364
Austin Peay State University 224 980.1250
Georgia Southern University 225 980.0556
Alcorn State University 226 980.0000
Saint Mary's College of California 227 979.9412
Northwestern State University 228 979.8125
Texas A&M University 229 979.8095
Tennessee Technological University 230 979.8000 University of Texas at San Antonio 231 979.5263
University of Hawaii, Manoa 232 979.5000
University of Nevada, Reno 233 979.4375
University of Akron 234 979.4000
Georgia State University 235 979.2941