Foglight™ for SQL Server 5.7.0
User and Reference Guide
© 2014 Dell Inc.
ALL RIGHTS RESERVED.
This guide contains proprietary information protected by copyright. The software described in this guide is furnished under a software license or nondisclosure agreement. This software may be used or copied only in accordance with the terms of the applicable agreement. No part of this guide may be reproduced or transmitted in any form or by any means, electronic or mechanical, including photocopying and recording for any purpose other than the purchaser’s personal use without the written permission of Dell Inc.
The information in this document is provided in connection with Dell products. No license, express or implied, by estoppel or otherwise, to any intellectual property right is granted by this document or in connection with the sale of Dell products. EXCEPT AS SET FORTH IN THE TERMS AND CONDITIONS AS SPECIFIED IN THE LICENSE AGREEMENT FOR THIS PRODUCT, DELL ASSUMES NO LIABILITY WHATSOEVER AND DISCLAIMS ANY EXPRESS, IMPLIED OR STATUTORY WARRANTY RELATING TO ITS PRODUCTS INCLUDING, BUT NOT LIMITED TO, THE IMPLIED WARRANTY OF MERCHANTABILITY, FITNESS FOR A PARTICULAR PURPOSE, OR NON-INFRINGEMENT. IN NO EVENT SHALL DELL BE LIABLE FOR ANY DIRECT, INDIRECT, CONSEQUENTIAL, PUNITIVE, SPECIAL OR INCIDENTAL DAMAGES (INCLUDING, WITHOUT LIMITATION, DAMAGES FOR LOSS OF PROFITS, BUSINESS INTERRUPTION OR LOSS OF INFORMATION) ARISING OUT OF THE USE OR INABILITY TO USE THIS DOCUMENT, EVEN IF DELL HAS BEEN ADVISED OF THE POSSIBILITY OF SUCH DAMAGES. Dell makes no representations or warranties with respect to the accuracy or completeness of the contents of this document and reserves the right to make changes to specifications and product descriptions at any time without notice. Dell does not make any commitment to update the information contained in this document.
If you have any questions regarding your potential use of this material, contact: Dell Inc.
Attn: LEGAL Dept 5 Polaris Way Aliso Viejo, CA 92656
Refer to our web site (software.dell.com) for regional and international office information. Patents
This product is protected by U.S. Patents #: 7,979,245 and 8,175,862. Additional Patents Pending. For more information, go to http://software.dell.com/legal/patents.aspx.
Trademarks
Dell, the Dell logo, and Foglight, IntelliProfile, PerformaSure, and Tag and Follow are trademarks of Dell Inc. "Apache Tomcat" and "Tomcat" are trademarks of the Apache Software Foundation. AIX, IBM and WebSphere are trademarks of International Business Machines Corporation, registered in many jurisdictions worldwide. HP is a registered trademark that belongs to Hewlett-Packard Development Company, L.P. Linux is the registered trademark of Linus Torvalds in the United States, other countries, or both. Microsoft, Windows, Active Directory, Internet Explorer, Hyper-V, SharePoint, and SQL Server are either registered trademarks or trademarks of Microsoft Corporation in the United States and/or other countries. Oracle, Oracle Solaris, Java, and WebLogic are registered trademarks of Oracle and/or its affiliates. MySQL is a registered trademark of MySQL AB in the United States, the European Union and other countries. Novell and eDirectory are registered trademarks of Novell, Inc., in the United States and other countries. Ubuntu is a registered trademark of Canonical Ltd. Mozilla and Firefox are registered trademarks of the Mozilla Foundation. Mac OS and Safari are registered trademarks of Apple Inc. Google and Chrome are registered trademarks of Google Inc. The X Window System and UNIX are trademarks of The Open Group. VMware, ESX, ESXi, vSphere, and vCenter are registered trademarks or trademarks of VMware, Inc. in the United States and/or other jurisdictions. Symantec and Veritas are trademarks or registered trademarks of Symantec Corporation or its affiliates in the U.S. and other countries. Other names may be trademarks of their respective owners. OpenLDAP is a registered trademark of the OpenLDAP Foundation. "Red Hat", "JBoss" and the JBoss logo are registered trademarks of Red Hat, Inc. Other trademarks and trade names may be used in this document to refer to either the entities claiming the marks and names or their products. Dell disclaims any proprietary interest in the marks and names of others.
Foglight for SQL Server User and Reference Guide Updated - October 2014
Software Version - 5.7.0 Cartridge version 5.7.0 Legend
CAUTION:A CAUTION icon indicates potential damage to hardware or loss of data if instructions are not followed.
WARNING: A WARNING icon indicates a potential for property damage, personal injury, or death.
Contents
Introduction to this Guide . . . 6
Overview . . . 6
Running the Upgrade Wizard . . . 7
Migrating Agents . . . 8
About Monitoring Extensions . . . 9
Installing and Monitoring a Single SQL Server Instance . . . .10
Discovering Multiple Instances to Monitor . . . .12
Adding instances manually . . . .13
Discovering instances by host name . . . .13
Discovering instances by IP range . . . .14
Importing Instances from a File . . . .15
Configuring Multiple Instances for Monitoring using Silent Installation . . . .17
Contents of the Input CSV File . . . .18
Configuring the On Demand Data Port on the Agent Manager Concentrator . . . .19
Using Foglight for SQL Server . . . 22
The Foglight for SQL Server Instance Homepage . . . .22
Viewing the Databases Dashboard . . . .22
Selecting an Instance to Monitor . . . .23
Monitoring SQL Server Reporting Services . . . .25
Foglight for SQL Server Overview Page . . . .30
Reviewing Overall Activity . . . .32
Top 3 busiest resources . . . .35
Viewing the Foglight for SQL Server History Summary Page . . . .37
Viewing the Foglight for SQL Server Real-time Summary Page . . . .40
Tracking the Instance Data Flow . . . .42
Monitoring Data Replication . . . .49
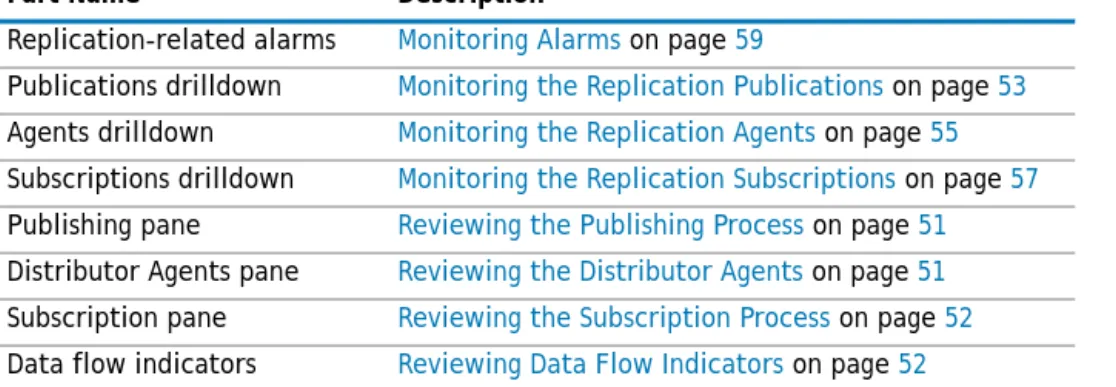
Viewing the Replication Home Page . . . .50
Monitoring SQL Performance . . . .60
Resource Toolbar Options . . . .60
Monitoring SQL Performance without SQL PI configured . . . .64
Monitoring SQL Performance with SQL PI Configured . . . .66
Reviewing Memory Usage . . . .74
Monitoring Memory Area Utilization . . . .74
Monitoring Buffer Cache-related Data . . . .76
Reviewing the Instance Activity . . . .81
Viewing In-depth Data about the Instance . . . .81
Reviewing Database Usage . . . 102
Monitoring SQL Server Databases . . . 102
Monitoring Database Details . . . 104
Reviewing the Services . . . 116
Reviewing the Support Service Status . . . 116
Reviewing SQL Agent Jobs . . . 118
Monitoring SQL Server Transactions using the DTC Panel . . . 120
Monitoring Full-text Indexes using the Full Text Search Panel . . . 120
Monitoring Reports using the Reporting Services Panel . . . 121
Using the HADR Drilldown . . . 122
Monitoring the Log Shipping . . . 122
Monitoring Cluster Services . . . 124
Tracking the Status of the Mirroring Operation . . . 125
Reviewing the Always On Availability Groups . . . 129
Using the Logs Drilldown . . . 134
Reviewing the SQL Server Error Logs . . . 134
Reviewing the SQL Agent Error Logs . . . 134
Reviewing the Foglight Agent Error Log . . . 135
Reviewing Configuration Settings . . . 135
Reviewing SQL Server Configuration . . . 135
Viewing User-defined Counters and Collections . . . 136
Viewing User-Defined Performance Counters . . . 137
Viewing User-Defined Collections . . . 137
Managing Foglight for SQL Server Agent Settings . . . 138
Opening the Databases Administration Dashboard . . . 138
Reviewing the Administration Settings . . . 138
Defining Connection Details . . . 139
Customizing Alarms for Foglight for SQL Server Rules . . . 141
Defining Data Collection and Storage Options . . . 150
Defining Error Log Filtering . . . 151
Configuring Performance Counters . . . 152
Setting Options for Displaying Data in the Buffer Cache . . . 153
Setting Options for Displaying Data in the Plan Cache . . . 153
Setting Options for Displaying Data in the Locks Panel . . . 154
Defining Retention Policies . . . 155
Defining the Collection and Display of Top SQL Statements . . . 155
Defining the Collection of Database Indexes . . . 156
Configuring User-defined Collections . . . 157
Administering SQL Performance Investigator . . . 159
Configuring the On-demand Data Settings . . . 159
Configuring the Database to be Excluded . . . 159
Editing the Response Time Query . . . 160
Reviewing Foglight for SQL Server Alarms . . . 160
Alarms Displayed in the SQL Processes Panel . . . 161
Alarms Displayed in the SQL Memory Panel . . . 163
Alarms Displayed in the Background Processes Panel . . . 166
Alarms Displayed in the Database Details Panel . . . 168
Generating Reports . . . 173
Generating Reports for a Foglight for SQL Server Instance . . . 173
Studying the Various Reports . . . 174
Using vFoglight for SQL Server Add-on . . . 175
Discovering Instances Running in a Virtualized Environment . . . 175
Glossary . . . 179
SQL Performance Investigator Metrics . . . 204
Reference . . . .215
SQL PI Repository Cold Backup Procedure . . . 215
Rules . . . 215
1
Introduction to this Guide
Welcome to the Foglight for SQL Server User and Reference Guide. This guide provides configuration instructions, conceptual information and instructions on how to use the Foglight for SQL Server cartridge. It describes the dashboards included with the cartridge and how they are used for collecting monitoring data from the entire relational database management system, as well as the cartridge’s interaction with and support of additional services and modules, such as replication and virtualization.
This guide is intended for any user who wants to know more about monitoring SQL Server instances through Foglight for SQL Server, and the steps required for discovering and configuring the SQL Server agent. It is also meant for those users who want to learn about the methods used for configuring and applying user-defined settings.
Installing and Configuring Agents
Foglight for SQL Server monitors the SQL Server database activity by connecting to and querying the SQL Server database. The agents provided monitor the SQL Server database system. The dashboards included with the cartridge provide a visual representation of the status of the major components of the SQL Server agents. They allow you to determine any potential bottleneck in database performance.
Upgrading to the Current Version
Starting to work with a Foglight for SQL Server cartridge requires upgrading to the current version of both the cartridge and the Foglight Agent Manager that runs the cartridge.
This chapter contains instructions for using the upgrade wizard.
Overview
Any upgrade of Foglight for SQL Server to the latest version, which is not met by similar upgrade of the database cartridge components, is detected upon opening the Databases dashboard, when the upgrade wizard starts automatically.
Selecting the check box at the bottom left of the screen prevents this wizard from appearing when entering the Databases dashboard. Nevertheless, if several database cartridge components still require upgrade, the need to upgrade them is indicated in the dashboard. The indication is evident both in the caption Upgrade required, which is displayed in red to the right of the requested instance, and in the button Upgrade, which appears only if upgrade is required.
IMPORTANT: Foglight for SQL Server does not support the upgrade method of placing the new version under the folder FGLHOME/upgrade/cartridge folder.
IMPORTANT: If upgrading to the current version of Foglight for SQL Server in a Federation architecture, the upgrade should be applied first to the stand-alone Management Servers (the Federated Children) and then to the central Management Server (the Federation Master). If the Federation Master is upgraded first, this server will display incorrect information regarding the number of instances being monitored, as reported under the Status Summary section. All the same, this information will be displayed correctly on the Federated Children.
Running the Upgrade Wizard
To upgrade the requested instances:
1 Click Upgrade.
The screen that appears now is the same screen that appears by default upon entering the Databases dashboard when one or more database cartridge components require upgrading. While the need for upgrade is indicated for both Foglight for Oracle and Foglight for SQL Server, the upgrade is carried out separately for each database cartridge type.
2 Click Foglight for SQL Server.
3 Select the Agent Managers to upgrade. Figure 1. Select the Agent Managers to install.
4 Click Upgrade the selected Foglight Agent Managers. A progress bar appears.
5 After the upgrade is complete, click Next.
The next screen is used for granting privileges to users that were detected as possibly requiring additional privileges to ensure full functionality.
NOTE: Even though instances whose components need to be upgraded appear in the Databases table, such instances cannot be accessed by clicking them, until they have been fully upgraded.
NOTE: The Other Agents column in the table indicates whether the specified Foglight Agent Manager runs agents of other cartridge types. If a value is displayed in this column, go to Dashboards > Administration > Agents > Agent Status to view which other agents run under the specified Foglight Agent Manager. If the other agents appear in the list below, upgrading Foglight Agent Manager to the latest version is safe. For agents of any other cartridge type, consult the documentation of the respective cartridge types.
• DB_DB2_* • DB_SQL_Server_* • DB_Oracle_* • Sybase_MDA • UnixAgent • WindowsAgent
6 Select the agents displayed in the table and click Validate connectivity.
7 If the status row of one or more agents displays the status Insufficient privileges, complete the following steps:
a Select all agents that require privileges updates, and click Grant privileges.
b In the Grant Database Privileges dialog box, enter a SYSADMIN user name and password. c To view the script used for granting the privileges, click View script.
d Click Grant database privileges.
8 On the Rule Modification Overview page, review the list of modified rules. Modified rules have one of the following states:
• Removed — The rule is obsolete and was deleted from the Management Server. • New — The rule is new in this release. To review its definition, click View new rule.
• Updated — The rule was updated in this release. To review the updated rule, click View updated rule. If a rule targeted for update was modified by a user, the user’s modified rule is copied and disabled before the updated rule is installed. To review the modified rule, click View user-updated rule.
9 Foglight Performance Analysis is no longer supported and has been replace by the SQL Performance Investigator. All Instances that are configured to use Foglight Performance Analysis will be deprecated and replace with the SQL Performance Investigator capabilities.
During this process you are prompted to select a dedicated Agent Manager on which to install an external database repository. The SQL PI configuration will take into account the resources needed for monitoring with SQL PI and will prompt you with further information.
All information regarding the resource allocations needed for SQL PI monitoring can be found in the SQL Server cartridge Hardware Sizing Guide.
Migrating Agents
The SQL Performance Investigator extension is only supported on Windows 64-bit. As a result, you may need to migrate SQL Server agents from an Agent Manager running on Linux to a Windows Agent Manager.
In addition, the migration tool allows you to perform resource balancing between the agent managers running SQL Server agents with and without the SQL PI extension installed.
To migrate an agent to a different Agent Manager:
1 Open the migration wizard by navigating to Dashboards > Databases> Support Dashboard.
2 Select the Agent Manager that will be the destination host for the migrated SQL Agents. Click Next. 3 On the SQL Agents for Migration pane, the left-hand column displays a list of available Agent Managers.
Select an Agent Manager to view a list of the agents installed on it.
4 From the list, select the agents that you want to migrate and move them to the Agent Manager Destination column.
5 If required, select agents and set the Windows credentials.
IMPORTANT: The script for granting privileges is invoked using a popup. To view the script, ensure that pop ups are not blocked on the page.
TIP: To avoid having to repeat rule modifications after an upgrade, do not edit rules with the DBSS prefix in the Rule Management dashboard. Use the Alarms view on the Databases Administration dashboard instead. When you make your edits on the Alarms view, the edits are saved separately and applied over the predefined rules. For instructions, see Customizing Alarms for Foglight for SQL Server Rules on page 141.
6 Click Next to migrate the agents.
7 When migration has completed, click Finish to exit the Wizard.
About Monitoring Extensions
During the installation process you can choose to install and configure one or more of the monitoring extensions. The monitoring extensions provide a more in-depth analysis of the monitored instance and the environment it is running on, creating a whole and unified status.
Understanding the Foglight for SQL Server
Architecture
The communication architecture of Foglight for SQL Server is presented below. Figure 2. Communication Architecture overview.
SQL Performance Investigator Extension
SQL Performance Investigator allows you to rapidly identify bottlenecks, anomalies, and application trends by focusing on top resource consumers and providing multi-dimensional SQL domain drilldowns. SQL PI allows you to:
• Monitor real-time SQL Server database performance at a glance • Gather and diagnose historical views
• Identify and ananticipate performance issues • Analyze and optimize execution plan changes
• Compare day-to-day values to identify anomalies and application changes
NOTE: SQL Performance Investigator requires a license. If you are using a trial version and would like to request pricing, contact https://software.dell.com/register/57891.
Operating System Extension
Monitoring the operating system allows you to identify resource consumption and provides a full view of the server health. An Infrastructure agent, which is created automatically as part of the monitoring process, monitors the operating system.
VMWare Extension
Monitoring the VMWare system allows you to identify resource consumption and provides a full view of the data center and ESX health when the server is part of a VMWare environment.
Installing and Monitoring a Single SQL
Server Instance
Enabling the Foglight Management Server to monitor SQL Server instances requires the creation of the Foglight agents that monitor these instances and ensuring that these agents communicate properly with the Foglight Management Server.
Foglight for SQL Server provides a graphic, intuitive method for creating and configuring multiple agents, which can be used instead of Foglight’s default method for creating agents and editing their properties using the Agent Administration dashboard (see About the Foglight for SQL Server Agent in the Foglight for SQL Server Reference Guide). Foglight for SQL Server allows running a wizard that provides a common entry point for adding and discovering all database instances within a user-specified range, and then configuring these instances for monitoring.
To run the instance installation wizard:
1 On the navigation panel, click Homes > Databases.
2 Click Add > SQL Server in the upper left corner of the Databases View. Figure 3. Add > SQL Server button.
The Monitor SQL Server Instance dialog box apears.
3 Choose the agent manager on which the agent will be running The default is the agent manager with the least agents installed.
NOTE: SQL PI requires a repository database that is installed automatically on the Agent Manager.
NOTE: The Operating System extension is enabled by default.
IMPORTANT: When running Foglight for SQL Server in a Federation architecture, neither the creation nor the administration of agents can be accomplished from the central Foglight Management Server (the Federation Master). These two tasks should be carried out from the stand-alone Management Servers (the Federated Children).
NOTE: If a user-defined database group is currently selected, the databases table's title displays the name of this group instead of All; however, all newly discovered or created databases are added to the general (All) group of databases.
a Click the Monitoring agent will run from host <agent manager> link located in the bottom left
corner of the dialog box.
A dialog box appears with a list of all agent managers connected to the Foglight management server.
b Select the appropriate host name and click Set.
4 On the Monitor SQL Server Instance pane, provide connection details by typing:
• Server name — for the default instance, specify the host name. If you have more than one instance on the server you must name the instances using the format: domain\user name. • Port — Optional. This field can be left empty, unless the TCP/IP connection port is not the default
port: 1443.
5 Specify the SQL Server credentials using one of the following authentication methods:
• Windows Authentication — log in using a Windows user account. The user name should be typed in the following format: domain\user name
• SQL Server Authentication — log in using a SQL Server account • Use the Windows account running your agent
6 Optional — In the Monitoring Extensions pane, click the SQL PI monitoring extension. You are prompted to choose the Agent Manager on which the SQL PI repository will be installed.
7 Optional —In the Monitoring Extensions pane, click the Operating System link.
To configure the extension, choose the connection details of the host on which the SQL Server instance is running:
• Log in to the host using the same account used for monitoring SQL Server — This option is set by default when the SQL Server connection details are of types: Windows Authentication or Using the Windows account running your agent manager.
• Log in to the host using different login credentials - logging in through a Windows user account. The user name should be entered in the domain\username format (for example,
COLUMBIA\JSmith).
8 Optional — In the Monitoring Extensions pane, click Collect VM statistics.
To configure the extension, select the connection details of the vCenter or ESX on which the SQL Server instance is running:
• The name of IP address of the vCenter server that hosts the SQL Server instance virtual machine, or the name of its parent ESX server
• The port number used by the vCenter server system or by ESX server for listening to the connections from the vSphere Client (default: 43).
• The name and password of the user that has the privileges required for connecting to the vCenter server or ESX server and retrieving information.
9 Click Monitor.
10 When the installation completes successfully, the Monitoring Initialized Successfully dialog box appears. Click Add another Database or Finish to exit.
IMPORTANT: You have the option set this host as the default for all future installations.
IMPORTANT: If the monitoring verification fails click the message that is displayed on the Status column and resolve the issue according to the instructions that appear in the dialog box. For example, (for example: insufficient privileges, incorrect credentials or an Agent Manager that reached its full monitoring capacity.
Discovering Multiple Instances to Monitor
You can use the instance installation wizard to discover existing instances. This option allows you to discover instances and monitoring them by entering several methods:• By host name • By IP range
• By entering a file with a predefined instances.
To discover additional instances to monitor:
1 In the upper left corner of the Databases View, click Add > SQL Server . The Monitor SQL Server Instance dialog box apears.
2 Click the Use this option to discover your SQL-Server instances link. The Select an Agent Manager dialog box appears.
3 Choose an Agent Manager host and click Next.
4 Click Add instances and select one of the following methods for adding instances: • Adding instances manually - see Adding instances manually on page 13
• Discovering instances by hosts - see Discovering instances by host name on page 13
• Discovering instances by IP range - see Discovering instances by IP range on page 14. • Importing instances names from a file - see Importing Instances from a File on page 15 5 After the discovery process is successfully completed, the newly discovered instances appear on the
table, with the status Set credentials.
6 Click the check boxes beside the instances whose credentials are to be configured.
7 Click Set credentials to provide the instances' login credentials and monitoring configuration. 8 Follow the steps described in Installing and Monitoring a Single SQL Server Instance on page 10,
beginning with Step 4 to enter the monitoring credentials and enable the monitoring extensions for this instance.
9 Click Monitor
The Monitoring progress bar appears.
At the end of this process, the Status column of the instance table displays either the status Monitored for the instances that connected successfully to the database, or a status that indicates failure of the connectivity verification process and the reason for the failure. Click this text to view a
IMPORTANT: At the bottom of the pane you can select a default agent manager for all future installations.
IMPORTANT: There is an additional option for the SQL Server connection details to use an SSL connection. The default is set to Optional, or you can choose Off or Mandatory. NOTE: To use stored credentials when enabling the Operating System monitoring extension, click the Operating System > Select from stored credentials link to open the Stored Credentials dialog box. Here you can review the login credentials and authentication methods used for logging in to Foglight. Foglight stores encrypted credentials in lockboxes, which may be password-protected for added security. Database agents store all user login credentials in a default lockbox called DB-Agent Lockbox. If credentials have already been entered in another lockbox, use the Lockbox list to select from that lockbox.
dialog box that allows changing the credentials or to grant privileges, depending on the message that appears on the Status column:
• If the message is Insufficient database privileges, this issue can be resolved using the Insufficient Database Privileges dialog box that appears. For details, go to Step 10.
• For all other messages, the Database Connection Failed dialog box appears. For details, go to Step 11.
10 Click the text Insufficient Database Privileges. The Insufficient Database Privileges dialog box appears.
This dialog box allows you to specify a SYSAdmin (System Administrator) user with sufficient privileges. Enter a SYSAdmin user and password, and then click Grant Privileges. Alternatively, click the View script link, to the right of the Grant privileges button, to grant privileges manually by means of a script. 11 Click the message’s text.
A dialog box that shows the message details appears. a Click Show details to view the error’s description.
b Click Set credentials to display the dialog box used for entering the credentials, and enter the required changes.
Adding instances manually
To add instances manually:
1 Click Add instances. 2 Click Add manually.
The Add New SQL Server Instance dialog box appears. 3 Use this dialog box to enter the following details:
• Server name — the SQL Server instance name. For default instance, specify the host name; for named instance, use the format: host name\instance name.
• Port — Required for a SQL Server instance whose TCP/IP connection port is other than the default port (1433).
4 Click Finish.
The newly added instance now appears on the table, with the status Set credentials. 5 Proceed with the wizard, starting from Step 5 on page 12.
Discovering instances by host name
Searching by host is the most efficient search method for discovering instances over a specified, usually small number of hosts.
To search by host:
1 Click Add instances.
2 Select the Discover SQL Server Instances by Hosts dialog box appears.
IMPORTANT: If no port is specified, the wizard will use the port provided by the SQL Browser service (dynamic port), in which case this service must be started. After the instance monitoring configuration is complete, instances whose port was provided by the SQL Browser service have the number 0 displayed in their Port row.
3 Type the host names in the field below the first check box. To specify multiple host names, separate the values by comma.
Alternatively, if Foglight already monitors one or more hosts in the selected environment, select the requested host from the table of hosts currently known to Foglight.
4 Click Discover.
At the end of this process a table appears, displaying the newly discovered instances within the selected hosts.
5 Select the instances to be monitored. 6 Click Finish.
The newly added instance now appears on the table, with the status Set credentials. 7 Proceed with the wizard, starting from Step 5 on page 12.
Discovering instances by IP range
Searching by IP range is the recommended search method for discovering database instances over a large number of hosts, thereby saving the need to specify the host names and ports.
To search by IP range:
1 Click Add instances. 2 Click Discover by IP.
The dialog box Discover SQL Server Instances by IP Range appears.
IMPORTANT: Ensure typing host names and not IP addresses. IP addresses are
supported only when searching by IP range, as detailed in section Discovering instances by IP range on page 14.
IMPORTANT: The table lists all of the hosts known to Foglight, regardless of the cartridge type, and including virtual hosts if the VMware cartridge is installed and configured.
The IP range displayed by default is determined by the IP address and the subnet mask on the selected Foglight server.
3 In the From box, type the IP Range.
4 In the To box, type the requested IP Range.
5 Click Discover.
At the end of this process a table appears, displaying the newly discovered instances within the selected hosts.
6 Select the instances to be monitored. 7 Click Finish.
The newly added instance now appears on the table, with the status Set credentials. 8 Proceed with the wizard, starting from Step 5 on page 12.
Importing Instances from a File
Foglight for SQL Server supports importing an unlimited number of existing SQL Server instances that need to be monitored, using a predefined Regserv file that includes the properties of these instances.
IMPORTANT: Ensure that the numbers entered are within the range of 0 - 255.
IMPORTANT: Ensure that the numbers entered are greater than those entered in the From box, and that the address range does not exceed 1000 addresses.
IMPORTANT: The Regserv file can also be created by exporting the list of registered servers in SQL Server Management Studio. To do that, click View > Registered Servers, and then, in the Registered Servers pane, right-click the Local Server Groups folder and select Tasks > Export (see the following figure). Note that the authentication method defined when registering a server is not kept.
Figure 4. Exporting the list of registered servers.
To prepare a Regserv file:
1 Create a new file.
2 Assign the file a descriptive name, such as imported_instances.regsrvr. 3 In this file, type the connection details for each instance in a separate row.
Foglight for SQL Server supports monitoring of both named instances and default instances. Use the following format for named instances:
<DB type (MSSQL)>,<host1 name>,<instance1 name>,<DB port (0 for default)>.
For default instances use the following format:
<DB type (MSSQL)>,<host1 name>,,<DB port (0 for default)>.
The following examples show how to enter named instances (the first and second instances) and default instances (the third and fourth instances).
MSSQL,MyHost1,MyInstance1,0 MSSQL,MyHost2,MyInstance2,1434 MSSQL,MyHost1,,0
MSSQL,MyHost2,,1434
4 Save the file.
To import the predefined Regserv file:
1 Click Add instances. 2 Click Import from file.
The dialog box Import SQL Server Instances from Fileappears. 3 Click Choose file.
4 Browse for the selected file. 5 Click Import.
At the end of this process a table appears, displaying the instances whose connection details appear in the file.
6 Select the instances to be monitored. 7 Click Finish.
8 Proceed with the wizard, starting from Step 5 on page 12.
Configuring Multiple Instances for
Monitoring using Silent Installation
To add multiple agents using the silent installation through a command line interface:
1 Navigate to Administration > Cartridges > Components for downloads.
2 Click the download icon in the Installer column to download DB_SQL_Server_CLi_Installer row. The Download Message dialog box appears.
3 Review the details in this dialog box, and click Download. The downloaded ZIP file contains the following files:
• README.txt file
• mssql_cli_installer.groovy — a groovy script file that runs the silent installation. This file
should be copied to the <FMS_HOME>/bin directory.
• silent_installer_input_template.csv — a template file that should serve as the basis
for inserting contents into the input CSV file. This file can be copied to any folder of your choice, provided that the path indicated by the <csv_instances_file_name> parameter (see below)
points to the selected path. For details about the contents of this file, see Contents of the Input CSV File on page 18
4 Extract the ZIP file to a directory of your choice.
5 Copy the mssql_cli_installer.groovy file to the <FMS_HOME>/bin directory.
6 Go to the command line and execute the command: <FMS_HOME>/bin/fglcmd -srv <fms_host_name> -port <fms_url_port> -usr <fms_user_name> -pwd
<fms_user_password> -cmd script:run -f mssql_cli_installer.groovy fglam_name <fglam_name> instances_file_name <csv_instances_file_name> lockbox_name <lockbox_name> lockbox_password <lockbox_password>
The descriptions of the flags and parameters in this command are as follows: • <FMS_HOME>: The Foglight Management Server installation directory.
• <fms_host_name>: Name of the host where the Foglight Management Server is installed. • <fms_url_port>: The Foglight Management Server port.
• <fms_user_name>: The user name used for connecting to the Foglight Management Server. • <fms_user_password>: The password of the specified user.
• <clusters_file_name>: The full path and the name of the input CSV file.
• <lockbox_name>: Optional — specifies the name of an existing lockbox to be used. • <lockbox_password>: Optional — the selected lockbox's password.
7 After the installation process completes, review the CSV files that are created in the same folder where the input file resides:
• A file with the input file's name and _status suffix (for example: if the input file is named input, this file is named input_status).
This file indicates the monitoring situation of all SQL Server instances listed in the input CSV file. If monitoring failed for one or more of the instances, the file specifies the error message.
The _status file includes the name of the monitored Foglight for SQL Server agent, the result of
the monitoring validation process - MONITORED, FAILED, or AGENT EXISTS - and the error message, in case the agent creation failed.
• A file with input file's name and _new suffix (for example: if the input file is named input, this
file is named input_status).
This file, which is only created if one or more instances failed the monitoring validation, contains all details about these instances.
Using this CSV file, the user only needs to fix the errors and re-run the script, this time by specifying this file as the input file, that is: the original file name with suffix _new. In the
example used here, the new file should be named input_new.csv.
Contents of the Input CSV File
The input CSV file contains the following fields, which are used as columns in the resulting file: IMPORTANT: If all instances listed in the input CSV file passed the monitoring validation successfully, no additional file is created.
Table 1. Input CSV File
Name Description
Host name The SQL Server host name.
Instance name The name of the SQL Server instance.
DB port (Optional) The SQL Server instance port. If no value is inserted in this field, the port number should match the instance name.
DB credentials Type (Optional)
DB authentication type. The possible values are: • Windows_Default_Account
• Windows_Custom_Account • SQL_Server_Authentication
If this field is left empty, the Windows_Default_Account option is used. DB user name (Optional) The user name required for connecting to the database, if the Windows_Default_Account authentication type was selected. DB password (Optional) The password of the database user name that was selected if the Windows_Default_Account authentication type was selected.
DB power user credentials Type (Optional)
The type of database authentication of a user that can grant privileges to the regular database user. The possible values are:
• Windows_Default_Account • Windows_Custom_Account • SQL_Server_Authentication.
If this field is left empty, the grant privileges script will not run. DB power user name
(Optional)
The user name of a user that can grant privileges to the regular database user.
DB power password (Optional)
The password of the database power user name mentioned above; required only if the regular user does not have sufficient privileges. Should monitor OS Specifies whether to create an Infrastructure Cartridge agent for the given host name; the possible values are either True or False.
Configuring the On Demand Data Port on the Agent
Manager Concentrator
If a firewall is installed between the Management Server and the Agent Manager, a bidirectional On Demand Data Port connection is not possible because On Demand data requests require direct connection.
This issue can be resolved by creating an On Demand Data Port on the concentrator - an Agent Manager instance that works similarly to an HTTP proxy. This On Demand Data Port can be configured to accept On Demand data requests from the Management Server and direct them to the Agent Manager instances (called downstream instances). For additional details about the concentrator, see Configuring an Agent Manager Instance as a Concentrator in the Agent Manager Installation Guide.
Figure 5. On Demand Data Port connection with firewalls installed. OS credentials Type
(Optional)
OS authentication type; can have one of the following values: • Windows_Default_Account
• Windows_Custom_Account
If this field is left empty, the Windows_Default_Account value is used by default.
OS user name (Optional)
The user name required for connecting to the OS if the
Windows_Default_Account option was selected. The user name should be compatible with the selected authentication type.
If the Windows_Default_Account value was selected, this field can be left empty.
OS password (optional)
The password of the OS user specified above; if the
Windows_Default_Account option was selected, this field can be left empty.
Enable VMware Collection
(Optional) Specifies whether to monitor VMware metrics; the possible values are either True or False. VMware Host (Optional) The VMware host name.
VMware Port (Optional) The VMware port. If no value is inserted in this field, the port number will used the default port number 443. VMware User Name
(Optional)
The user name required for connecting to the VMware. VMware Password
(Optional)
The password of the VMware user specified above. Table 1. Input CSV File
A concentrator agent, created specifically for Foglight for SQL Server, allows controlling the On Demand Data Port so that the server is initialized (starts collecting data) when the agent starts, and stops when data retrieval by the agent is brought to an end. The agent, which is created manually by the user, requires configuring the following parameters:
• A list of the downstream hosts that are connected through the concentrator • The RMI port number
Each time the Foglight Management Server sends RMI request, the list of downstream hosts submitted by the concentrator agent is being searched, as follows:
• Inclusion of the target RMI server host name within this list indicates that a FglAM concentrator exists, in which case a connection is made to the proxy RMI server.
• If the list does not contain the target host name, the connection is made directly to the target On Demand data port server.
To create the concentrator agent:
1 Go to Dashboards > Administration > Agents > Agent Status. 2 Click Create Agent.
3 Select the agent type DB_SQL_Server_Concentrator. 4 Enter a name of your choice.
5 Click Create.
6 After the creation process is completed successfully, click OK.
To edit the concentrator agent connection details:
1 Select the newly created concentrator agent. 2 Click Edit Properties.
3 Click Modify properties for this agent only.
4 Enter the number of the proxy On Demand Data Port server port, or accept the default number. 5 Enter the concentrator Foglight Agent Manager host name (optional).
6 Click Edit to edit the list of downstream Agent Managers. 7 Click Add Row.
8 Enter the name of the requested Foglight Agent Manager host.
9 Repeat Step 7 to Step 8 as many times as required. 10 Click Save Changes.
11 Click Save at the lower right corner of the screen. 12 Click Back to Agent Status.
13 Select the newly created concentrator agent. 14 Click Activate.
15 Click OK to complete the process.
IMPORTANT: When editing the properties of the Foglight Agent Manager concentrator (Dashboards > Administration > Agents > Agent Status), the name of the Foglight Agent Manager should be entered in the Downstream FglAMs section exactly as it appears in the topology, under Home > Agents > All agents > <Agent name> > RMI data > Fglam host property. The <Agent name> parameter refers to any of the Foglight for SQL Server agents that reside on the selected Foglight Agent Manager.
In an environment that includes a Foglight Agent Manager concentrator, when upgrading the environment where the concentrator does not contain any regular agents, the concentrator is not upgraded. Therefore, after the upgrade process takes place the Foglight Agent Manager concentrator has to be deployed manually.
2
Using Foglight
for SQL Server
Foglight for SQL Server monitors the SQL Server database activity by connecting to and querying the SQL Server database. The agents provided monitor the SQL Server database system. The dashboards included with the cartridge provide a visual representation of the status of the major components of the SQL Server agents. They allow you to determine any potential bottleneck in database performance.The Foglight
for SQL Server
Instance
Homepage
The Foglight for SQL Server Instance home page provides a quick and intuitive representation of SQL Server instance architecture and activity. Using this home page allows efficient, real-time diagnosis and resolution of SQL Server operation and performance issues.
The home page is displayed in several modes:
• Overview — the Overview page provides various detailed views that are accessible using the toolbar. In addition, this page contains links to the Real-time and History home pages.
• History — the History page allows tracking the instance activity during the time range selected at the upper right corner of the screen.
• Real-time — the Real-time page allows using various indicators for monitoring the current activity of the selected instance.
The Real-time page home page comprises several panes, each of them relating to areas of the SQL Server's architecture through performance metrics. These panes are connected by a series of graphical flows that represent the logical process flows between the areas of SQL Server's architecture. The various graphical elements and metrics change color as their values move through a range of thresholds, and the data flows' values are updated in real time to illustrate the rate at which data is moving through the system.
Viewing the Databases Dashboard
The Instance home page is launched by accessing the Databases dashboard.
To access the Databases dashboard:
1 Ensure that the navigation panel on the left is open.
To open the navigation panel, click the right-facing arrow on the left. 2 On the navigation panel, click Homes > Databases.
The Databases dashboard provides an at-a-glance view of the monitored environment, with all of the currently monitored database types.
NOTE: The following section describes the various components of the Databases dashboard. To learn how to customize this dashboard’s display and focus on a requested instance, see Selecting an Instance to Monitor on page 23.
The Databases dashboard comprises the sections listed below:
• Database cartridge type tiles — each tile represents a database type (SQL Server, Oracle, Sybase, DB2, or All) and displays the number of instances for each database type, along with a breakdown according to the instance health state severity (Normal, Warning, Critical, Fatal).
• Status section — includes the following components:
• Status summary — a color-coded bar, which provides a visual representation of the summarized health condition of all instances listed in the Database Group table.
The status summary bar provides a graphic representation of the monitored environment’s current state, broken down to the number of instances and their current health state: Fatal, Critical, Warning, Normal or Unknown.
• Database-specific health summary — when the database group All is selected, this section displays all of the currently monitored instances for each database type, divided by their health state (for example: four SQL Server instances, three of which have the health state Warning and one is indicated with the health state Fatal). When a user-defined database group is selected, this section displays data only about the agents included within the selected group.
The Status Indicators section can be used for filtering the Databases Group table to display only instances that meet a criterion set in this section. For details, see Filtering the Display by Severity on page 26.
• The Add button — use this button to add instances to be monitored. For details, see Monitoring Data Replication on page 49.
• The Agent Settings button — after selecting one or more instances of the same database type, use this button to set options for collecting, storing, and displaying data for the selected instances, as well as configuring the connection to SQL Performance Investigator (if installed). For details, see Managing Foglight for SQL Server Agent Settings on page 138.
• Currently selected database group table — a list of all monitored databases within the database group that is currently selected in the Databases section. For details, see Currently Selected Database Group on page 24.
• The Go to Overview ( ) button — provides direct link to the Overview drilldown.
• The Select dashboards ( ) button — provides direct link to several drilldowns and panels, thereby saving the need to navigate to these locations through the Overview drilldown.
Selecting an Instance to Monitor
Because the Databases dashboard displays by default all of the currently monitored databases, it is advisable to customize the dashboard’s view to display only the relevant instances, and then preview such instances to decide which to monitor.
To select an instance to monitor:
1 Display only instances relevant for your needs, using one of the following methods:
• Filter by database type — if multiple database types are being monitored, click the database type tile that represents the requested type (in this case, SQL Server).
NOTE: The Status Indicators section can be used for filtering the Databases Group table to display only instances that meet a criterion set in this section. For details, see Filtering the Display by Severity on page 26.
IMPORTANT: If the display is filtered to show only SQL Server instances the Databases table is renamed to SQL Server Instances, and a new tab titled Reporting Services is shown. For details about this tab, see the following section.
• Filter by severity — use the status indicators to display only instances of a specific database type that share a specific health state severity. For further details, see Filtering the Display by Severity on page 26.
• Create user-defined groups — use the Databases area to create groups that contain only the databases that need to be monitored for a specific need. For further details, see Creating Custom Database Groups on page 26.
2 View the selected instances’ severity level, using the status indicators.
3 Click the requested instance to view a cue card with a preview of the instance’s most significant performance indicators. For details, see Previewing the Requested Instance on page 27.
4 Click Home Page on the cue card to launch a full-screen view of the requested instance.
Currently Selected Database Group
This Databases table displays the group that is currently selected from the available database groups under the Databases section of the navigation pane.
The Databases table contains the following columns:
IMPORTANT: Launching a full-screen view of the requested database by clicking the Home Page link can be carried out only for instances monitored in Foglight for SQL Server mode.
NOTE: Because the currently selected group can contain instances of types of database monitored by Foglight, the table below refers to instances in general.
Table 1. Databases Table
Name Description
Database
Sev The instance’s highest severity alarm, which determines the instance’s health state.
Name The name of the instance.
Version The version number of the instance.
Up Since The date and time when the instance was last restarted. Workload A dwell that displays the workload chart for the instance.
Alarms The number of warning, critical, and fatal alarms for the instance. The dwell shows the most recent alarms invoked for the specific instance displayed in the row. The alarms are displayed by their severity levels, with the aggregated number for each severity. Clicking the alarm’s severity icon displays the Alarm popup, which provides in-depth information about the alarm, its causes and implications. For details, see The Alarm popup on page 36. System Utilization
Host The name of the computer that hosts the instance.
CPU Load (%) The overall operating system CPU usage (including CPU usage by the database).
Memory (%) The percentage, within the total memory, of memory consumed by all operating system processes (including the database). This value includes both RAM resident memory and swapped memory.
Disk (% Busy) The percentage of time the busiest device spent serving system-wide input/output requests. This metric serves as a measure for the system I/O load.
Monitoring SQL Server Reporting Services
Foglight for SQL Server now offers the capability of monitoring the status and the details of SQL Server Reporting Services (SSRS) of version 2008 and later.
SQL Server Reporting Services (SSRS) is part of a SQL Server solution, which provides a central service that supports management, development, and presentation of rich reports.
The reports are based on data derived from various database types (Oracle, DB2, SQL Server, and others). The reporting services provide an optimized and parallel processing infrastructure for processing and rendering reports.
After the data is retrieved, the presentation processing takes place, allowing multiple users to review the same report at the same time in formats designed for different devices. Alternatively, users can change the report's viewing format.
The metadata of the reporting services is stored in the SQL Server instance. Foglight for SQL Server offers the capability of analyzing the metadata and produces detailed reports of the user's activity.
Foglight for SQL Server supports the monitoring of SQL Server Reporting Services at two levels:
• The reporting services environment level — using the Reporting Services tab. Foglight automatically detects the existence of reporting services metadata in the entire environment and, if such metadata exists, the Reporting Services tab appears on the Databases dashboard (Dashboards > Databases) when the display is filtered to show only SQL Server instances. This tab provides high-level analysis and allows reviewing which reports are being served, identifying the reports that have errors, and investigating the reports activity within specific instances. Clicking the icon opens the Reporting Services panel for in-depth investigation.
Agent The operational status of the monitoring agent.
When the agent instance is running, hovering over the Stat icon displays the status message Collecting Data.
When the agent instance is running but not collecting data, hovering over the State icon displays one of the following status messages:
• Starting • Stopped • Stopping • Unknown
OS The state of OS-related data retrieval by the database cartridge, the Infrastructure cartridge, or both.
Diagnostic Indicates whether SQL Performance Investigator (SQL PI) is configured. SQL PI can be installed as part of the Foglight for SQL Server
installation. Table 1. Databases Table
• The instance level — using the Services > Reporting Services panel. This panel shows the Reporting Services configuration for the selected instance and provides information about the reports that were run during the specified time range (failed vs. successful runs, users who generated the highest number of reports, and so on). This panel can also be used for displaying in-depth information about the reports, such as the running time, the users who ran the reports, and parameters used in each run. For details, see Monitoring Reports using the Reporting Services Panel on page 121.
Filtering the Display by Severity
The Status Indicators section can be used for filtering the Databases Group table to display only instances that meet a criterion set in this section.
To filter the display by severity:
1 Click a specific type of severity within a a specific database type (for example, SQL Server instances whose severity level is Fatal).
The selected filter is shown in the table’s title.
2 To select another filter, click the required status indicator (for example, SQL Server > Normal severity). To display the entire list of databases, click Clear filters.
Creating Custom Database Groups
While all existing and newly discovered instances are added to the All list, the Databases area of the navigation pane allows creating, editing, and removing sub-groups of database instances, thereby serving as a filter that allows displaying only a specific, user-defined group of instances.
The Databases area includes the following components, which can be selected from a drop-down list:
• Database Groups — includes by default the All list, as well as the Database Groups list, which serves as the parent group for creating user-defined sub-groups of database instances. Such sub-groups are recognized as Foglight services.
The Database Groups section also displays the highest severity level of the database groups, under the column Sev.
• Services — displays the configured services, which contain at least one object (database topology) that is used by Foglight for SQL Server.
All of the Foglight for SQL Server sub-groups, which were created using the Database Groups section, are displayed also under Services. In addition, Services displays groupings of monitored resources that were created using the Service Builder dashboard, and contain Foglight for SQL Server database topology. The Services section also contains the column SLC (Service Level Compliance), which indicates the current availability of the selected service over a given period of time.
To create a database group:
1 Select the parent database instance group, Database Groups, under Databases in the navigation pane. 2 Click the button.
The Add Sub Group dialog box appears. 3 Type a name for the group in the Name field. 4 Type a description for the group (optional).
5 Select an instance in the Available column, and click [>] to move the instance to the Selected column. Alternatively, click [>>] to move all of the databases to the Selected column.
6 Click OK.
The sub-group name appears in the Database Groups list. The database instances are listed in the Databases dashboard.
After adding one or more user-defined sub-groups, it is possible to add sub-groups to these sub-groups.
To remove a database sub-group:
1 Select the sub group to be removed. 2 Click the button.
The verification dialog box appears. 3 Click Remove.
The sub-group is removed from the Database Groups list.
To edit a database sub-group:
1 Select the requested sub group. 2 Click the button.
The Edit Group dialog box appears.
3 To add an instance to the sub group, select the requested instance in the Available column and click [>]. The selected instance moves to the Selected column.
4 To remove an instance from the sub-group, select the requested instance in the Selected column, and click [<].
The selected instance moves to the Available column. 5 Click OK.
Previewing the Requested Instance
Clicking an instance in the instances group table opens the quick view panel.
NOTE: To directly access the home page of instances monitored in Foglight for SQL Server mode, click the Home Page icon to the right of the instance name.
The quick view provides a preview of the instance’s most significant indicators, using the following sections: • General — identical to the home page’s Instance pane.
This section provides the following details:
• DB Type — identifies whether the database type of the monitored instance is SQL Server, Sybase, DB2, or Oracle.
• Version — identifies the database version number, along with the most recently installed service packs.
• Up Since — identifies the date and time when the SQL Server instance was last started. • Host — identifies the host’s name.
• OS Cluster — indicates whether the instance is part of an OS cluster.
• Alarms — displays the number of warning, critical, and fatal alarms for the instance.
• SQL Performance — opens the History drilldown, which displays SQL performance related data, either at a high-level or in-depth. This option is available only for instances that have SQL PI configured.
• HADR — indicates whether one or more of the following services are configured:
• Mirroring — points out whether one or more databases within the monitored instance take part in a mirroring operation, either as a principal database whose exact copy is mirrored on a different instance, or as a mirror database. For details, see Tracking the Status of the Mirroring Operation on page 125.
• Log shipping — used for setting up backup databases to take the place of a current “live” database if that database goes down. For details, see Tracking the Status of the Mirroring Operation on page 125.
• Replication — for details, see Configuring the On Demand Data Port on the Agent Manager Concentrator on page 19.
• Always On — for details, see Reviewing the Always On Availability Groups on page 129. • Cluster Aware — indicates whether the instance is part of a SQL Server cluster. Selected instance
QuickView
Go to Overview button
Opens the Replication home page Opens the
Overview Select dashboard
Opens the SQL Performancepage
• Host — displays the following indicators about the operating system’s performance: • CPU load
• Memory utilization • Disk utilization
• Storage — displays the storage’s total percentage of used space, as well as the following indicators: • Total number of file groups
• Total number of files
• Total volume of occupied disk space, in gigabytes
• Workload — the workload (average active sessions) graph for the SQL Server instance, plotted over the specified time range (by default: last 60 minutes).
The Workload section also contains the following buttons:
• Overview — allows accessing the Foglight for SQL Server Overview page.
• Replication — this button, which is enabled only when the monitored instance is detected as a distributing instance, allows accessing the Replication home page. For more information, see Configuring the On Demand Data Port on the Agent Manager Concentrator on page 19.
• SQL Performance — opens the SQL Performance drilldown, which displays performance related data, either at a high-level data for all instances or in-depth data, available only for databases which are configured with SQL Performance Investigator. For details, see Monitoring SQL Performance on page 60.
Components Shared by all Foglight
for SQL Server
Screens
The tables’ Customizer button and the In-context action button, described below, are common to all Foglight for SQL Server screens, drilldowns, and panels.
Figure 1. Customizer button
Figure 2. Agent settings button
• The Customizer button — found on the upper right corner of most tables. This button allows inserting additional fields to grids and creating a custom filter. The filter is created by clicking Customizer and specifying the criteria that the various values should meet in order to be displayed in the table (having a specific name, exceeding a certain size, and so on). For detailed instructions and examples, see Foglight User Guide > Working with Dashboards > Working with Tables.
• In-context actions button — found on the upper right corner of all screens. This button provides the following options:
• Agent settings — opens the relevant view in the Databases Administration dashboard, where available (for example, clicking this button from within the Activity > Locks panel opens the Locks view).
• Refresh — clicking this button retrieves the most recent data sample.
• Investigate in SQLServerPedia — click this link to open a context-sensitive search in a free, interactive resource, powered by Dell Software and edited and administered by SQL Server professionals. This site provides abundant content, well-categorized and easy to reach, about topics such as SQL Server architecture and configuration, monitoring SQL Server, and performance tuning.
• Ask the Dell community — allows searching within Dell communities on database management, a central knowledge base about all of Dell Software’s Foglight for Databases monitoring products. • Contact support — provides direct access to Dell technical support
(https://support.software.dell.com/essentials/contact-technical-support), allowing you to create a support case.
Foglight
for SQL Server
Overview Page
The Foglight for SQL Server Overview page provides various detailed views that are accessible using the toolbar. In addition, this page contains links to the Real-time and History home pages.
Breakdown and Baseline Chart Formats
Several charts can display information in either of the following formats:
• Baseline format — where a selected individual metric is displayed as a single line.
• Breakdown format — a representation of actual activity of a metric or a set of metrics, compared with the typical behavior of these metrics for the selected time range. A breakdown display can also present a single metric divided by various components (for example, space utilization divided by the various components that occupy this space).
Home Page Toolbar
The Foglight for SQL Server Overview page provides the following toolbar buttons: Table 2. Options on the Overview page.
Name Description
Summary Opens the Summary drilldown, which contains the following panels: • Overview page — see Reviewing Overall Activity on page 32. • History Summary — see Viewing the Foglight for SQL Server History
Summary Page on page 37.
• Real-time Summary — see Viewing the Foglight for SQL Server Real-time Summary Page on page 40.
SQL Performance Opens the SQL Performance History drilldown, which displays SQL performance related data at the following levels:
• High-level data — delivered through the History view or the Lock Analysis view. For details, see Viewing Metrics on page 64 and Blocking History on page 64
• In-depth data — available only for instances that have SQL PI configured. The SQL Performance drilldown contains the following panes:
• Investigate — see Monitoring SQL Performance with SQL PI Configured on page 66
• History — see Viewing Historical Metrics on page 68
• Change Tracking — see Viewing Change Tracking on page 71
• Lock Analysis — see Blocking History on page 64
Memory Opens the Memory drilldown described in Reviewing Memory Usage on page 74. The Memory drilldown contains the following panels:
• Summary — see Viewing the Memory Summary on page 74.
• Buffer Cache — see Monitoring Plan Cache-related Data on page 78. • Plan Cache — see Monitoring Plan Cache-related Data on page 78.
Activity Opens the Activity drilldown described in Reviewing the Instance Activity on page 81.
This drilldown contains the following panels:
• SQL Instance Summary — see Reviewing the SQL Server Instance Activity on page 81.
• SQL I/O Activity — see Viewing SQL I/O Activity Data on page 85. • Sessions — see Reviewing Session Details on page 90.
• Locks — see Monitoring Locks and Latches on page 95.
• Blocking (Current) — see Tracking Current Lock Conflicts on page 97. • Deadlocks — see Tracking Deadlocks and their Affected Objects on page 98. • I/O by File — see Viewing I/O Statistics by Database Files on page 100. Databases Opens the Databases drilldown described in Reviewing Database Usage on page