Modern Energy Optimization Techniques for Green Cloud
Computing
David Donatucci
Division of Science and Mathematics
University of Minnesota, Morris
Morris, MN 56267
[email protected]
ABSTRACT
Energy consumption has become a growing concern for cloud computing data centers as demand for instantaneous web-based services has increased. Energy optimization algo-rithms are used to reduce energy and make data centers more sustainable. Some algorithms focus on reducing power consumption of hardware while others use geographic loca-tion and renewable resources.
This paper discusses two types of modern energy opti-mization algorithms that create a more sustainable, green cloud.
Keywords
Cloud Computing, Green Computing, Energy Optimization, Evolutionary Multi-Objective Algorithms
1.
INTRODUCTION
Cloud Computing has been growing rapidly in the last sev-eral years in order to accommodate a growing demand for internet services. Due to this growth, additional and larger data centers are required to meet demand. With more data centers, an increasing amount of power is necessary. In 2000, only about 70 TWh of energy was consumed worldwide to power data centers. In 2010, approximately four times the energy, 271 TWh, was used by data centers or 1.5% of all energy consumed in the world [6]. In light of these stagger-ing numbers, much research has been devoted to reducstagger-ing power consumption. So far, two different approaches have been implemented to reduce the carbon footprint of data centers: macro-based and micro-based methods. Macro-based methods focus on exploiting data centers in diverse geographical locations that have higher levels of renewable energy or cooler climates. Micro-based methods focus on ef-ficient resource allocation of data center components [3]. In this paper, we will consider both macro and micro-based gorithms that use various techniques such as evolutionary
al-This work is licensed under the Creative Commons Attribution-Noncommercial-Share Alike 3.0 United States License. To view a copy of this license, visit http://creativecommons.org/licenses/by-nc-sa/3.0/us/ or send a letter to Creative Commons, 171 Second Street, Suite 300, San Fran-cisco, California, 94105, USA.
UMM CSci Senior Seminar Conference, December 2014Morris, MN.
gorithms, gossip-based protocol and the Hungarian method of assignment. Description of these techniques along with a background in cloud computing will be provided in Section 2. Section 3 discusses a macro-based algorithm. Section 4 pro-vides details on micro-based algorithms. The results of these algorithms are presented in Section 5. Next, ramifications of these algorithms are presented in Section 6. Comparisons between these algorithms will not be discussed due to the fact that the algorithms were optimizing different parame-ters and there was not a standard representation of result data.
2.
BACKGROUND
In order for the reader to fully understand the material presented in this paper, we will introduce some necessary background information.
2.1
Cloud Computing
In the last several years, cloud computing has become a prevalent service. Cloud computing pertains to both the applications services provided via the Internet and the hard-ware and systems softhard-ware in data centers. Inside these data centers are a copious amount of servers (the hardware) managed by middleware (software that communicates be-tween servers). These components make up what is called thecloud [1]. Usually, large IT firms calledproviders, such as Google or Amazon, own large data centers that contain the hardware and system software. However, these large IT firms have extra servers beyond their own needs and rent them to smaller companies providing a relatively cheap sys-tem to compute in the cloud.
The workload on the cloud is the number of requests for service at a given time. A cloud is considered to be in over-load if there is not enough resources to handle all of the service requests. In order to provide a high quality of ser-vice,QoS, the providers sign a service level agreement,SLA, that requires them to fulfill these requests in a set amount of time.
2.2
Evolutionary Multi-objective Optimization
Algorithms (EMOA)
Evolutionary Computation [5] is based around the inter-actions of individuals. As in biological evolution, a group of individuals makes up a population. In biological evolu-tion and natural selecevolu-tion, organisms within a populaevolu-tion compete in order to survive and reproduce. Individuals best adapted to their environment have the best chance of
ful-Figure 1: Example of an individual that is a poten-tial solution to assigning cloud services,Si, to data
centers, Dj. Here is an individual with six services
employed by the provider that are assigned to a total of four data centers.
filling these objectives. In an evolutionary multi-objective optimization algorithm, EMOA, individuals are similar to organisms in biological evolution but contain a potential so-lution to a given problem with many user-defined objectives such as maximizing renewable energy and reducing cooling energy at the same time, see Figure 1. Individuals, in this case, are stored as an array with the indices corresponding to a cloud service and the elements of the array correspond-ing to the data center in which that service is placed. Like organisms, individuals also compete, but here competition is set up in such as way that those individuals that provide closer solutions to all user-defined objectives have the best odds. The goal of EMOAs is to produce a set of individu-als that provide quality solutions in a reasonable amount of time.
At the beginning of an EMOA, a population is randomly initialized. The initial population then competes in order to be selected to produce the next generation based on the quality of solution they provide. For the purposes of this pa-per, we will discuss binary tournament selection, although there are many different methods to select individuals to al-ter. Binary tournament selection is where two individuals are randomly chosen from the population, and the individ-ual that is more optimized is selected as a parent. This process is repeated to obtain a second parent. The selected parents can propagate their configurations to the next gener-ation by two methods. The first and most common method is crossover, comparable to sexual reproduction, where el-ements from each selected parent are combined to form a new individual in the next generation. The second method is mutation, in which a single parent is selected and partial altered randomly, much like biological mutation. Crossover and mutation are utilized across multiple generations, until a set of optimized solutions are found when some sort of resource limit is reached.
2.3
Gossip-based Protocol
Gossip-basedprotocol acts exactly as the name implies. A node which contains new information selects multiple nodes called peers to spread new information to. The selection of peers is often probabilistic and therefore there can be a range of peers. The act of spreading the information is called a round. In the next round, each of the peers that received the information selects more peers to spread the information to. As more rounds are completed, all of the nodes eventually obtain the same new information [6].
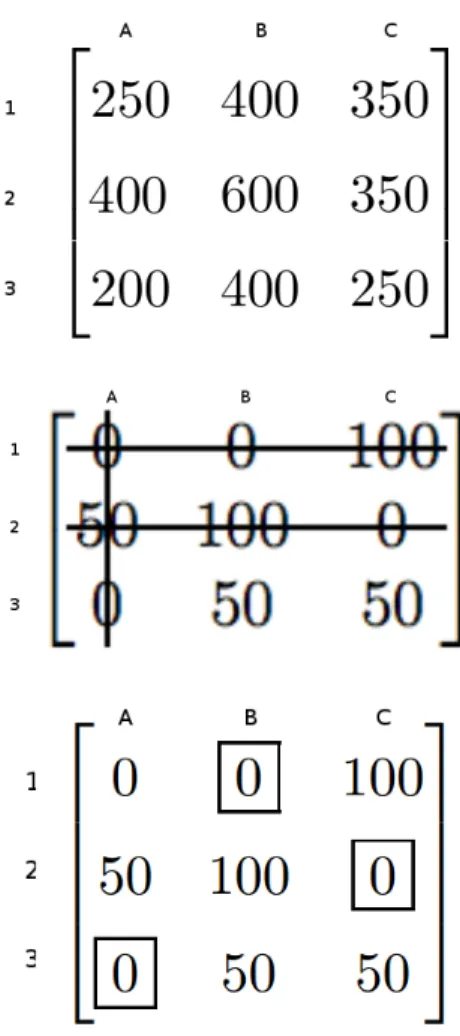
Figure 2: Computing the Hungarian method cost matrix for servers A,B,C and jobs 1,2,3. Matrix elements represent energy consumption in Watts. The optimal solution (job to server) is 1-B, 2-C, 3-A
2.4
Hungarian Method of Assignment
The following describes the general procedure of the Hun-garian Method of Assignment. The Hungarian Method of Assignment uses an×ncost matrix with respect to energy (as seen in Figure 2) to find the least power consuming con-figuration of server to job placement. Rows and columns represent jobs and servers respectively [2]. The matrix el-ements represent the amount of power placing a job onto a server. To find this configuration, we first subtract the smallest wattage in each row from all the entries of its row. Similarly, we subtract the smallest wattage (after rows have been subtracted) in each column from all entries in its col-umn. After subtraction, the new cost matrix will have some number of zero entries. Since we only subtract the mini-mum entries, there will not be any negative entries. We draw lines through appropriate rows and columns so that all the zero entries of the cost matrix are covered and the minimum number of such lines is used. If the number of lines is equal ton then there is an optimal solution. However, if the number of lines is not equal to n, then we determine the smallest entry not covered by any line. We subtract this
entry from each uncovered row, and then add it to each cov-ered column repeating until there aren lines. By locating a minimum job to server pairing of matrix elements, we can easily determine the optimal solution.
3.
MACRO-BASED ALGORITHMS
Green Monsteris a framework proposed by Phan et al [4] that uses geographical location to maximize energy savings by emphasizing the maximization of renewable energy. The EMOA, described in Section 2.2, in Green Monster uses three optimization objectives: renewable energy consump-tion (RE), cooling energy consumpconsump-tion (CE), and user-to-service distance (USD). In order to get the best results, Green Monster looks to maximize RE, and minimize both CE and USD. By minimizing the USD, Green Monster at-tempts to minimize the response time to assure a high qual-ity of service. Also, minimizing the CE implies that the energy consumed in the data center will be more heavily used for processing. In 3.1, we will discuss how the EMOA behind Green Monster works, and in 3.2 we will look at simulations of Green Monster with real world data.
3.1
Green Monster EMOA
Green Monster represents individuals as a configuration of all services (Si) in all data centers (Dj). Each data center
has a service capacity, or the maximum workload a data cen-ter can handle. To initialize a population ofN individuals, the EMOA assigns random services to random data centers so that any given data center does not exceed the service capacity. If the service does exceed the service capacity, it will be assigned to the data center with the least workload. Upon completion of initialization, the EMOA uses binary tournament selection to select individuals for alteration. In this instance of binary tournament, the individual is selected byconstrained-dominance. An individual,i, is constrained-dominant to an individual, j, if i has the least amount of service capacity violations. Also, ifi andj do not have any violations, we seti to be constrained-dominant wheni’s ob-jective values are greater or equal toj’s objective values in all objectives and if i’s objective values are superior than j’s in at least one objective. When two parents are selected, crossover is determined by a crossover rate and two offspring are produced. Both of these offspring perform mutation de-termined by a mutation rate that is relatively small for each service. Mutating simply switches the current data center, Dj, for a random new one. The mutation rate is a small
percentage because we want to ensure that the individual retains changes made from crossover and the majority of the individual is not randomized.
After mutation, Phan et al perform an additional opti-mization step not typically part of an EMOA: a local search based on a local search rate for eachSi on the offspring in-dividuals. This local search checks to see if any Dk where
k 6= j, could improve all optimizations without violating the service capacity. If Dk meets the previous criteria, then Dk
replaces Dj in Si.
Selection, crossover, mutation, and local searches are re-peated until the number of individuals in the new offspring generation is the same as in the parent generation. In order for the best individuals to permeate to the next generation, Phan et al combine both the parent and offspring genera-tions and sort them based on constrained-dominance. Phan et al then take only the firstN individuals to be the next
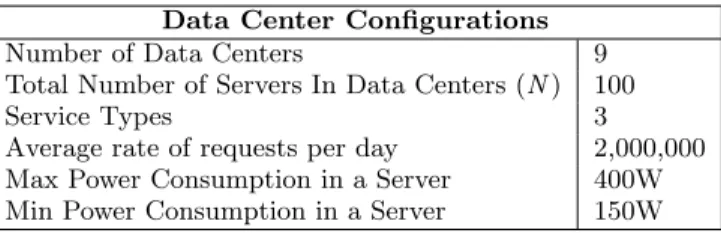
Data Center Configurations
Number of Data Centers 9 Total Number of Servers In Data Centers (N) 100
Service Types 3
Average rate of requests per day 2,000,000 Max Power Consumption in a Server 400W Min Power Consumption in a Server 150W
Table 1: Data center configurations in Green Mon-ster simulation EMOA Configuration Generations 100 Population size (N) 100 Crossover rate 90% Mutation rate 10% Local Search rate 10%
Table 2: EMOA configurations in Green Monster. Configurations were based on optimal experimental results by Phan et al.
parent generation. This whole process repeats until a certain number of generations is reached.
3.2
Green Monster Simulations
Several simulations of Green Monster have been conducted based on statistics of nine data center in nine different Euro-pean countries: Denmark, Germany, Greece, Ireland, Italy, Netherlands, Spain, UK and Portugal. Temperature data was used from European Climate Assessment & Dataset project which records real temperature data in Europe. The countries were chosen based on the wide variety of climates and renewable energy. The average renewable energy pro-duction data was pulled for each country from January 2007 to December 2009. In each data center there are between 8-200 servers and 16-400 services consisting of voice, data, and video based on the countries population. For the simulation, Phan et al decided that every server will have the same spec-ifications and each type of service was evenly distributed to all types of services. Data center configurations are given in Table 1. Green Monster’s EMOA in this simulation runs bi-weekly for twelve simulated months. After running the EMOA with the configurations in Table 2, the individual that is the most optimized overall is selected. Green Mon-ster will migrate service, Si, to data center, Dj, according to
solution presented by the optimized individual. Results of the Green Monster simulations will be presented in Section 5.1.
4.
MICRO-BASED ALGORITHMS
There are many different micro-based algorithms for a green cloud, but we will choose to focus on two algorithms under development: GRMP-Q, a gossip-based allocation al-gorithm by Yanggratoke et al, and the speed-scaling algo-rithm by Han et al.
4.1
Gossip-based Resource Allocation
GRMP-Q is middleware for a data center that utilizes gossip protocol, described in Section 2.3, to minimize the
number of servers running services. Usually, providers rent specific servers by the hour to smaller companies. This, how-ever, is not efficient. A single server working at workload capacity, or the maximum number of services that a single server can handle, will be much more efficient than three servers working at one third of workload capacity. This is due to the minimum power level that a server must consume to be on. GRMP-Q attempts to migrate all services to the least number of servers possible. For simplicity, Yanggratoke et al assume that all servers,N, in a data center have iden-tical specifications (power consumption, CPU, and memory capacities). For any given service, (Si), the demand, ωSi,
can be spread across multiple servers. The equation for de-mand ω(Si,n) on a single server n, is given by (1) where
α(Si,n) is a portion of the demand ofSi running on server
n: ω(Si,n)=α(Si,n)ωSi such that α(Si,n)≥0, N X n=1 α(Si,n)= 1 (1) Yanggratoke et al then placed all of the α(Si,n) for
ev-ery service into a matrix called the configuration matrix. The configuration matrix,A, shows how the data center’s resources are allocated to services. At certain times, load changes, addition of services, or change in the number of servers will cause the configuration matrix to be updated.
The first objective of GRMP-Q is to satisfy user demand by allocating enough resources so that the provider can sat-isfy the SLA. The second objective is to minimize power consumption. GRMP-Q does this by turning a server to stand-by if the total demand on the server is zero. If there is insufficient resources or the ω(Si+1,n) of a new service,
Si+1, is greater than the workload capacity, Ω, the system
will turn a stand-by server on.
In order to transfer one service to another server there are three gossip-based processes that occur. The first process is initialization which initializes the gossip protocol for the current configuration matrix at a random server n. The second process chooses a peer from the configuration matrix by randomly selecting a different server,j, whoseα >0 and is in the setNn where Nn is the set of servers inA with
similar types of services to n. However, in order to avoid selection in disjoint sets of servers, Yanggratoke et al select a server fromNnppercent of the time and a different server
inA withα >0 , 1−ppercent of the time. The equation forpin given in (2).
p= |Nn| 1 +|Nn|
(2)
After a peer is selected, the relative demand, y, on server n is calculated by taking the sum of ωof all services on n divided by the workload capacity ofnshown in (3).
yn= M
X
i=1 ω(Si,n)
Ω where M is the total num of services (3)
Ifyn+yj≥2, the algorithm assumes based on these two
servers that the cloud is in overload and will move services to the server that has a smaller relative demand. However, if
yn+yj<2, then algorithm assumes the cloud is inunderload
(there are unused resources on some active servers). When the cloud is in underload, GRMP-Q then packs services in such a manner that the server with the highest relative
de-Daily Averaged Objective Values for Green Monster
Renewable Cooling User-to-Service Energy Energy Distance Static 324.5 949.58 0 Random rate 327.3 947.34 487378 Green Monster 438.5 919.02 373172
Table 3: Daily averaged objective values for static placement, random placement, and Green Monster. RE and CE are in MWH. USD is presumed to be in meters.
mand ofynandyjmigrates services so that demand is equal
to Ω. This ensures that one server is fully packed and the other is less than Ω. Since this algorithm is gossip-based, comparisons of two servers will occur continuously [6].
4.2
Speed-Scaling
In this version of speed scaling, Han et al use a combina-tion of performance optimizacombina-tion and job placement to make data centers more energy efficient. Han et al assume for this algorithm that there are J jobs andM servers. Han et al define the power consumption with respect to CPU speed,s, given by (4). Letj be a specific job and i the server number.
Pi,j=sγi,j+c, (4)
Wi= J
X
j=1
λj×Pi,j where J is the total number of jobs, (5)
U =
M
X
i=1
Wiwhere M is the total number of servers, (6)
where c accounts for static power loss andγ is a constant that was computed experimentally. Han et al found γ≈3 for the relationship between speed and power. In order to relate jobs and the QoS, jobs have a weighted positive integer
λjthat denotes the level of QoS for jobj. The total weighted
power for a server is shown in (5). The total weighted power, U, is given by (6).
Han et al then adopt an implementation of the Hungarian method of assignment described in Section 2.4, to assign jobs to servers. Han et al then hypothetically migrate the jobs to the appropriate servers, adjusts the speeds of CPUs such that there is no extra processing power utilized, and then recomputes U. If the ∆U ≥0 then the algorithm will migrate the jobs to the appropriate servers [2].
5.
RESULTS
The results of the three different algorithms are discussed in this section.
5.1
Green Monster
Phan et al simulated their algorithm in comparison to two benchmark algorithms: static placement policy and a ran-dom placement policy. Static placement ranran-domly selects two services and places them on each server for the duration of the twelve month simulation. Random placement dynam-ically migrates biweekly by using just the random initial population generation described in Section 3.1. Results are
Figure 3: Power reduction of GRMP-Q with respect to cloud load.
summarized in Table 3, Green Monster consumed a signifi-cantly higher amount of renewable energy than either static or random. The daily average of renewable energy utilized by Green Monster was 111 MWH, or 33.9%, more than ei-ther algorithm. This shows that Green Monster migrates services to more renewable data centers. Table 3 also illus-trated that Green Monster saves more cooling energy than the other algorithms. Green Monster saved 3.2% more cool-ing energy than the random placement algorithm on a daily average basis. However, the main focus was to maximize renewable energy. Green Monster also surpassed random placement yielding a 23.4% shorter user-to-service distance than random. Notice that static placement has a user-to-service distance of zero. This is because the static placement does not migrate any service during the twelve months [4].
5.2
GRMP-Q
GRMP-Q was simulated on a data center with 10,000 servers in order to analyze the reduction of power. Yanggra-toke et al implemented several different loads on the cloud: 10%, 40%, 70%, 100%, 130% of the CPU resources in the cloud shown in Figure 3. When the load on the cloud was small, 10%, the reduction of power increased by 85% from a cloud in which none of the servers switch to stand-by. As expected, power reduction becomes smaller but still saves around 15% of power at a cloud load of 70%. However, this algorithm does not provide any benefit for an overloaded cloud. In order to test if this algorithm was scalable, Yang-gratoke et al ran simulations for a cloud with as little as 2,500 servers to as many as 160,000 servers evaluated at a cloud load of 25% and 50%. In all cases, Yanggratoke et al found that the number of servers does not affect the amount of power reduction. Power reductions were around 25% and 60% for a cloud load of 25% and 50% respectively [6].
5.3
Speed Scaling
Han et al simulated their algorithm in comparison with a non-power-aware (NPA) policy and a dynamic voltage and frequency scaling (DVFS) policy. In a NPA system, there are no optimizations regarding placement of jobs. In a DVFS, all servers are set to proportional speeds by esti-mating the CPU speed required for its current running jobs.
Figure 4: Number of servers with respect to power in kilowatt hours. Non-power aware (NPA). Dy-namic Voltage and Frequency Scaling (DVFS). Han et al’s algorithm (SS).
DVFS will also adjust the voltage which means that cir-cuits in the processor will switch more slowly with a lower voltage. In Figure 4, we can clearly see results indicating that the proposed algorithm uses significantly less energy per hour than either NPA or DVFS policies [2].
6.
CONCLUSIONS
The growth of cloud computing has created significant in-creases of power consumption by data centers. Implement-ing energy optimization techniques in data centers are an im-portant part of creating a greener cloud. From the simulated results, we can tell that both micro-based and macro-based algorithms produce a greener data center even though they use completely distinct methods to do so. Green Monster fo-cuses on migrating services to different data centers so that more renewable energy is conserved. GRMP-Q targets the packing of services into in minimum number of servers possi-ble. Han et al centers around adjusting CPU frequency and voltage while optimizing the placement of jobs on servers. Since cloud computing is still relatively new and growing, there is considerable potential to reduce power even further. Combinations of both micro and macro will undoubtedly be used together to reduce power consumption of data centers.
Acknowledgements
Many thanks to my advisor, Elena Machkasova, and second reader, Alex Jarvis, for their time and many helpful com-ments and criticisms.
7.
REFERENCES
[1] Armbrust, M., Fox, A., Griffith, R., Joseph,
A. D., Katz, R., Konwinski, A., Lee, G., Patterson, D., Rabkin, A., Stoica, I., and Zaharia, M.A view of cloud computing.Commun.
ACM 53, 4 (Apr. 2010), 50–58.
[2] Han, K., and Cai, X.Speed-scaling-based job/tasks deployment for energy-efficient datacenters in cloud computing. InProceedings of the Second International Conference on Innovative Computing and Cloud Computing(New York, NY, USA, 2013), ICCC ’13, ACM, pp. 154:154–154:157.
[3] Hassan, M. I., and Bahsoon, R.Green-as-a-service (gaas) for cloud service provision operation. In
Proceedings of the 29th Annual ACM Symposium on Applied Computing (New York, NY, USA, 2014), SAC ’14, ACM, pp. 1219–1220.
[4] Phan, D. H., Suzuki, J., Carroll, R., Balasubramaniam, S., Donnelly, W., and
Botvich, D.Evolutionary multiobjective optimization
for green clouds. InProceedings of the 14th Annual Conference Companion on Genetic and Evolutionary Computation (New York, NY, USA, 2012), GECCO ’12, ACM, pp. 19–26.
[5] Poli, R., Langdon, W. B., and McPhee, N. F.A Field Guide to Genetic Programming. Published via
http://lulu.comand freely available at
http://www.gp-field-guide.org.uk, 2008. (With contributions by J. R. Koza).
[6] Yanggratoke, R., Wuhib, F., and Stadler, R. Gossip-based resource allocation for green computing in large clouds. InProceedings of the 7th International Conference on Network and Services Management (Laxenburg, Austria, Austria, 2011), CNSM ’11, International Federation for Information Processing, pp. 171–179.