Supporting Information
Iodine-catalyzed Selective Functionalization of Ethane in Oleum:
Towards a Direct Process for the Production of Ethylene Glycol from
Shale Gas
Marius Bilke, Tobias Zimmermann† and Ferdi Schüth*
Max-Planck-Institut für Kohlenforschung, Kaiser-Wilhelm-Platz 1, Mülheim/Ruhr, Germany
*E-mail for F.S.: [email protected]
Content
1. Reactor Material and Equipment ...3
2. Catalytic Experiment...3
3. Calculations...5
3.1. Gas Phase Composition...5
3.2. Kinetic Values...6
4. Chemicals ...7
5. Analytical Methods ...8
6. Hydrolysis...11
1.
Reactor Material and Equipment
Catalytic tests were carried out in pressure- and temperature-resistant autoclaves, which were designed and manufactured in house. Hastelloy G-35 (Ni, 33% Cr, 8% Mo, ≤ 2% Fe, ≤ 0.6% Si, ≤ 0.5% Mn, ≤ 0.4% Al, ≤ 0.05% C) or 1.4571 stainless steel was used as construction material. To further avoid extensive corrosion, glass or Teflon inlets, minimizing the contact of the reaction mixture with the reactor walls, were applied. Whenever necessary, reactors were remachined. Sealing materials consisted of either teflon or gold. All reactors were equipped with pressure meters (JUMO dTRANS p30) and a thermocouple (type K), which was additionally covered by a teflon jacket. Valves and connections made from stainless steel were replaced if necessary.
2.
Catalytic Experiment
Caution! Sulfuric acid, oleum, and SO3 are strongly oxidizing agents and pose potential hazards. Reaction products or intermediates might potentially be alkylating and carcinogenic.
Catalytic ethane oxidation was carried out in a two-autoclave setup which had been described previously.[1-3] Both autoclaves were connected via two valves and a short capillary. One autoclave served as a heated C2H6 reservoir. The other autoclave, denoted the “reactor”, was used for the actual reaction. The C2H6 reservoir was filled with ethane to a pressure of 30 bar at room temperature. The reactor was filled with sulfuric acid or oleum and catalyst and purged with argon before closure. Both autoclaves were heated to the desired reaction temperature,
and the reaction was started by pressurizing the reactor with preheated ethane. The reaction was run until a certain pressure drop - a consequence of the formation of reaction products, which are liquid under the given conditions - was reached or, in the case of slow rates, for a certain time, typically for 2 h. The conversion of ethane was thus limited to approximately 30%, which ensures comparison of the results of different runs under fairly similar conditions and maintains the SO3 concentration at a sufficiently high level. The reaction was stopped by quenching the autoclave in a water bath with stirring. The relative composition of the gas phase was analyzed by IR spectroscopy. Liquid-phase analysis was done by means of 1H NMR spectroscopy of a reaction solution aliquot. TOFs were calculated by dividing the molar amount of products formed by the molar amount of catalyst present in the reactor and by the reaction time. TOFs should ideally be determined from the initial slope of product formation, but due to associated experimental difficulties, determination of an average TOF was chosen instead. This does not necessarily reflect intrinsic activity, and values are apparent, especially for high catalyst loadings, if solubility is low.
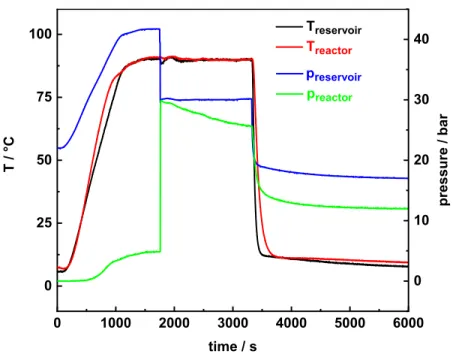
0 1000 2000 3000 4000 5000 6000 0 25 50 75 100 Treservoir Treactor T / °C time / s 0 10 20 30 40 preservoir preactor p re ss u re / b ar
Figure S1: p-T profile for a typical experiment for TOF determination.
3.
Calculations
3.1. Gas Phase Composition
The amount of alkane used resulted from the previously determined volume of the preheating autoclave and the recorded p-T data before heating and after completion of the reaction. For numerical solution of the Benedict-Webb-Rubin equation of state the Excel tool "what-if-analysis" is used.[4] Applied substance parameters are given in Table 1.[5] For calculation of the molar proportions of the corresponding alkane or CO2 in the gas phase after the reaction has ended, an ideal mixing of the two components as well as the validity of Dalton's law, i.e. the sum of the respective partial pressures is equal to the total pressure within the reactor, is assumed. Quantitative IR spectroscopic analysis of a 2 mL aliquot of the gas phase allows a
statement about the relative composition of the gas mixture, taking into account different extinction coefficients of the individual components. Substituting the obtained partial pressures into the BWR equation provides the corresponding absolute amounts of substances:
P = RTd +
(
B0RT - A0 - C0T2
)
d2+ (BRT - A)d3 + Aαd6 + Cd
3
(
1 + γd2)
exp( - γd2)T2
Other constituents, such as, for example, sulfur dioxide or sulfur trioxide, have a significantly higher solubility in the reaction medium and are therefore only present in very low concentrations in the gas phase at room temperature. Their shares are therefore neglected for all further considerations. Accordingly no explicit mass balance, but only a carbon balance can be established. At this point it is worth noting that for the described experimental procedure carbon dioxide may not be completely desorbed from the reaction mixture and the indicated selectivities are thus slightly overestimated.
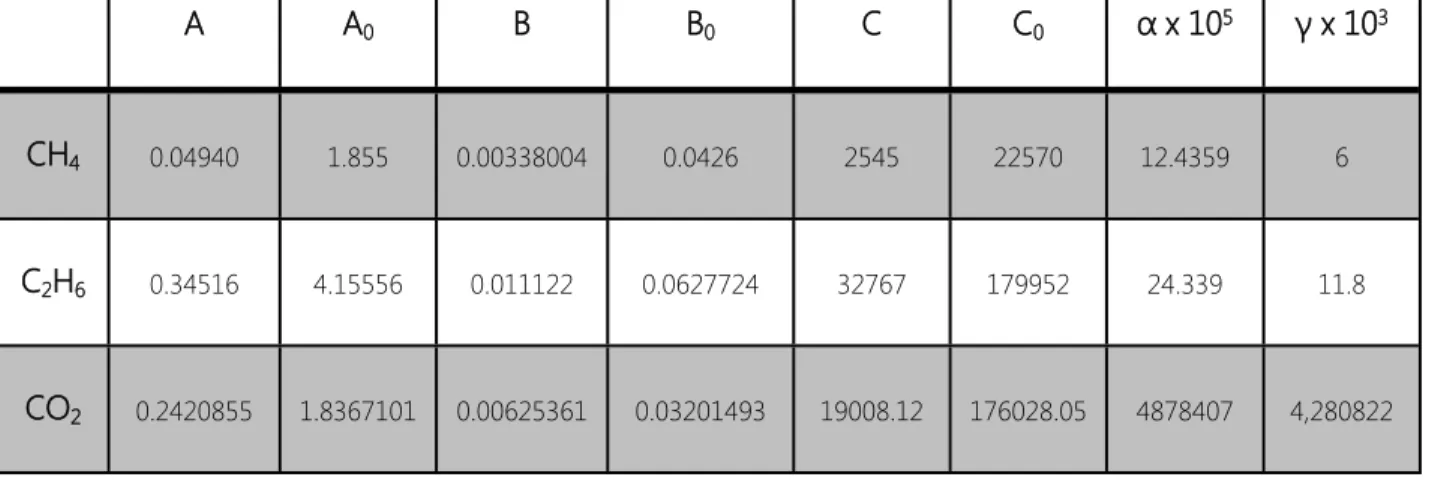
Table S1: Used substance parameters for BWR equation of state (units: atm, L, mol, R = 0.08207 atm L mol-1 K-1).[5]
A A0 B B0 C C0 α x 105 γ x 103
CH4 0.04940 1.855 0.00338004 0.0426 2545 22570 12.4359 6
C2H6 0.34516 4.15556 0.011122 0.0627724 32767 179952 24.339 11.8
3.2. Kinetic Values
Calculations of conversion, yield and selectivity and parameters which serve as a measure of stability of the catalyst or catalytic activity were carried out according to the following equations which are not biased by an incomplete carbon balance that was observed in some cases:
X =
∑nfunctionalized ethane +1
2 nCO2
nethane, initial ∙ 100%
Sfunctionalized ethane = nfunctionalized ethane
∑nfunctionalized ethane + 1
2 nCO2
∙ 100%
Yfunctionalized ethane = X ∙ Sfunctionalized ethane
TON = nfunctionalized ethane ncatalyst
TOF =TON tr
4.
Chemicals
All chemicals and gases used herein were purchased from commercial suppliers and used as received, unless stated differently. Purities are given in brackets: 1,2-diiodoethane (99%), 2-iodoethanol (99%), 2,2’- bipyrimidine (95%, purified by vacuum sublimation), carbon dioxide (99.5%), dimethylsulfoxide-d6 (99.96%), ethane (99.5%), ethanesulfonic acid (95%), ethylene (99.5%), ethylene glycol (>99.5%), iodine (99.5%), iodine pentoxide (≥98%), iodoethane (98%),
methane (99.5%), methanesulfonic acid (99.5%), oleum (p.A.), potassium periodate (99.8%) , potassium tetrachloroplatinate(II) (98%), sodium ethyl sulfate (98%), sulfuric acid (ACS reagent). Synthesis of ŋ2-(2,2‘-bipyrimidyl)-dichloridoplatinate(II) [(bpym)PtCl
2][6]
0.085 g of 2,2'-bipyrimidine, which has previously been purified by vacuum sublimation, is dissolved in a little water and slowly added to an aqueous solution of 0.222 g of potassium tetrachloroplatinate (II) (total volume about 15 mL). With stirring at room temperature, an orange precipitate forms after only a few minutes, which is filtered off after a reaction time of 30 minutes. To complete the reaction, the mother liquor is collected, further stirred overnight; the precipitate formed is also filtered off. Washing with water and acetone followed by drying at 90 ° C overnight yielded a total of 203 mg (89%) of an orange solid.
1H-NMR (300 MHz, DMSO-d 6) δ (ppm): 8.0 (dd, 2 H, bpym H5/5‘), 9.4 (dd, 2 H, bpym H4/4‘), 9.7 (dd, 2 H, bpym H6/6‘). Elemental Analysis calculated C 22.65% H 1.43% N 13.21% Cl 16.72% Pt 45.99%. found C 23.05% H 1.69% N 12.87% Cl 15.51% Pt 45.70%.
5.
Analytical Methods
1H-NMR spectra of reaction solutions were measured at room temperature on an AV-300 spectrometer from Bruker. Chemical shifts are reported in parts per million (ppm) and can vary widely depending on the acidity of the medium. The residual proton signal of DMSO-d6 that was added to the sample in a coaxial capillary was taken as a reference. For quantitative evaluation of the catalytic experiments, a pre-weighed amount of methanesulfonic acid (MSA) was added as standard to a defined volume of the reaction solution.
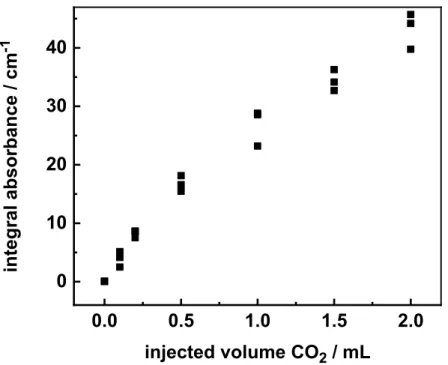
Gas-phase infrared spectra (see Figure S2) were recorded on a Nicolet Avatar 370 FT-IR spectrometer from Thermo Scientific. For each analysis, 32 scans were measured at a resolution of 2 cm-1. Before quantification of the spectra by integration, the background spectrum was subtracted and an automatic baseline correction was applied. Differences in the extinction of the individual components in the gas phase were accounted for by corresponding correction factors obtained by previous calibration with pure gases (CO2 1, C2H6 3.72, CH4 11.38). Figures S3 and S4 show the integral absorbance as a function of the injected gas volume for ethane and carbon dioxide, respectively.
1000 2000 3000 4000 ab so rb an ce ( a. u .) wavenumber (cm-1) C2H6 C2H6 CO2 SO2 SO2 SO2
Figure S2: Representative FTIR spectrum of the post-reaction gas phase showing signals for C2H6, CO2 and SO2. 0 1 2 3 4 0 10 20 30 40 50 in te g ra l a b so rb an ce / cm -1 injected volume C2H6 / mL
0.0 0.5 1.0 1.5 2.0 0 10 20 30 40 in te g ra l a b so rb an ce / cm -1 injected volume CO2 / mL
Figure S4: Integral absorbance (2150-2550 cm-1) as a function of the injected carbon dioxide volume.
6.
Hydrolysis
5 mL of the post- reaction solution were slowly dripped to 20 mL water under ice cooling. The resulting solution was heated to 90 °C for a period of 3 h to hydrolyse the reaction products, and then examined by 1H NMR spectroscopy (see Figure S5). Further optimization of the amount of added water and reaction temperature is expected to lead to increased yields of ethylene glycol. 0 1 2 3 4 5 6 7 in te n si ty ( a. u .) 1H / ppm EG H2SO4 DMSO EBS HO-(CH2)2-OSO3H
Figure S5: Representative 1H NMR spectrum of a post-reaction mixture after hydrolysis showing signals for sulfuric acid, DMSO as well as ethylene glycol (EG) and the respective mono- and bis-bisulfate esters.[7]
7.
References
(1) Soorholtz, M.; White, R. J.; Zimmermann, T.; Titirici, M. M.; Antonietti, M.; Palkovits, R.; Schüth, F., Direct methane oxidation over Pt-modified nitrogen-doped carbons. Chemical Communications 2013,49, 240-2.
(2) Zimmermann, T.; Soorholtz, M.; Bilke, M.; Schüth, F., Selective Methane Oxidation Catalyzed by Platinum Salts in Oleum at Turnover Frequencies of Large-Scale Industrial Processes. Journal of the American Chemical Society 2016,138, 12395-400.
(3) Gang, X.; Birch, H.; Zhu, Y. M.; Hjuler, H. A.; Bjerrum, N. J., Direct oxidation of methane to methanol by mercuric sulfate catalyst. Journal of Catalysis 2000,196, 287-292.
(4) Benedict, M.; Webb, G. B.; Rubin, L. C., An Empirical Equation for Thermodynamic Properties of Light Hydrocarbons and Their Mixtures I. Methane, Ethane, Propane and n‐Butane. Journal of Chemical Physics 1940,8, 334-345.
(5) Mcfee, D. G.; Mueller, K. H.; Lielmezs, J., Comparison of Benedict-Webb-Rubin, Starling and Lee-Kesler Equations of State for Use in P-V-T Calculations. Thermochimica Acta 1982,
54, 9-25.
(6) Mironov, O. A.; Bischof, S. M.; Konnick, M. M.; Hashiguchi, B. G.; Ziatdinov, V. R.; Goddard, W. A., 3rd; Ahlquist, M.; Periana, R. A., Using reduced catalysts for oxidation reactions:
mechanistic studies of the "Periana-Catalytica" system for CH4 oxidation. Journal of the
American Chemical Society 2013,135, 14644-58.
(7) Zhu, H. J.; Ziegler, T., A theoretical study of the original Shilov reaction involving methane activation by platinum tetrachloride (PtCl42-) in an acidic aqueous solution. Journal of