Building reports with the SAP
BusinessObjects Web Intelligence
HTML Report Panel
© 2010 SAP AG. All rights reserved.SAP, R/3, SAP NetWeaver, Duet, PartnerEdge, ByDesign, SAP Business ByDesign, and other SAP products and services Copyright
mentioned herein as well as their respective logos are trademarks or registered trademarks of SAP AG in Germany and other countries. Business Objects and the Business Objects logo, BusinessObjects, Crystal Reports, Crystal Decisions, Web Intelligence, Xcelsius, and other Business Objects products and services mentioned herein as well as their respective logos are trademarks or registered trademarks of Business Objects S.A. in the United States and in other countries. Business Objects is an SAP company.All other product and service names mentioned are the trademarks of their respective companies. Data contained in this document serves informational purposes only. National product specifications may vary.These materials are subject to change without notice. These materials are provided by SAP AG and its affiliated companies ("SAP Group") for informational purposes only, without representation or warranty of any kind, and SAP Group shall not be liable for errors or omissions with respect to the materials. The only warranties for SAP Group products and services are those that are set forth in the express warranty statements accompanying such products and services, if any. Nothing herein should be construed as constituting an additional warranty.
Contents
About Web Intelligence 11
Chapter 1
How Web Intelligence performs business intelligence over the web...12
How Web Intelligence performs business intelligence offline...12
Interacting with Web Intelligence reports...12
Viewing and printing Web Intelligence reports...13
Drilling on Web Intelligence reports...13
Performing on-report analysis...13
Creating and editing Web Intelligence documents...14
Web Intelligence Query - HTML...14
Web Intelligence Java Report Panel...15
Web Intelligence Rich Client...15
Web Intelligence HTML Report Panel...16
Accessing Web Intelligence from InfoView 17 Chapter 2 To log in to InfoView...18
To log out of InfoView...19
Web Intelligence InfoView options...19
Web Intelligence document creation and viewing options...19
To set Web Intelligence drill options...24
Web Intelligence locale options...26
Returning data using queries 31 Chapter 3 Creating, editing and saving documents...32
Building queries...32
To build and run a query...32
To add objects to a query...34
To remove objects from a query...34
To remove a query...35
To interrupt a query...35
Setting the scope of analysis...35
Scope of analysis...35
Levels of scope of analysis...36
To set the scope of analysis...37
Query contexts...37
What is an ambiguous query?...37
What is a context?...38
Choosing a context when you run a query...38
Web Intelligence query properties...38
Allow other users to edit all queries property...38
Max retrieval time query property...39
Max rows retrieved query property...39
Query prompt order...39
Retrieve duplicate rows query property...40
Query Stripping...40
Reset contexts on refresh query property...41
Clear contexts query property...42
Sample result set query property...42
Filtering data using query filters 43 Chapter 4 Filtering the data selection in the query...44
To select a predefined query filter...44
To combine query filters...44
To create a custom query filter...44
Nesting query filters...45
To nest query filters...45
To create a prompt...46
Query filter and prompt operators...47
Equal To operator...47
Not Equal To operator...47
Different From operator...47
Greater Than operator...47
Greater Than Or Equal To operator...47
Less Than operator...48
Less Than Or Equal To operator...48
Between operator...48
Not Between operator...48
In List operator...49
Not In List operator...49
Matches Pattern operator...49
Different From Pattern operator...49
Both operator...49
Except operator...50
Displaying data in tables 51 Chapter 5 Table types in Web Intelligence...52
Vertical table...52
Horizontal table...52
Crosstab...53
Forms...54
To select a table or chart template...55
Allocating data to tables...56
To select a table or chart template...56
To add an object to a table...57
To remove an object from a table...58
To reposition an object on a table...58
To reorder the columns or rows on a table...59
To position a block on a report...60
Formatting options for vertical and horizontal tables...61
Building reports with the SAP BusinessObjects Web Intelligence HTML Report Panel 5
To format a table...62
Formatting options for crosstabs...62
To format a crosstab...63
To display headers in a crosstab...63
To center column values on a crosstab header...64
Formatting options for forms...65
To format a form...65
Organizing data with sections, breaks and sorts 67 Chapter 6 Organizing the data in reports...68
Grouping information with sections...68
To create a section on a report...70
To create a subsection on a report...71
To change the order of sections on a report...72
To remove a section from a report...72
To format a section...73
To format a section cell...74
To set the page layout for a section...74
Sorting the results displayed on reports...75
Sorting data in tables...76
To sort values on a table...78
To prioritize multiple sorts on a table...79
Applying sorts to sections...80
Using breaks...81
Displaying data in charts 85 Chapter 7 Chart types in Web Intelligence...86
Bar charts...86
Line charts...86
Area charts...87
Pie charts...87
Radar, polar and scatter charts...88
3D charts...88
2D charts...89
To select a table or chart template...90
Allocating data to charts...91
To add objects to chart axes...91
To reposition objects on a chart axis...92
To remove an object from a chart axis...92
Chart formatting options...93
Formatting options for 2D bar charts...93
Formatting options for 3D charts...94
Formatting options for pie charts...95
To change the chart size...96
To format the chart background and border...97
Displaying data values...97
To format the chart legend...100
Formatting chart axes...101
Filtering the values displayed in reports 105 Chapter 8 To create a report filter...106
Report filter operators 107 Chapter 9 Equal To operator...108
Not Equal To operator...108
Different From operator...108
Greater Than operator...108
Greater Than Or Equal To operator...108
Less Than operator...109
Less Than Or Equal To operator...109
Building reports with the SAP BusinessObjects Web Intelligence HTML Report Panel 7
Between operator...109
Not Between operator...109
In List operator...109
Not In List operator...110
Is Null operator...110
Is Not Null operator...110
Formatting reports and report page layout 111 Chapter 10 The Result Preview pane...112
Defining page size, orientation and margins...115
To select the paper size...115
To select the page orientation...115
To set margins...116
Displaying report titles...117
To display the report title...117
Formatting page headers and footers...118
To display or hide a header or footer...118
To specify cell contents for headers and footers...118
To set the height and background color of headers and footers...119
To format a page header or footer cell...120
Managing reports...120
To insert a report...120
To move a report...121
To rename a report...121
To delete a report...122
Formatting hyperlinks...123
To format hyperlinks...123
Using standard calculations in reports 125 Chapter 11 Standard calculations...126
To insert or remove a calculation...127
Working with documents 129 Chapter 12 To create a Web Intelligence document from InfoView...130
To open a Web Intelligence document from InfoView...130
To delete a Web Intelligence document from InfoView...130
Saving documents...131
To save a new Web Intelligence document in InfoView...131
To save a Web Intelligence document as a PDF file...131
To save a Web Intelligence document as an Excel spreadsheet...132
To save a Web Intelligence document as a CSV file...132
Automatic saving and recovery...133
Printing Web Intelligence documents...135
To print a Web Intelligence report...136
Web Intelligence document properties...136
To view and set Web Intelligence document properties...139
More Information 141
Appendix A
Index 145
Building reports with the SAP BusinessObjects Web Intelligence HTML Report Panel 9
About Web Intelligence
How Web Intelligence performs business
intelligence over the web
Web Intelligence provides business users with an easy to use interactive and flexible user interface for building and analyzing reports on corporate data over the web, on secured intranets and extranets. The Web Intelligence software is installed by your administrator on a web server on your corporate network.
To use Web Intelligence from your local computer, you log into the business intelligence portal InfoView via your Internet browser. Then, depending on your security profile, you can interact with the reports in corporate documents or edit or build your own documents using a Web Intelligence report panel or query panel.
How Web Intelligence performs business
intelligence offline
Web Intelligence can be used offline as Web Intelligence Rich Client, a standalone Microsoft Windows application, equivalent to the Java Report Panel, that you can install on your computer. Web Intelligence Rich Client lets you continue to work with Web Intelligence (WID) documents when you are unable to connect to a CMS, when you want to perform calculations locally rather than on the server, and when you want to work with Web Intelligence documents without installing a CMS or application server. Web Intelligence Rich Client can also be used when connected to a CMS.
Interacting with Web Intelligence reports
Depending on your security profile and on how Web Intelligence is deployed across your organization, you can view, analyze, or enhance and modify the data displayed on reports.
About Web Intelligence
Viewing and printing Web Intelligence reports
Once logged into the business intelligence portal InfoView, you can access Web Intelligence documents and view reports. Onscreen navigation is made easy with page-to-page navigation buttons and a document map that allows you to jump from section to section or report to report.
The same document can provide the information adapted to each user due to prompts that request each user, who opens the document, to specify the data they want to return to the reports.
When you print, Web Intelligence automatically generates a copy of reports in Portable Document Format (PDF) format for optimum print quality. You can print reports directly from the Web Intelligence Java Report Panel or Web Intelligence Rich Client without exporting to PDF.
Drilling on Web Intelligence reports
Drilling on Web Intelligence reports enables you to analyze the detailed data behind the displayed results. You can turn the report you are viewing into a drillable report or drill on a duplicate of the original report to retain a version of the results before your drill analysis.
Once you have found the information you need, you can save a snapshot of the drilled report to share the results of your analysis with other Web Intelligence users, or save the document in Excel or Portable Document (PDF) format to print or email to other business contacts.
Performing on-report analysis
Viewing Web Intelligence reports in Interactive view format enables you to enhance reports and fine-tune the data reports contain, to highlight the information that most interests you on demand.
On-Report Analysis is designed for:
• users who need to build queries and then want to build reports
• report consumers who need to manipulate the reports created by others
Building reports with the SAP BusinessObjects Web Intelligence HTML Report Panel 13
1
About Web Intelligence Interacting with Web Intelligence reportsWith On-Report Analysis you can:
• view document metadata to understand the data behind reports and see how reports are structured and filtered
• filter and sort results • add new tables and charts
• add formulas and create variables
• format and change the layout of charts and tables
• slice and dice results by adding other data to charts and tables
Note:
On-report analysis of Web Intelligence reports in Interactive view format is only available if your administrator has deployed Web Intelligence in JSP mode.
Creating and editing Web Intelligence
documents
You can create or edit Web Intelligence documents using the Web Intelligence HTML Report Panel, Web Intelligence Query - HTML, Web Intelligence in Interactive mode, the Web Intelligence Java Report Panel and Web Intelligence Rich Client.
Web Intelligence Query - HTML
Designed for users requiring a pure HTML environment to build queries, Web Intelligence Query – HTML offers the ability to define the data content of documents on multiple data sources. You can use Query – HTML to create new documents from scratch or edit the queries in documents created using any of the other Web Intelligence tools.
Used together with On-Report Analysis, Query – HTML provides a complete solution for building queries and designing powerful reports in a pure HTML environment. Once you have run the queries to generate a standard report, you can leverage Web Intelligence On-Report Analysis features to format multiple reports, add formulas, and create variables.
About Web Intelligence
Note:
Web Intelligence Query – HTML and On-Report Analysis in Interactive view format are only available, if your administrator has deployed Web Intelligence in JSP mode.
Web Intelligence Java Report Panel
The Java Report Panel is designed for users who need more flexibility with designing report layout and defining formulas and variables. A graphical Formula Editor enables you to build formulas rapidly using drag-and-drop.
Note:
The Web Intelligence Java Report Panel is available if your administrator has deployed Web Intelligence in ASP mode and if your administrator has deployed Web Intelligence in JSP mode.
Web Intelligence Rich Client
Web Intelligence Rich Client is a locally installed Microsoft Windows application that lets you work with Web Intelligence (WID) documents that are stored locally or in a CMS.
When working without a CMS connection you can work on your local machine with either CMS-secured or unsecured documents.
Web Intelligence Rich Client is based on the Web Intelligence Java Report Panel and provides equivalent document creation, editing, formatting, printing and saving capabilities.
There are a number of reasons for using Web Intelligence Rich Client to work with WID documents:
• You want to work with Web Intelligence documents but you are unable to connect to a CMS (while traveling, for example).
• You want to improve calculation performance: Web Intelligence Rich Client performs calculations locally, rather than on the server, and local calculations can perform better than server calculations.
• You want to work with Web Intelligence documents without installing a CMS or application server.
Building reports with the SAP BusinessObjects Web Intelligence HTML Report Panel 15
1
About Web Intelligence Creating and editing Web Intelligence documentsWeb Intelligence HTML Report Panel
Designed for users who need to build basic reports, the HTML Report Panel provides query and report features in a simple wizard-like interface. Each document is based on a single data source and can contain multiple reports, displaying different subsets of information.
In addition, the HTML Report Panel is 508 compliant and can be customized for specialized deployments.
Note:
The Web Intelligence HTML Report Panel is only available if your administrator has deployed Web Intelligence in JSP mode. About Web Intelligence
Accessing Web Intelligence
from InfoView
You access Web Intelligence reports and set global Web Intelligence options from InfoView, the corporate business intelligence portal.
To log in to InfoView
Before you can use InfoView and Web Intelligence you need the following information:
• a URL to the InfoView server
• the InfoView server name and port number • your login and password
• your authentication, which controls the InfoView resources available to you
Contact your adminstrator for these details if you do not already know them.
Note:
By default the InfoView server name and authentification method are not displayed on the InfoView logon page. You need to supply this information only if your administrator has made these options visible.
You access Web Intelligence by using your web browser to log into InfoView, the corporate business intelligence portal. Once you are in InfoView, you can analyze and enhance Web Intelligence reports.
1. Launch your web browser.
2. Point your browser to the InfoView bookmark or URL. The InfoView login page appears.
3. If theSystembox is blank, type the name of the InfoView server followed by a colon (:), and then type the port number.
4. In theUsernamebox, type your user name. 5. In thePasswordbox, type your password.
6. In theAuthenticationbox, select the authentication provided to you by your administrator.
7. ClickLog On.
The InfoView home page appears. Accessing Web Intelligence from InfoView
To log out of InfoView
When you finish using InfoView or Web Intelligence you need to log out, instead of simply closing your web browser.
Logging out of InfoView ensures that any preferences you modified during your InfoView session are saved. It also lets your administrator track how many users are logged into the system at any given time and thus optimize InfoView and Web Intelligence performance.
• ClickLog Out.
The login page appears. You are logged out of InfoView
Web Intelligence InfoView options
Web Intelligence document creation and viewing
options
You can set your Web Intelligence options to determine how you create, view and interact with documents using Web Intelligence.
You create documents using a query editor to build the query to retrieve the document data. After the query returns the data to the document, you can view and interact with the data.
Building reports with the SAP BusinessObjects Web Intelligence HTML Report Panel 19
2
Accessing Web Intelligence from InfoViewDescription Document creation option
You create documents using the Java Report Panel, a Java applet than launches in your Web brows-er.
The Java Report Panel is a com-bined query building, report editing and data analysis environment. If you chooseAdvanced as your document creation option, you also use the Java Report Panel for working with the data returned by the query. TheSelect a default view formatoption is not taken into account.
The Java Report Panel provides the richest feature set of all Web Intelligence query building, report editing and data analysis environ-ments.
Advanced
You build queries using Query -HTML, an HTML-based query editor.
Interactive
You build queries, edit reports and analyze data using Web Intelli-gence Rich Client, a standalone version of the Java Report Panel that runs outside your web browser. Desktop
You create reports using the HTML Report Panel, a 508-compliant query and report building environment.
Web Accessibility
You can use the following view formats to view and interact with existing Web Intelligence documents, or documents that you have just created using a query editor:
Accessing Web Intelligence from InfoView
2
Web Intelligence InfoView optionsDescription View format
Use Web (HTML) format when you want to open reports, answer prompts, navigate reports, and/or perform drill analysis.
Web
Use Interactive format when you want to apply filters, sorts, calcula-tions, modify formatting and data displayed on tables and charts, and/or perform drill analysis. Use Interactive format if you are us-ing Query – HTML to define queries, and you want to format reports based on those queries and add formulas and variables.
Interactive format + Query HTML provides an approximate equivalent to the Java Report Panel or Web In-telligence Rich Client, in a pure HTML environment.
You can also use Interactive format to view and work with reports gener-ated from the HTML Report Panel. Unline Query - HTML, which is a pure query-building environment, the HTML Report Panel also allows you to define reports. After running your query, you can continue to work with the report either by using Interactive format, or by returning to the HTML Report Panel.
Interactive view format is only avail-able if your administrator has de-ployed Web Intelligence in JSP mode.
Interactive
Building reports with the SAP BusinessObjects Web Intelligence HTML Report Panel 21
2
Accessing Web Intelligence from InfoViewDescription View format
Use PDF mode when you want to view static reports.
To select the Web Intelligence query editor
1. Click thePreferencesbutton on the InfoView toolbar.
2. ClickWeb Intelligence Preferencesto display the Web Intelligence options.
3. Select the query editor beneathSelect a default creation/editing tool. 4. ClickOK.
To select the Web Intelligence view format
You can select different view formats for Web Intelligence documents depending on how you want to interact with the information displayed on the reports. You select your Web Intelligence view options in InfoView. When you modify your view options, the new settings are implemented the next time you open a Web Intelligence document.
1. Click thePreferencesbutton on the InfoView toolbar.
2. ClickWeb Intelligence Preferencesto display the Web Intelligence options.
3. In theSelect a view formatsection, select the view format.
To select a default universe for new documents
1. ClickPreferenceson the Infoview toolbar.
2. ClickWeb Intelligence Preferencesto display the Web Intelligence options.
3. ClickBrowsebeneathSelect a default universeand browse to the universe you want to select as the default.
Accessing Web Intelligence from InfoView
2
Web Intelligence InfoView optionsRefresh option in Infoview
With SAP BusinessObjects XI 3.1 SP3 refresh of Web Intelligence documents created from custom data sources like text, excel files and Custom Data Provider plug-in are supported in Infoview.
Note:
The refresh option is available for Windows operating system only. To refresh a text or excel file, set theRefreshOnServerregistry to the following values:
RefreshOnServer = NO or Disable to disable refresh on Server. RefreshOnServer = YES or ENABLE to enable refresh on Server, by default it is set toYESorEnable.
RefreshOnServer = ALLOW_USE_WINDOWS_SHARE to enable refresh on Windows server only.
The registry path is:HKEY_LOCAL_MACHINE>SOFTWARE>Business Objects>Suite 12.0>Default>Web Intelligence> Calculator>PDP. Before refreshing a document from Infoview make sure that the following points are taken care:
1. The Custom Data Provider has to be on the BOE server, if it is clustered then each and every cluster needs to be updated with the same copy of Custom Data Provider.
2. Incase of a blocker issue and the file cannot be accessed from its original source location then the file should be placed in the default location for each server.
The default server path is<Installdir>Business
Objects\PersonalDPFilessymantec, you can change this path by changing the value ofServer_Pathin the registry.
3. The Server Intelligence Agent (SIA) should be managed by a user authentication valid in the network domain. Normally SIA is managed using local system account; this practice is not recommended when deploying Custom Data Provider in server.
Building reports with the SAP BusinessObjects Web Intelligence HTML Report Panel 23
2
Accessing Web Intelligence from InfoView4. For refreshing a document based on Generic WS, update the
net.propertiesfile present at:<Installdir>\javasdk\jre\libwith the following lines:
http.proxyHost=bluecoat-proxy http.proxyPort=8080
http.nonProxyHosts=localhost|127.0.0.1|10.
Where,proxyHostis the name of the proxy server (e.g. proxy.mydomain.com),
proxyPortis the port number to use (default value is 80),
nonProxyHostsis a '|' separated list of hostnames which should be accessed directly, ignoring the proxy server (default value is localhost & 127.0.0.1)
Note:
The.pacfiles are not supported, you have to explicitly configure the proxy server in the proxy settings for the URL.
To set Web Intelligence drill options
Drilling on reports lets you look deeper into data to discover the details behind a good or bad summary result displayed on a table, chart, or section. Before you begin a drill session, you can set your drill options in InfoView to specify how reports will change each time you drill.
1. ClickPreferenceson the Infoview toolbar.
2. ClickWeb Intelligence Preferencesto display the Web Intelligence options.
3. Select the drill options underDrill optionsandStart drill session.
Hide drill toolbar option
When you drill on a value displayed on a report, the Drill toolbar appears and displays the value on which you drilled. The value displayed on the toolbar filters the results displayed on the drilled report.
Accessing Web Intelligence from InfoView
2
Web Intelligence InfoView optionsFor example, if you drill on year 2001, the results displayed on the drilled table are Q1, Q2, Q3, and Q4 for year 2001. This means that the quarterly values you drilled to are filtered by 2001.
Note:
If the drilled report includes dimensions from multiple queries, a ToolTip appears when you rest your cursor on the value displayed on the filter. The ToolTip displays the name of the query and the dimension for the value. The Drill toolbar allows you to select alternative values on the same level, in order to filter the results differently. For example, if you use the Drill toolbar illustrated above to select “2002, ? the results displayed on the drilled table would be Q1, Q2, Q3, and Q4 for year 2002.
You can opt to hide the Drill toolbar when you start drill mode. The Drill toolbar is only useful if you want to select filters during your drill session.
Prompt when drill requires additional data option
When you drill the results displayed on a Web Intelligence report, you may want to drill to higher- or lower-level information that isn’t included in the scope of analysis for the document. When this is the case, Web Intelligence needs to run a new query to retrieve the additional data from the data source. Since queries on large selections of data may take a long time to be completed, you can choose to be prompted with a message every time a new query is necessary. The prompt message asks you whether you want to run the additional query or not. In addition, the prompt lets you apply filters to the extra dimensions you include in the new query. This means you can restrict the size of the query to only the data necessary for your analysis. You need permission from your administrator to drill out of the scope of analysis during a drill session.
Synchronize drill on report blocks option
When you select theSychronize drill on all report blocksoption, the display of all blocks changes to correspond with your drill actions. For example, if you drill down on a block from year to quarter, and your report also contains a chart showing data by year, the chart display also changes to display data by quarter.
Building reports with the SAP BusinessObjects Web Intelligence HTML Report Panel 25
2
Accessing Web Intelligence from InfoViewIf you do not select the option, only the drilled block changes in response to drill actions.
Start drill session option
TheStart drill sessionoption controls how Web Intelligence behaves when you start drill mode.
Start drill session on existing report option
When you selectStart drill session on existing report, the current report becomes drillable when you start drill mode. When you end drill mode, the report displays the drilled values.
Start drill session on a duplicate report option
When you selectStart drill on a duplicate report, Web Intelligence creates a duplicate of the current report when you start drill mode, and you drill on the duplicate. This allows you to compare the results of the original report with the results you discover during your drill analysis.
Web Intelligence locale options
Locales determine how Web Intelligence displays its interface (for example, menu items and button text) and data (for example, date and number formatting).
Web Intelligence has three locales:
Description Locale
The locale in which the Web Intelli-gence interface is displayed Product Locale
The locale of the data currently con-tained in the document
Document Locale
The user's preferred locale for display-ing document data
Preferred Viewing Locale
Accessing Web Intelligence from InfoView
2
Web Intelligence InfoView optionsThe InfoView settings determine how the Document Locale and Preferred Viewing Locale interact to display document data.
Related Topics
•To permanently associate a locale with a document
The Product Locale
The product locale is used to display the Web Intelligence interface (for example, menu items and button text).
Note:
TheGetLocalefunction returns the Product Locale. To set the Product Locale
1. ClickPreferenceson the main InfoView toolbar. 2. ClickGeneralto display the general options.
3. Select the product locale from theProduct localelist.
The Document Locale
The Document Locale formats the data in a document. For example, the Document Locale determines how Web Intelligence displays dates and numbers.
If the Web Intelligence settings in InfoView give the user's Preferred Viewing Locale priority through theUse my Preferred Viewing Locale to format the datasetting, Web Intelligence sets the Document Locale to the Preferred Viewing Locale when the user opens a document. When the user saves the document, Web Intelligence saves this Document Locale with the document. If the Web Intelligence settings do not give the user's Preferred Viewing Locale Priority, Web Intelligence formats the data according to the Document Locale saved with the document.
When a user creates a document, Web Intelligence always assigns the user's Preferred Viewing Locale as the initial Document Locale, whether or not the Web Intelligence settings in InfoView give the Preferred Viewing Locale priority.
Building reports with the SAP BusinessObjects Web Intelligence HTML Report Panel 27
2
Accessing Web Intelligence from InfoViewA user can permanently associate the current Document Locale with a document by saving the document with thePermanent Regional Formatting
option selected. Once a document has been saved with the option selected, Web Intelligence ignores the InfoView settings and always formats the document data using the saved Document Locale. This applies to all users, not just the user who selected thePermanent Regional Formattingoption.
Note:
TheGetContentLocalefunction returns the Document Locale.
Related Topics
•To permanently associate a locale with a document To set the Document Locale
1. ClickWeb Intelligence Preferencesto display the Web Intelligence options.
2. ClickUse the document locale to format the databeneathWhen viewing a document.
The Preferred Viewing locale
The Preferred Viewing Locale is a user's preferred locale for displaying document data. The Document Locale becomes the user's Preferred Viewing Locale when the InfoView settings give the Preferred Viewing Locale priority.
Note:
TheGetPreferredViewingLocalefunction returns the Preferred Viewing Locale. TheGetLocalizedfunction also uses the Preferred Viewing Locale to display translated strings.
To set the Preferred Viewing Locale
1. ClickPreferenceson the main InfoView toolbar. 2. ClickGeneralto display the general options.
3. Select the preferred viewing locale from thePreferred viewing locale
list.
4. ClickWeb Intelligence Preferencesto display the Web Intelligence options.
Accessing Web Intelligence from InfoView
2
Web Intelligence InfoView options5. If you want data to be formatted using the preferred viewing locale, click
Use my Preferred Viewing Locale to format the databeneathWhen viewing a document.
To permanently associate a locale with a document
1. In Web Intelligence Interactive, selectDocument>Propertiesfrom the menu to display the" Document Properties" dialog box, then select
Permanent regional formatting.
2. In the Web Intelligence Java Report Panel or Web Intelligence Rich Client, right-click an empty area of the report, selectDocument Propertiesto display theDocument Propertiespane, then selectPermament Regional Formattingin theDocument Optionssection of the pane. 3. Save the document.
The current Document Locale is associated permanently with the document.
Building reports with the SAP BusinessObjects Web Intelligence HTML Report Panel 29
2
Accessing Web Intelligence from InfoViewAccessing Web Intelligence from InfoView
2
Web Intelligence InfoView optionsReturning data using
queries
Creating, editing and saving documents
You create Web Intelligence documents by first selecting a universe in InfoView. Each universe maps to a database containing corporate business information. When you connect to a universe, Web Intelligence automatically launches the document editor selected on the Web Intelligence Document Preferences page in InfoView.After you have selected a universe, you use the objects in the universe to build a query to return data from the database to your Web Intelligence document.
After creating a document you can save it to the InfoView repository.
Building queries
To build and run a query
1. On the InfoView Home page, click the arrow next toNew, then select
Web Intelligence Documenton the top toolbar. Alternatively, clickAdd Queryin the Query Panel if you are adding a query to a document that already contains at least one query.
2. Click the title of the universe on which you want to create a document. 3. Click the + sign next to a class folder in theUniverse Objectspane.
The class expands to show the objects that belong to the class.
4. Double-click an object in theUniverse Objectspane; or Drag an object from theUniverse Objectspane and drop it onto theResult Objects
pane; or select an object on theUniverse Objectspane, then click>>. 5. Repeat the previous step for every object you want to include in the query. 6. The next step depends on whether you want to generate a default
formatted report immediately to view the results or whether you want to design the document structure now and then generate the results with your personalized formatting.
Returning data using queries
Description Option
Do this to display the results corre-sponding to the query definition in a vertical table, containing data for all of the objects included on the query.
Click Run.
Do this to select a specific table or chart template for the data or insert additional reports and then allocate a sub-set of the query data to each report.
Click the Report tab at the top of the HTML Report Panel, specify the structure of the document, and then click Run.
How universe objects map to data
Classes and subclasses
Objects are grouped into folders called classes. Each class can also contain one or more subclasses. Subclasses contain objects that are a further subcategory of the objects in the upper level of the class.
The role of classes is to organize the objects into logical groups. When you create queries on the universe, classes help you to find the objects that represent the information that you want to use in a query.
Dimension object
A dimension object represents data that provides the basis for analysis in a report. Dimension objects typically retrieve character-type data, for example; customer names, resort names, or dates.
Dimension objects appear as follows in the Web Intelligence query panel:
Detail object
A detail obect provides descriptive data about a dimension. A detail is always attached to the dimension for which it provides additional information. For example, [Age] is a detail object that is associated with the (Customer] dimension.
Detail objects appear as follows in the Web Intelligence query panel:
Building reports with the SAP BusinessObjects Web Intelligence HTML Report Panel 33
3
Returning data using queriesMeasure object
The measure object retrieves numeric data that is the result of calculations on data in the database. For example, [Revenue] is the calculation of the number of items sold multiplied by item price. Measure objects are often located in a Measures class.
Measure objects appear as follows in the Web Intelligence query panel:
There are two types of measure:
• classic measures - calculated by Web Intelligence
• smart measures - calculated by the database on which the universe is based
In certain situations, smart measures impact the way in which Web
Intelligence displays calculations. For more information on smart measures, see theUsing Functions, Formulas and Calculations in SAP BusinessObjects Web Intelligenceguide.
To add objects to a query
You must be on theQuerytab of the HTML Report Panel. 1. Click + next to a class folder or double-click a class folder.
2. Double-click an object in the class you expanded or drag the object to theResult Objectspane or select the object then click>>.
To remove objects from a query
You must be on theQuerytab of the HTML Report Panel.
• Drag the object from theResult Objectspane and drop it onto the
Universe Objectspane or select the object then click<<. Returning data using queries
To remove a query
1. Select a the query you want to remove by right-clicking the appropriate Query tab.
2. ClickRemove.
To interrupt a query
When you interrupt a query, only partial data is returned to the document. The values displayed in the document do not accurately reflect the definition in the query.
1. On the "Waiting - Refresh Data" dialog box, clickCancel. The "Interrupt Data Retrieval" dialog box appears. 2. ClickOK.
Setting the scope of analysis
Scope of analysis
The scope of analysis for a query is extra data that you can retrieve from the database to give more details on the results returned by each of the objects in a query. This extra data does not appear in the initial result report, but it remains available in the data cube, so you can pull this data in to the report to allow you to access more detail at any time. This process of refining the data to lower levels of detail is called drilling down on an object.
In the universe, the scope of analysis corresponds to the hierarchical levels below the object selected for a query. For example, a scope of analysis of one level down for the object Year, would include the object Quarter, which appears immediately under Year.
You can set this level when you build a query. It allows objects lower down the hierarchy to be included in the query, without them appearing in the
Results Objectspane. The hierarchies in a universe allow you to choose your scope of analysis, and correspondingly the level of drill available.
Building reports with the SAP BusinessObjects Web Intelligence HTML Report Panel 35
3
Returning data using queries Setting the scope of analysisIn the Java Report Panel and in Web Intelligence Rich Client, you can also create a custom scope of analysis by selecting specific dimensions for the
Scope of Analysispane.
Note:
You cannot set the scope of analysis when working in query drill mode because this drill mode causes Web Intelligence to modify the scope dynamically in response to drill actions.
Levels of scope of analysis
You can set the following levels for scope of analysis:
Description Level
Only the objects that appear in the
Results Objectspane are included in the query.
None
For each object in theResult Objects
pane, one, two, or three objects lower down the hierarchy tree are included in the query. The data from these ob-jects is stored in the cube until you add them to the document.
• One level down
• Two levels down
• Three levels down
All objects added manually to the Scope of Analysis panel are included in the query.
Custom Note:
This option is available in the Java Report Panel and in Web Intelligence Rich Client only.
Including a scope of analysis in a document increases the document size significantly. This is because the data necessary for the scope you specify is saved with the document, even though it is not visible in the reports unless you start drill mode and drill down to the data to display the corresponding values.
Returning data using queries
3
Setting the scope of analysisIn order to minimize the size of documents and optimize performance, we recommend that you only include a scope of analysis in documents where you are certain that users will need to drill.
We suggest the following method because it will be easier for you to set the scope of analysis seeing the hierarchy of the classes and objects.
To set the scope of analysis
1. On the Query tab, click the arrow next to theScope of Analysis
drop-down list box.
2. Select a level for the scope of analysis.
Query contexts
What is an ambiguous query?
An ambiguous query is a query that contains one or more objects that can potentially return two different types of information.
In a universe, certain dimensions may have values that are used for two different purposes in the database. For example, the [Country] dimension in the query below can return two types of information:
• Customers and the country in which they spent their vacation.
• Customers and the country for which they have made their reservation. The role that Country plays in this query is ambiguous. A country can be either the country where a vacation was sold, or a country where a vacation is reserved. One is existing information (sales), and the other is future information (reservations).
To avoid ambiguities in a query, the universe designer identifies the different ways that objects can be used in the universe, and implements restrictions on how these objects can be combined. These restrictions are called contexts.
Building reports with the SAP BusinessObjects Web Intelligence HTML Report Panel 37
3
Returning data using queriesWhat is a context?
A context is a defined group of objects that share a common business purpose. This business purpose is usually the type of information that these related objects represent. For example, a sales context is a grouping of all the objects that can be used to create sales queries. A reservations context is a grouping of all the objects that can be used in reservation queries. Contexts are defined in a universe by the universe designer.
You can combine any object within the same context to create a query. You can also combine objects in different contexts. If you use an object that is common to both contexts, Web Intelligence will try to determine the context that best fits the other objects in the query.
If it cannot determine a context, you are prompted to choose the context that you want to apply to the query.
Choosing a context when you run a query
When you create a query or refresh a report, you may be asked to choose a context before the query can run. Contexts are set up in a universe to avoid ambiguous queries.
To choose a context when you run a query
1. Run the query containing multiple contexts. The "Select a Context" dialog box appears.
2. Select the context in the "Select a Context" dialog box.
Web Intelligence query properties
Allow other users to edit all queries property
When selected, other users who have the appropriate editing rights can access Query View and modify the queries in the document. When cleared, Returning data using queries
only the report creator can modify the queries. This option is selected by default. Unlike the other query properties, which only apply to the selected query, this option applies to all of the queries in the document.
Max retrieval time query property
Maximum time that a query can run before the query is stopped. This can be useful when a query is taking too long due to an excess of data, or network problems. You can set a time limit so a query can stop within a reasonable time.
Max rows retrieved query property
TheMax rows retrievedquery property determines the maximum number of rows of data that are displayed when a query is run. If you only need a certain amount of data, you can set this value to limit the number of rows of data in your document.
Max rows retrieveddoes not operate at the database level. If you setMax rows retrievedto 1000, and your query returns 5000 rows, Web Intelligence initially retrieves all 5000 rows, before discarding 4000 and retaining only the first 1000 rows.
TheSample result setquery property also applies a restriction on the number of rows in the query, but at the database level. If you setMax rows retrievedto 2000 andSample result setto 1000, the query retrieves a maximum of 1000 rows only.
This setting can be overridden by the limits set by your administrator in your security profile. For example, if you set theMax rows retrievedsetting to 400 rows, but your security profile limits you to 200 rows, only 200 rows of data will be retrieved when you run the query.
Query prompt order
Prompts are listed in the list. You can use the up and down arrows to move a prompt up or down the list to change the order in which they are executed.
Building reports with the SAP BusinessObjects Web Intelligence HTML Report Panel 39
3
Returning data using queries Web Intelligence query propertiesRetrieve duplicate rows query property
In a database, the same data may be repeated over many rows. You can choose to have these repeated rows returned in a query, or to have only unique rows returned.
Query Stripping
Query Stripping enables you to optimize the query generation automatically. With Query Stripping enabled, Web Intelligence generates a query containing only those objects that effectively contribute to a report. It improves the performance of the report by sending the stripped query to the connection server.
Each time you refresh a query, Web Intelligence strips the objects which are not contributing to the report (directly or indirectly) from the report as well as from the SQL Viewer tab. It refreshes only the query that is directly related to the report. The stripped objects get deleted from the report and appear as bold in the Data map to allow easy identification of the stripped objects. You can drag and drop these objects if you want them to appear in the report again. Once you drag and drop these objects, the column header of the report displays the object definition and data cells display#Refresh. Refresh the query again to allow the stripped objects data to appear in the report.
Note:
• Query Stripping is applicable only for OLAP database users. • In a Query Stripping enabled document, if a query filter is used on a
Measure object, Web Intelligence does not strip the objects.
For more information about how to work with Web Intelligence, seeBuilding Reports with Web Intelligence Rich Clientguide on SAP Help Portal: http://help.sap.com
To control Query Stripping
You can control the automatic query optimization by enabling or disabling
Query Strippingat two levels, namely, Query and Document level property. Returning data using queries
• Query level property: At Query level property, Query Stripping can be enabled or disabled only by Power users, who create a Web Intelligence report and defines queries and initial structures of the report. Query Stripping at query level property is disabled by default. In case of multiple queries in the same document, the query set for Query Stripping will be stripped and other queries would remain unaffected.
• Document level property: At Document level property, Query Stripping can be enabled or disabled by all the users of Web Intelligence to change the report objects for analysis. Query Stripping at document level property is disabled by default.
When you create a Web Intelligence document, by default the Query Stripping is disabled. A power user needs to enable this parameter to strip an object for a specific query. Web Intelligence fails to strip a query if the document level property is enabled and query level property is disabled or vice-versa. Query Stripping works only when Query Stripping is enabled at both Query and document level properties.
Once the Query Stripping is disabled at the document level property, Web Intelligence retains the default pattern of refreshing all the objects selected in the query panel for a specific query sent to the connection server. 1. To enable Query Stripping at the query level for a specified query, select
Enable Query Strippingin the "Query Properties" tab while creating a Web Intelligence report.
Note:
Enable Query Strippingparameter is set only by the Power users who needs to edit Query or create query rights. The user of a report will not be able to set this parameter.
2. To enable Query Stripping at the document level for a specified query, selectEnable Query Strippingin the Document Properties tab. As a result, Query Stripping is enabled for a specified query.
Reset contexts on refresh query property
When selected, you are prompted to choose a context each time a query requiring a context is run. When unselected, Web Intelligence retains the context specified the first time you run the query.
Building reports with the SAP BusinessObjects Web Intelligence HTML Report Panel 41
3
Returning data using queries Web Intelligence query propertiesClear contexts query property
When this property is selected, Web Intelligence clears the contexts listed in the list when you next run the query or refresh the data.
Sample result set query property
TheSample result setproperty determines the maximum number of rows that a query returns. The property applies this restriction at the database level. If the database supports sampling, Web Intelligence adds the restriction to the SQL that Web Intelligence generates to return the data.
If you select theFixedoption, Web Intelligence uses fixed sampling. At each data refresh, the query returns the same rows. If you do not set theFixed
option, Web Intelligence uses random sampling. At each data refresh, the query returns a different set of sampled rows.
Sample result setis more efficient than theMax rows retrievedproperty, which discards rows beyond the maximum limit only after retrieving all the rows in the query.
Not all databases support fixed and random sampling. If they are not supported, the properties are disabled (in the Java Report Panel) or invisible (in Query - HTML). Sampling is not available at all in the HTML Report Panel. Returning data using queries
Filtering data using query
filters
Filtering the data selection in the query
You define filters on the query to limit the data returned to the document to a specific business focus. For example, you can filter the query to return data for a specific customer group or time period.You define query filters on theQuery Filterstab.
To select a predefined query filter
• Double-click the predefined filter or drag it to theQuery Filterspane. When you run the query, the data corresponding to the query filters you selected is returned to the report.
To combine query filters
1. Create the filters and add them to theQuery Filterspane.
By default, Web Intelligence combines the filters with the AND operator. 2. Doubleclick the operator (Java Report Panel, Rich Client and Query
-HTML) or click the arrow next to the operator checkbox and select the other operator (HTML Report Panel) to toggle between AND and OR.
To create a custom query filter
1. In theUniverse Objectspane, double-click the object you want to filter. 2. Click the arrow next to the list box to view the available operators and
select the operator you need.
If you select the In list or Not in list operator, you need to separate each value by a semicolon;) with no spaces. For example, if you want to filter the [Country] object for US, Japan, and Germany you need to enter the values for country as follows: US;Japan;Germany
The operator you selected appears in the list box.
3. In theValue 1text box, type the value(s) for which you want to retrieve data. If the operator you selected requires two values, type the second value in theValue 2text box.
4. ClickOK. Filtering data using query filters
4
Filtering the data selection in the queryNesting query filters
Nesting query filters allows you to create more complex filter conditions than is possible when you combine filters at the same level.
When you nest filters, you set the order in which Web Intelligence evaluates them. For example, Web Intelligence can return the data given by two query filters joined in an OR relationship (where either one filter condition or the other is true) and then further restrict this data by applying another filter to it. In this case, the two filters in an OR relationship are nested, then compared with the other filter in an AND relationship.
The following example illustrates this:
Example:List all sales made in Japan either in Q4 or where the revenue was greater than 1000000
To answer this question you create the following nested query filter:
Country Equal To Japan
AND Quarter Equal To Q4
OR
Revenue Greater Than 1000000
Web Intelligence first returns sales data where the sale was made in Q4 or the revenue was greater than 1000000, then restricts this data further by returning only those sales made in Japan.
To nest query filters
1. On the Query Filters tab, create at least one filter.
2. Select the filter below which you want to insert the sub-filter. 3. Click the+sign next to theQuery Filterspane.
Web Intelligence adds the And operator or the Or operator one level below the selected filter.
Building reports with the SAP BusinessObjects Web Intelligence HTML Report Panel 45
4
Filtering data using query filters4. Define a new filter on one of the dimensions or measures displayed on theUniverse Objectspane.
The new filter is nested below the filter you selected above. 5. Create additional sub-filters, as appropriate.
6. If you want to change the order of filters, select the filter you want to move, and then either click theMove uparrow (to move the filter up) or click theMove downarrow (to move the filter down).
TheMove upandMove downarrows are situated to the right of the
Query Filterspane.
To create a prompt
1. Click theQuery Filterstab.
2. In the Universe Objects pane, double-click the object you want to filter. The object is added to the top of theQuery Filterspane.
3. If necessary, choose a different operator by clicking the arrow next to the drop-down list box and selecting the appropriate operator.
4. SelectPrompt.
If you want users who answer the prompt to type the value(s) they want to return to the document, or if you selected an object that represents data for dates, for example, an invoice date, then verify that theWith List of Valuesoption is not selected.
Or
If you want users who answer the prompt to be able to select the value(s) from a list that they want to return to the document, selectWith List of Values.
Web Intelligence displays a message for the prompt in theMessagetext box(es).
5. If you wish, change the default message(s) for the prompt by typing a different message into the Message text box(es).
6. ClickOK.
Web Intelligence adds the new prompt to the list of filters in the Query Filters pane.
Filtering data using query filters
4
To create a promptQuery filter and prompt operators
Equal To operator
Use the Equal to operator to obtain data equal to a value.
For example, to return data for the US only, create the filter "County Equal To US".
Not Equal To operator
Use the Not Equal To operator to obtain data not equal to a value.
For example, to return data for all countries except the US create the filter "County Not Equal To US".
Different From operator
Use the Different From operator to retrieve data different from a value. For example, to retrieve data for all quarters execpt Q4, create the filter [Quarter] Different From "Q4"
Greater Than operator
Use the Greater Than operator to retrieve data greater than a value. For example, to retrieve data for customers aged over 60, create the filter "[Customer Age] Greater than 60".
Greater Than Or Equal To operator
Use the Greater Than Or Equal To operator to retrieve data greater than or equal to a value.
Building reports with the SAP BusinessObjects Web Intelligence HTML Report Panel 47
4
Filtering data using query filters Query filter and prompt operatorsFor example, to retrieve data for revenue starting from $1.5M, create the filter "[Revenue] Greater than or equal to 1500000".
Less Than operator
Use the Less Than operator to retrieve data lower than a value.
For example, to retrieve data for exam grades lower than 40, create the filter "[Exam Grade] Less Than 40".
Less Than Or Equal To operator
Use the Less Than Or Equal To operator to retrieve data less than or equal to a value.
For example, to retrieve data for customers whose age is 30 or less, create the filter "[Age] Less Than Or Equal To 30".
Between operator
Use the Between operator to retrieve data between and including two values. For example, to retrieve data for weeks starting at week 25 and finishing at 36 (including week 25 and week 36), create the filter "[Week] Between 25 and 36".
Not Between operator
Use the Not Between operator to retrieve data outside the range of two values.
For example; to retrieve data for all the weeks of the year, except for and not including weeks 25 through 36, create the filter "[Week] Not between 25 and 36".
Filtering data using query filters
4
Query filter and prompt operatorsIn List operator
Use the In List operator to retrieve data corresponding to values in a list of values.
For example, to retrieve data for the US, UK and Japan only, create the filter [Country] In List ("US";"UK";"Japan").
Not In List operator
Use the Not In List operator to retrieve data that does not correspond to multiple values.
For example, if you do not want to retrieve data for the US, UK and Japan, create the filter [Country] Not In ("US";"UK";"Japan").
Matches Pattern operator
Use the Matches Pattern operator to retrieve data that includes a specific string or part of a string.
For example, to retrieve customers whose date of birth is 1972, create the filter [DOB] Matches Pattern "72".
Different From Pattern operator
Use the Different From Pattern operator to return data that doesn't include a specific string.
For example, to retrieve customers whose date of birth is not 1972, create the filter [DOB] Different From Pattern '72'.
Both operator
Use the Both operator to retrieve data that corresponds to two values.
Building reports with the SAP BusinessObjects Web Intelligence HTML Report Panel 49
4
Filtering data using query filters Query filter and prompt operatorsFor example, to retrieve customers who have both a fixed and a mobile telephone, create the filter [Account Type] Both 'Fixed' And 'Mobile'.
Except operator
Use the Except operator to retrieve data that corresponds to one value and excludes another.
For example, to retrieve customers who have a fixed telephone and do not have a mobile telephone, create the filter [Account Type] 'Fixed' Except 'Mobile'.
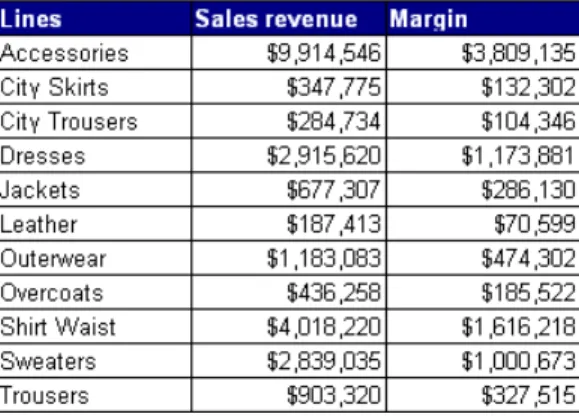
The Except operator is more restrictive thanDifferent FromorNot In List. For example, a report that returns customers and that includes the filter[Lines] Different From 'Accessories'excludes all sales records where the item sold is part of the 'Accessories' line. If the same customer has purchased Accessories and non-Accessories items, the customer still appears in the report, but their spending total includes only non-Accessories sales.
If the filter is[Lines] Except 'Accessories',only customers who have bought no accessories are included in the report.
Related Topics •Not In List operator •Different From operator Filtering data using query filters
Displaying data in tables
Table types in Web Intelligence
A Web Intelligence report displays results in a block. You can format the block as a specific type of table.
Vertical table
Vertical tables display header cells at the top of the table and the
corresponding data in columns. By default, the header cells display the names of the dimensions, details, and measures included in the table. The body cells display the corresponding values.
Horizontal table
Horizontal tables display header cells at the left of the table and the corresponding data in rows. By default, the header cells display the names of the dimensions, details, and measures included in the table. The body cells display the corresponding values.
Displaying data in tables
5
Table types in Web IntelligenceCrosstab
Crosstabs display values for dimensions across the top axis and on the left axis. The body displays the values of a measure that correspond to the cross-section of the dimensions. For example, this crosstab displays values for [Quarter] across the top axis and displays values for [State] on the left axis. The body displays values that [Sales Revenue] for each quarter in each state.
You can include multiple dimensions in crosstabs. For example, this crosstab displays two dimensions. The values for the [Sales Revenue] measure are values each state by quarter for each line.
When you create crosstabs that include a dimension(s) in the body, the body cell values are calculated according to a multi-dimensional data model. The values displayed in the body are calculated according to all of the coordinates on the table axes, whether or not there is a row for the specific coordinate in the SQL result.
Building reports with the SAP BusinessObjects Web Intelligence HTML Report Panel 53
5
Displaying data in tables Table types in Web IntelligenceForms
Forms are useful in your report if you want to display detailed information per customer, product, or partner. For example, a form is a useful way of displaying individual customer records with information such as the customer account, name, address, and so on.
Forms are also useful for formatting address labels for envelopes. Displaying data in tables
To select a table or chart template
1. Make sure you are in Edit mode, with the HTML Report Panel open, and verify you are on theReporttab.
A document can contain multiple reports. The name of the selected report appears in theCurrent reportdrop-down list box.
2. In theReport Definitionpane, click the drop-down arrow next to the list box.
The available templates are listed. 3. Select the template you want.
If you select a chart, a second list box opens with each chart sub-type related to the chart type you chose in the original list box. Click the chart sub-type you want to display in the report.
4. ClickApply.
Depending on the template you selected, one or more fields appear in the Report Definition pane.
the following field(s) appear... If you select a...
columns horizontal table
rows vertical table
columns, rows, and a body crosstab
rows form
X-axis, Y-axis 2D chart
X-axis, Y-axis, and optionally a Z-Axis
3D chart
X-axis, Y-axis pie chart
X-axis, Y-axis, and optionally a Z-Axis
radar chart
Building reports with the SAP BusinessObjects Web Intelligence HTML Report Panel 55
5
Displaying data in tables To select a table or chart templateOnce you have selected a template, you need to allocate each object to he rows and columns of a table or to the different axes of a chart.
Allocating data to tables
By default, when you define the query for a new document, Web Intelligence displays the results on a new report in a vertical table. You can select a different table or chart template before you run a new query to view the results. You can also modify an existing report by applying a different table or chart template.
To select a table or chart template
1. Make sure you are in Edit mode, with the HTML Report Panel open, and verify you are on theReporttab.
A document can contain multiple reports. The name of the selected report appears in theCurrent reportdrop-down list box.
2. In theReport Definitionpane, click the drop-down arrow next to the list box.
The available templates are listed. 3. Select the template you want.
If you select a chart, a second list box opens with each chart sub-type related to the chart type you chose in the original list box. Click the chart sub-type you want to display in the report.
4. ClickApply.
Depending on the template you selected, one or more fields appear in the Report Definition pane.
the following field(s) appear... If you select a...
columns horizontal table
rows vertical table
columns, rows, and a body crosstab
rows form
Displaying data in tables