Accidents at work 2012
Number of accidents at work in Finland 139,000 in 2012
A total of 139,000 accidents at work occurred in Finland during 2012. Around 128,000 of these occurred to wage and salary earners and some 11,200 to self-employed persons (including farmers). The majority, or almost 116,000 of all accidents at work occurred at places of work or while in work traffic, whereas nearly 23,000 of them occurred while commuting. These numbers also include minor accidents at work that led to disability lasting less than four days, and on which insurance companies paid compensation only for medical treatment expenses.
Number of wage and salary earners’, self-employed persons’ and farmers’ accidents at work by severity in 2012
Commuting accidents Accidents at work
Total
N N
N
22 885 116 150
139 035
Total
12 994 65 487
78 481 Less than 4 days
9 873 50 620
60 493 At least 4 days
18 43
61 Fatal accidents
22 296 105 496
127792
Wage and salary earners
12 748 61 888
74 636 Less than 4 days
9 532 43 576
53 108 At least 4 days
16 32
48 Fatal accidents
589 6 100
6 689
Self-employed persons
246 2 750
2 996 Less than 4 days
341 3 346
3 687 At least 4 days
2 4
6 Fatal accidents
–1) 4 554
4 554
Farmers
– 849
849 Less than 4 days
– 3 698
3 698 At least 4 days
– 7
7 Fatal accidents
Farmers' accidents at work and commuting accidents are not separated. 1)
The number of accidents at work decreased slightly in 2012. In 2011, there were 142,000 accidents at work and in 2010 the respective figure was 135,000. Wage and salary earners' accidents at work increased from 2005 to 2008, but in 2009 the total number of accidents at work fell to the level where it was ten years previously. The economic downturn in Finland in 2009 and changes in the number of hours worked
Quoting is encouraged provided Statistics Finland is acknowledged as the source. Helsinki 28.11.2014
explain for the main part the change. It is not meaningful to make detailed comparisons of the time series prior and subsequent to 2005 with relation to total numbers (incl. cases resulting in disability of under four days) on account of the full-cost renewal that entered into force in 2005.
Since the reference year 2005, an accident at work has been defined in Statistics Finland’s statistics on occupational accidents according to the definition used in Eurostat's (the Statistical Office of the European Communities) European Statistics on Accidents at Work (ESAW). According to the definition, the statistics contain data on accidents at work which have resulted in "disability of at least four days". Most of the data in this online release are presented using this criterion. The time series have been revised retrospectively to correspond with the definition.
In 2012, a total of 61 persons died at the place of work or while commuting. Of these fatal accidents at work, 32 occurred to wage and salary earners, seven to own-account workers in agriculture (farmers) and four to other self-employed persons. In addition, 18 fatal accidents took place while commuting, of which 16 occurred to wage and salary earners and two to other self-employed persons than farmers. The number of fatal accidents at work rose clearly from the year before, as in 2011 a total of 55 persons died at work or while commuting.
The victims of all fatal accidents at work included 48 wage and salary earners, seven farmers and four other self-employed persons.
Contents
Wage and salary earners’ accidents at work...5
Number of wage and salary earners' accidents at work ??? slightly...5
Postal and courier activities most dangerous...7
ESAW variables describing the circumstances and manner of accidents at work among wage and salary earners...8
Risk of commuting accidents grew clearly...13
Self-employed persons’ accidents at work...16
Farmers’ accidents at work decreased...17
Tables
Table 1. Wage and salary earners’ accidents at work by gender and age in 2012...7Table 2. Wage and salary earners’ accidents at work by gender and working process in 2012 ...9
Table 3. Wage and salary earners’ accidents at work by gender and specific physical activity in 2012 ...9
Table 4. Wage and salary earners’ accidents at work by gender and deviation in 2012 ...10
Table 5. Wage and salary earners' accidents at work by gender and contact - mode of injury in 2012...10
Table 6. Wage and salary earners' accidents at work by gender and material agent of contact - mode of injury in 2012...11
Table 7. Wage and salary earners’ accidents at work by gender and type of injury in 2012 ...12
Table 8. Wage and salary earners' accidents at work by gender and injured body part in 2012...12
Table 9. Wage and salary earners’ accidents at work by gender and length of disability in 2012...13
Table 10. Wage and salary earners’ commuting accidents by gender and type of accident in 2012 ...15
Table 11. Wage and salary earners’ commuting accidents by gender and type of injury in 2012 ...16
Table 12. Wage and salary earners’ commuting accidents by gender and injured body part in 2012...16
Table 13. Farmer’s fatal accidents at work compared with wage and salary earner’s fatal accidents in high risk industry per 100,000 farmers or wage and salary earners in 2011 to 2012...18
Table 14. Farmers’ accidents at work by type of work and gender in 2012 ...19
Table 15. Self-employed persons’ accidents at work by gender and age in 2012...22
Figures
Figure 1. Wage and salary earners' fatal accidents at work per 100,000 wage and salary earners in 1996 to 2012...5Figure 2. Changes in the number of accidents at work by status in employment in 2000 to 2012...6
Figure 3. Wage and salary earners’ accidents at work per 100,000 salary and wage earners in 1996 to 2012...6
Figure 4. Wage and salary earners’ accidents at work per 100,000 salary and wage earners by gendre and age in 2012...7
Figure 5. Wage and salary earners’ accidents at work per one million hours worked by branch of industry in 2012, accident frequency more than average...8
Figure 6. Average duration of disability caused by wage and salary earners’ accidents at work by gender and age in 2012...13
Figure 7. Wage and salary earners’ commuting accidents per 100,000 wage and salary earners by gender and age in 2012...14
Figure 9. Farmers’ non-fatal accidents at work resulting in at least 4 days’ absence in 2000–2012...17
Figure 10. Farmers’ accident rates in 2000 to 2012...18
Figure 11. Farmers’ accident at work per 100,000 insured by gender and age in 2012...19
Figure 12. Farmers’ accidents at work by contact-mode of injury (ESAW) and gender in 2012...20
Figure 13. Farmer’s accidents by material agent of contact-mode of injury in 2012...21
Figure 14. Farmers’ accidents at work by type of injury (ESAW) and gender in 2012...21
Figure 15. Farmers’ accidents at work by injured body part (ESAW) and gender in 2012...22
Wage and salary earners’ accidents at work
Risk of death at work went down again
A total of 32 fatal accidents at work occurred to wage and salary earners in 2012. The number of fatal accidents at work rose clearly from the year before, as in 2011 accidents at work resulted in the death of 26 wage and salary earners. It should be noted that accidents in work traffic cannot always be separated from commuting accidents when settling claims. Therefore, some of the accidents that occur in work traffic are recorded as commuting accidents. The number of accidents in work traffic has decreased evenly from the early 1990s (Appendix table 1).
The risk of death at work turned upwards again. In 2012, an average of 1.5 per 100,000 wage and salary earners died in an accident at work (Figure 1). The respective figure was 1.2 in 2011. This means a rise of one-quarter relative to the risk of fatal accidents at work in the previous year (25.0%). The difference between genders with regard to fatal accidents at work is still clear: of the 32 fatal accidents at work 29 occurred to men and three to women. Fatal accidents at work concentrated on certain industries: nearly two out of three fatal accidents at work occurred in the activities of manufacturing (industry category C), construction (F), wholesale and retail trade (G), and transportation and storage (H) (Appendix table 2). The risk of deaths at work has conventionally been particularly high in the construction industry. The most risky industry in 2012 was indeed construction, where there were 5.3 fatal accidents per 100,000 wage and salary earners working in the industry. In the industry of transport and storage the risk of fatal accidents at work was 5.0. In the activity of manufacturing, 1.5 per 100,000 wage and salary earners, on the average, had a fatal accident at work (see Table 13).
The data by industry are based on the revised Standard Industrial Classification TOL 2008, which was adopted in the Statistics on Accidents at Work in the statistical reference year 2008. The data classified by the revised industrial classification are not comparable with those produced by its predecessor TOL 2002 (this applies to data from the reference year 2007 and prior to it).
Figure 1. Wage and salary earners' fatal accidents at work per 100,000 wage and salary earners in 1996 to 2012
Number of wage and salary earners' accidents at work ??? slightly
The number of wage and salary earners’ accidents at work was slightly lower in 2012 than one year earlier. In 2012, wage and salary earners had 43,576 accidents at work causing disability of at least four days. This was around 2,000 accidents fewer than in 2011 (-4.5%). Farmers’ accidents at work decreased by
around 160 from the year before, and the number of accidents suffered by other self-employed people also fell by nearly one hundred (Figure 2). It must, however, be noted that the accident insurance is voluntary for self-employed persons, so the number of accidents at work may also indicate the popularity of insurance among self-employed persons. Around 40 per cent of self-employed persons are estimated to be insured against accidents at work.
Figure 2. Changes in the number of accidents at work by status in employment in 2000 to 2012
The risk of accidents at work has been falling among Finnish wage and salary earners since the late 1990s (Figure 3). This becomes evident when the number of accidents is expressed as a proportion of 100,000 wage and salary earners. The accident incidence rate fell by some 14 per cent between 1998 and 2004. In 2012, a total of 2,013 accidents at work resulting in a disability of at least four days occurred per 100,000 wage and salary earners. The corresponding ratio in the previous year was 2,109, which means that the risk of accidents at work fell slightly from with the previous year (-4.6%). The accident incidence rate is used to measure variation in the risks of accidents in different industries and occupational groups.
Figure 3. Wage and salary earners’ accidents at work per 100,000 salary and wage earners in 1996 to 2012
Accidents at work continue to be a problem among men: seven in ten accidents at work (67.7%) occur to men. Men’s risk of accidents at work has conventionally been clearly higher than that of women. Measured with the accident incidence rate, men’s risk of suffering accidents at work is nearly 2.5-fold when compared to women. The key reason for this is that more men than women work in industries and have jobs with a higher than average risk of accidents at work.
Table 1. Wage and salary earners’ accidents at work by gender and age in 2012
Females Males
Total Age
% N % N % N
100 14 059 100 29 517 100 43 576 Total
12,8 1 800 13,5 3 998 13,3 5 798
17,5 2 462 24,5 7 222 22,2 9 684
20,4 2 869 21,6 6 378 21,2 9 247
27,1 3 817 24,6 7 256 25,4 11 073
21,2 2 978 15,0 4 431 17,0 7 409
0,9 133 0,8 232 0,8 365 Others
Men's risk of accidents at work is highest among the youngest age group (aged 15 to 24). In 2012, young men had 3,110 accidents at work resulting in at least four days’ absence from work per 100,000 wage and salary earners (Figure 4). This meant that the risk measured with the accident incidence rate was over one-tenth (11.2%) higher than the average for wage and salary earner men. For young wage and salary earner men, the risk of accidents rose clearly from the year before (-10.1%). Unlike for men, women's risk of accidents is the highest among the oldest age group, that is, among those aged 55 to 64. Differences between age groups are, however, fairly small. The picture of the accidents at work situation by gender given by the accident incidence rate has remained nearly stable from one year to the next.
Figure 4. Wage and salary earners’ accidents at work per 100,000 salary and wage earners by gendre and age in 2012
Postal and courier activities most dangerous
When measured with accident frequency, industries with a high risk of accidents at work in 2012 were postal and courier activities (32.8), construction (29.8), and land transport and transport via pipelines (28.4). Figure 5 lists the industries with a higher than average (12.8) accident frequency. The frequencies have been calculated from accidents at work resulting in disability of at least four days, fatal accidents
excluded. Municipal sector employees have been classified into their own class, as information on their industry is missing from the accidents at work data files. Wage and salary earners in the municipal sector had 9.7 accidents at work per one million hours worked in 2012, while one year previously their accident frequency was 10.3.
Figure 5. Wage and salary earners’ accidents at work per one million hours worked by branch of industry in 2012, accident frequency more than average
The accident risk measured with the accident frequency has been falling almost steadily from the late 1990s. In the previous year, 2011, the accident frequency in industries totalled 13.4.
The accident frequency (accidents at work per 100,000 wage and salary earners) is a more accurate measure of risk than the accident incidence rate, as it expresses the number of accidents as a proportion of the time (hours worked) during which wage and salary earners were exposed to accidents at work. The hours worked, that is, the time of being exposed to accidents at work can, however, vary from person to person. The data on the number of wage and salary earners and their hours worked are obtained from Statistics Finland’s Labour Force Survey.
ESAW variables describing the circumstances and manner of accidents at
work among wage and salary earners
A revised form on accidents at work was introduced in Finland in 2003 to collect for the first time data on the circumstances and manner of accidents at work according to the European Statistics on Accidents at Work (ESAW). These data are now published for the tenth time in Statistics Finland’s occupational accident statistics for 2012. Compared with the previous year’s statistics the distributions of variables are similar and thus appear quite reliable. Eurostat’s project is ambitious and the data to be collected are quite detailed at times, which is why the data presented provide a comprehensive picture of the circumstances during the accident at work as well as the causes and consequences.
The Member States are allowed to exercise discretion as to the extent of their data collection. In Finland the data on accidents at work are collected on the key ESAW variables, in some of which only the main category classification is included. The data are given according to the incidence process of the accident at work, so that the prevailing circumstances are described first, then the progress of the event and finally the consequences of the accident. Categories were combined in some of the variables due to presentation reasons. The text section presents mainly distributions by gender and the appended table section distributions by other background variables, such as industry and occupation. In addition to this, data are given only
on the basis of the national classification. Such data are he data on the variable describing the direct cause of the accident at work (see Table 6). An indication that they are in line with the joint European statistics on accidents at work is given in the tables and figures based on ESAW statistics.
Most accidents occur when the person is moving
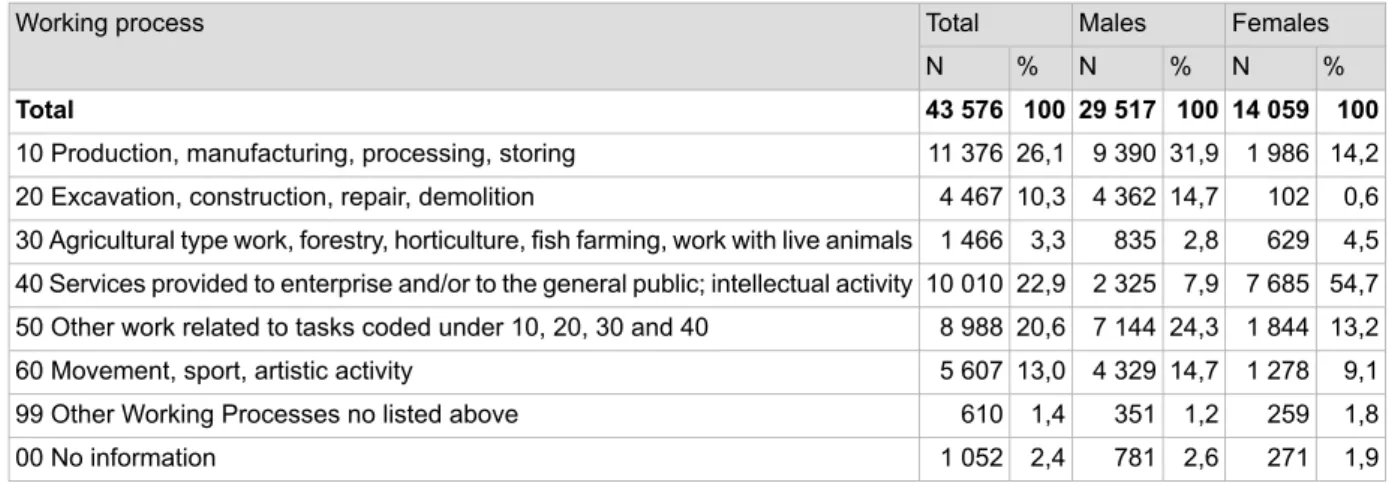
Data are given first about the general circumstances prior to the accident at work. The first ESAW variable describes the working process the wage and salary earner was involved in when the accident occurred. However, the working process does not refer to the person’s occupation, because the tasks may vary at different times in the same occupation. Nearly one third (31.9%) of men’s accidents at work occurred in working processes related to production, manufacturing, processing or storing. More than one-half (54.7%) of women's accidents at work took place in working processes related to providing services to enterprises and/or to the general public (Table 2).
Table 2. Wage and salary earners’ accidents at work by gender and working process in 2012
Females Males Total Working process % N % N % N 100 14 059 100 29 517 100 43 576 Total 14,2 1 986 31,9 9 390 26,1 11 376 10 Production, manufacturing, processing, storing
0,6 102 14,7 4 362 10,3 4 467 20 Excavation, construction, repair, demolition
4,5 629 2,8 835 3,3 1 466 30 Agricultural type work, forestry, horticulture, fish farming, work with live animals
54,7 7 685 7,9 2 325 22,9 10 010 40 Services provided to enterprise and/or to the general public; intellectual activity
13,2 1 844 24,3 7 144 20,6 8 988 50 Other work related to tasks coded under 10, 20, 30 and 40
9,1 1 278 14,7 4 329 13,0 5 607 60 Movement, sport, artistic activity
1,8 259 1,2 351 1,4 610 99 Other Working Processes no listed above
1,9 271 2,6 781 2,4 1 052 00 No information
The specific physical activity illustrates the person’sexactphysical activity just before the moment of injury, while the working process variable describes thegeneralnature of work at the time of the accident. The specific physical activity can be intentional or voluntary, but it need not be of long duration. According to the results (Table 3), nearly four in ten accidents occurred when the person was moving. A great part of women’s accidents (46.7%) took place in connection with movement than men’s (35.0%). Nearly every fifth (18.5%) accident occurred when the person was carrying a load by hand. Similarly, nearly one-fifth (17.5%) of accidents occurred when handling various objects. In relative terms, men had almost three times more accidents at work than women when working with hand-held tools.
Table 3. Wage and salary earners’ accidents at work by gender and specific physical activity in 2012
Females Males
Total Specific physical activity
% N % N % N 100 14 059 100 29 517 100 43 576 Total 2,0 288 5,2 1 548 4,2 1 836 10 Operating machine
4,7 664 13,9 4 094 10,9 4 758 20 Working with hand-held tools
1,7 234 3,0 880 2,6 1 114 30 Driving/being on board a means of
transport or handling equipment
15,7 2 203 19,8 5 855 18,5 8 058 40 Handling of objects
19,0 2 672 16,8 4 959 17,5 7 631 50 Carrying by hand
46,7 6 563 35,0 10 322 38,8 16 895 60 Movement 3,8 535 2,1 615 2,6 1 150 70 Presence 4,8 677 2,3 688 3,1 1 365 99 Other Specific Physical Activities not listed above 1,6 223 1,8 546 1,8 769 00 No information
The cause of accident most often stumbling, slipping or falling
We will next examine the progress of the events leading to the actual accident at work. Among women good one-third (36.7%) and among men good 30 per cent (31.1%) of accidents at work were consequences of stumbling, jumping, slipping or falling (Table 4). The proportions are nearly the same as one year ago. This appears from the data of the deviation variable which describes the unusual occurrence during the physical activity leading to the accident at work. If several deviating events precede the actual accident, the one occurring last is recorded. The second most common event leading to an accident was a sudden physical stress for both men (17.2%) and women (20.7%).
Table 4. Wage and salary earners’ accidents at work by gender and deviation in 2012
Females Males Total Deviation % N % N % N 100 14 059 100 29 517 100 43 576 Total 0,2 22 0,4 109 0,3 131 10 Deviation due to electrical problems, explosion, fire
2,1 301 2,5 725 2,4 1 026 20 Deviation by overflow, overturn, leak, flow, vaporisation, emission
8,2 1 157 11,1 3 275 10,2 4 432 30 Breakage, bursting, splitting, slipping, fall, collapse of Material Agent
7,6 1 066 13,0 3 825 11,2 4 891 40 Loss of control (total or partial) of machine, means of transport or handling
equipment, hand-held tool, object, animal
36,7 5 161 31,1 9 189 32,9 14 350 50 Slipping – Stumbling and falling – Fall of persons
12,3 1 727 16,9 4 993 15,4 6 720 60 Body movement without any physical stress (generally leading to an external injury) 20,7 2 904 17,2 5 087 18,3 7 991 70 Body movement under or with physical stress (generally leading to an external injury) 5,1 710 1,4 420 2,6 1 130 80 Shock, fright, violence, aggression, threat, presence
4,9 691 4,1 1 198 4,3 1 889 99 Other Deviations not listed above
2,3 320 2,4 689 2,3 1 016 00 No information
Roughly three tenths (30.1%) of the victims of accidents at work were injured due to horizontal or vertical impact with or against a stationary object (Table 5). This is also indicated in the data of the variable expressing the deviating situation leading to the accident, where stumbling, falling or similar was the most common event leading to the accident. With a few exceptions, the data of these two variables on men and women are almost identical. Roughly every fourth (24.8%) was injured as a result of sudden physical or mental stress. The mode of injury describes how the injured body part came into contact with the cause of the injury. Where there are several modes of injury, the one causing the most serious injury is recorded.
Table 5. Wage and salary earners' accidents at work by gender and contact - mode of injury in 2012
Females Males
Total Contact - Mode of injury (ESAW)
% N % N % N 100 14 059 100 29 517 100 43 576 Total 3,0 421 2,7 802 2,8 1 223 10 Contact with electrical voltage, temperature, hazardous substances
0,0 3 0,0 6 0,0 9 20 Drowned, buried, enveloped
34,8 4 887 29,3 8 656 31,1 13 543 30 Horizontal or vertical impact with or against a stationary object (the victim is
in motion) 7,7 1 086 10,4 3 082 9,6 4 168 40 Struck by object in motion, collision with
9,4 1 323 16,7 4 926 14,3 6 249 50 Contact with sharp, pointed, rough, coarse Material Agent
7,9 1 116 11,1 3 282 10,1 4 398 60 Trapped, crushed, etc.
25,2 3 544 23,1 6 808 23,8 10 352 70 Physical or mental stress
4,6 642 1,2 353 2,3 995 80 Bite, kick, etc. (animal or human)
5,9 825 4,1 1 196 4,6 2 021 99 Other Contacts – Modes of Injury not listed in above
1,5 212 1,4 406 1,4 618 00 No information
In one-third of wage and salary earners’ accidents at work - in 33.8 per cent among men and in 38.7 per cent among women - the direct material agent of the injury was diverse scaffolding, surfaces and planes. Various materials, objects and supplies injured nearly one quarter of the victims of accidents at work (Table 6).
The data on the material agent of contact describes the physical factor with which the injured body part was in contact. When several modes are in question those filling in the accident notification form are asked to report the material agent of the most serious injury.
Table 6. Wage and salary earners' accidents at work by gender and material agent of contact -mode of injury in 2012
Females Males
Total Material Agent of Contact-Mode of injury (FAII)1)
% N % N % N 100 14 059 100 29 517 100 43 576 Total 38,7 5 437 33,8 9 993 35,4 15 430 1100-1399 Scaffolding, surfaces and planes
8,9 1 251 19,3 5 735 16,1 6 986 2100-2799 Tools, machines and equipment
4,7 670 4,5 1 331 4,6 2 001 2801-2899 Conveying, transport and storage
equipment 1,6 217 3,5 1 040 2,9 1 257 3100, 3200 Transport equipment
19,0 2 674 24,8 7 316 22,9 9 990 4100-4400 Materials, objects and supplies
15,0 2 114 3,0 897 6,9 3 011 5100 Living organisms and human-beings
0,4 51 0,6 170 0,5 211 5200 Bulk waste
1,1 148 1,0 294 1,0 442 5300 Noise, pressure, fire, light arcs, light, snow, stretches of water
7,8 1 103 6,5 1 922 6,9 3 025 9999 Other material agents not listed above
2,8 394 2,8 819 2,8 1 213 0000 No information
The classification of the variables is national (FAII = Federation of Accident Insurance Institutions). 1)
The classification describing the material agent is national for accident data on wage and salary earners. The classification is considerably more detailed than before. Two things should be kept in mind when examining the results. Firstly, the occurrence of an accident at work is usually a sum of many factors and no individual material agent can always be identified unambiguously. However, the variable data show what kind of equipment or tools the victim was using or in what kind of working environment the accident occurred. Secondly, inadequate guidance or inexperience on the part of the worker can often play a major role in the occurrence of an accident. It is difficult and often impossible to produce statistics on such factors.
Four out of ten injuries (44.2%) caused by accidents at work are dislocations, sprains or strains (Table 7). The next most common were wounds and superficial injuries (25.1%) and various concussions and internal injuries (14.9%). Men’s accidents caused relatively more often various wounds and superficial injuries, while women’s accidents caused dislocations, sprains and strains. This is concordant with the results presented above, which showed that men more often than women injure themselves in accidents at work in connection with sharp objects whereas women more than men injure themselves by stumbling or slipping.
Table 7. Wage and salary earners’ accidents at work by gender and type of injury in 2012
Females Males
Total Type of Injury (ESAW)
% N % N % N 100 14 059 100 29 517 100 43 576 Total 20,6 2 892 27,2 8 024 25,1 10 916 010 Wounds and superficial injuries
9,5 1 341 10,6 3 143 10,3 4 484 020 Bone fractures
48,5 6 823 42,2 12 449 44,2 19 272 030 Dislocations, sprains and strains
0,1 19 0,6 163 0,4 182 040 Traumatic amputations (Loss of body
parts) 15,2 2 135 14,8 4 379 14,9 6 514 050 Concussions and internal injuries
2,7 383 1,9 547 2,1 930 060 Burns, scalds and frostbites
0,2 32 0,3 82 0,3 114 070 Poisonings and infections
—1) —1) 0,0 1 0,0 1 080 Drowning and asphyxiations
0,0 1 0,1 15 0,0 16 090 Effects of sound, vibration and pressure
0,0 2 0,0 10 0,0 12 100 Effects of temperature extremes, light
and radiation 0,2 33 0,2 52 0,2 85 110 Shocks 0,5 73 0,3 94 0,4 167 120 Multiple injuries
0,7 102 0,5 148 0,6 250 999 Other specified injuries not included
under other headings
1,6 223 1,4 410 1,5 633 000 No information
No cases. 1)
More than four out of ten accidents at work (43.4%) involved upper extremities (Table 8). Nearly 30 per cent (29.9%) injure lower extremities, including hips, thighs, knees, shins and ankles.
Table 8. Wage and salary earners' accidents at work by gender and injured body part in 2012
Females Males
Total Part of Body Injured (ESAW)
% N % N % N 100 14 059 100 29 517 100 43 576 Total 3,2 450 4,1 1 201 3,8 1 651 10 Head 1,3 184 1,1 320 1,2 504 20 Neck 15,3 2 153 12,8 3 765 13,6 5 918 30 Back, spine
3,9 548 5,5 1 628 5,0 2 176 40 Torso, internal organs
40,4 5 682 44,8 13 212 43,4 18 894 50 Upper extremities
31,2 4 390 29,3 8 640 29,9 13 030 60 Lower extremities
3,9 542 2,1 610 2,6 1 152 70 Whole body or multiple sites
0,4 60 0,2 51 0,3 111 99 Others 0,4 50 0,3 90 0,3 140 00 No information
Average duration of absence from work 12 days
The seriousness of accidents at work can be assessed on the basis of the duration of disability resulting from the injury. The figures describing the length of absence from work before 2002 are not fully comparable with the figures for 2002 to 2012, because it was not earlier possible to separate the cases leading to the employment accident pension. The cases leading to the employment accident pension are always serious, but in some of the cases the recorded number of days absent may have been low before the decision on the pension was granted. Now pension cases are excluded from the examination of the duration of disability.
The average duration of an absence from work due to an accident at work was 12 days (11.9) in 2012. The average duration of disability was 13.5 days for men and 9.0 days for women. The average duration
of absence caused by accidents increases with age for both men and women (Figure 6). Included are also accidents at work leading to a disability lasting under four days.
Figure 6. Average duration of disability caused by wage and salary earners’ accidents at work by gender and age in 2012
Two-third (30.0%) of all accidents leading to disability of at least four days caused disability of four to six days. In all, 18.7 per cent of the accidents at work – including employment accident pension cases – were serious, causing absences of more than 30 days (Table 9).
Table 9. Wage and salary earners’ accidents at work by gender and length of disability in 2012
Females Males
Total Lenght of disability - days
% N % N % N
100 14 059 100 29 517 100 43 576 Total
32,6 4 581 28,7 8 483 30,0 13 064 4–6 days
34,6 4 859 34,6 10 221 34,6 15 080 7–14 days
16,2 2 281 17,0 5 011 16,7 7 292 15–30 days
12,1 1 700 13,4 3 944 13,0 5 644 31–90 days
2,9 412 3,7 1 082 3,4 1 494 91–182 days
1,5 205 2,1 627 1,9 832 183–365 days
0,1 21 0,5 149 0,4 170 Employment accident pension
Risk of commuting accidents grew clearly
In 2012, wage and salary earners had a total of 22,296 commuting accidents for which insurance companies paid compensation. In the statistics, commuting accidents are separated from accidents at work and accidents while in work traffic. A commuting accident means an accident on the journey between home and work. Due to incomplete information in claims forms, some commuting accidents are in practice recorded as accidents at work and vice versa.
The number of commuting accidents resulting in disability of at least four days fell slightly (-6.3%) from 2011. The number of fatal commuting accidents went down by nearly one quarter (-23.8%). In 2012, 16 wage and salary earners died on the way to or from work. In 2011, the corresponding figure was 21. In 2010, the respective figure was 18 and fatal commuting accidents numbered 11 in 2009. Thus, the number
of commuting accidents varies greatly by year. The long-term development in the number of commuting accidents is examined in more detail in Appendix table 4.
Commuting accidents differ from accidents at work in that they are more common among women than men: nearly two-thirds (67.7%) of all commuting accidents occurred to women. By contrast, fatal commuting accidents occurred to men (10) more often than to women (6).
The accident incidence rate of commuting accidents fell slightly (-6.3%) from the previous year. In 2012, there were 447 commuting accidents per 100,000 wage and salary earners. In 2011, the corresponding figure was 477. Women had 581 (621 in 2011) and men 306 (327 in 2011) commuting accidents per 100,000 wage and salary earners. Like the number of fatal commuting accidents, the accident incidence rate of commuting accidents varies clearly by year.
The difference between men and women stays the same when looking at the accident incidence rates in different age groups (Figure 7). Both men’s and women’s risk of commuting accidents increases with age, but women’s risk is still higher than men’s in all age groups. The risk of getting injured on the way to or from work is nearly three-fold among women aged 55 to 64 in comparison with the youngest age group. The relative difference between men and women is also biggest in the oldest age group.
Figure 7. Wage and salary earners’ commuting accidents per 100,000 wage and salary earners by gender and age in 2012
Most commuting accidents occur when walking or cycling: more than six out of ten (66%) of those injured in commuting accidents were walking and nearly one-fifth (19%) were cycling when injured. When comparing men and women by mode of transport there were no great differences in commuting accidents: women were slightly more often injured when walking than men, whereas slightly more of men's than women's accidents occurred when cycling (Figure 8). It is not possible to take into account in the statistics the differences between women and men in their frequency of using a bicycle or a car on the journey between home and work.
Figure 8. Wage and salary earners’ commuting accidents by mode of travel and gender in 2012
When considering the modes of travel it is natural that the most common type of accident is falling, slipping or stumbling. In 2012, four-fifths (79.8%) of all commuting accidents resulted from falling or slipping. The second most common type (9.7%) of accident is ’collision with a car’ (Table 10).
Table 10. Wage and salary earners’ commuting accidents by gender and type of accident in 2012
Females Males
Total Type of accident
% N % N % N
100 6 352 100 3 180 100 9 532 Total
81,6 5 185 76,1 2 421 79,8 7 606 Falling, slipping or stumbling
0,5 32 0,5 15 0,5 47 Stepping on objects
4,2 267 6,8 216 5,1 483 Driving off the road or car falling over
8,8 556 11,5 365 9,7 921 Collision with a car
1,2 75 1,4 44 1,2 119 Collision with a bicycle, moped, etc.
0,0 2 0,0 1 0,0 3 Collision with a track-going vehicle
0,2 12 0,3 10 0,2 22 Violence
3,5 223 3,4 108 3,5 331 Others
Most of the injuries sustained in commuting accidents were minor, often caused by falling. In more than four cases out of ten (45.9%), the victim’s injuries were various dislocations of joints, sprains and strains (Table 11). The injured body parts were often the extremities (Table 12).
Table 11. Wage and salary earners’ commuting accidents by gender and type of injury in 2012
Females Males
Total Type of Injury (ESAW)
% N % N % N 100 6 352 100 3 180 100 9532 Total 9,5 601 9,2 292 9,4 893 010 Wounds and superficial injuries
20,4 1 295 20,7 658 20,5 1 953 020 Bone fractures
45,1 2 866 47,4 1 507 45,9 4 373 030 Dislocations, sprains and strains
0,0 1 0,1 3 0,0 4 040 Traumatic amputations (Loss of body parts) 20,4 1 293 18,6 590 19,8 1 883 050 Concussions and internal injuries
0,0 2 0,1 2 0,0 4 060 Burns, scalds and frostbites
0,0 1 0,0 1 0,0 2 070 Poisonings and infections
–1) –1) 0,0 1 0,0 1 110 Shocks 0,1 4 0,1 4 0,1 8 120 Multiple injuries
1,8 117 1,1 36 1,6 153 999 Other specified injuries not included under other headings
2,3 147 2,4 75 2,3 222 000 No information
No cases. 1)
Table 12. Wage and salary earners’ commuting accidents by gender and injured body part in 2012
Females Males
Total Part of Body Injured (ESAW)
% N % N % N 100 6 751 100 3 427 100 10 178 Total 3,4 216 3,7 119 3,5 335 10 Head 5,4 346 5,1 163 5,3 509 20 Neck 8,4 534 9,8 313 8,9 847 30 Back, spine
5,4 345 9,7 310 6,9 655 40 Torso, internal organs
30,9 1 962 29,2 928 30,3 2 890 50 Upper extremities
36,5 2 316 34,2 1 089 35,7 3 405 60 Lower extremities
9,2 582 7,0 222 8,4 804 70 Whole body or multiple sitess
0,1 9 0,1 3 0,1 12 99 Others 0,7 42 1,0 33 0,8 75 00 Data missing
Self-employed persons’ accidents at work
This section focuses on the accidents at work among farmers and other self-employed persons. Self-employed persons’ (excl. farmers) accidents at work were separated in the occupational accident statistics from wage and salary earners’ accidents at work for the first time in 1995. Before that, self-employed persons’ accidents were included as such in wage and salary earners’ accidents at work. When examining the figures on self-employed persons’ accidents at work it must be noted that accident insurance is voluntary for self-employed persons, and not all of them are insured. Therefore, the distribution of self-employed persons’ accidents at work according to different background variables (age, occupation, industry) also illustrates in which occupations and sectors self-employed persons are insured more than usual.
In Finland, most farmers live on their farms, which makes it impossible to make a distinction between accidents at work and commuting accidents. In this publication all accidents occurring to farmers in their work are called accidents at work. The data on farmers' accidents at work are based on the information obtained from the Farmers’ Social Insurance Institution (MELA).
Apart from a full-time and working age farmer, the insured can be a pensioner, an under 18-year-old family member or a person practising part-time agriculture, game or reindeer husbandry or fishery. The number
of farmers has been falling steadily in recent years. At the end of 2012, there were 73,334 farmers insured by the Farmers’ Social Insurance Institution, which is about 2,600 fewer than one year previously and over 38,000 fewer than in 1999.
Farmers’ accidents at work decreased
The changes in the numbers of farmers are also visible in the numbers of accidents at work. In 2012, MELA paid compensation for 4,554 occupational accidents of farmers. There were a total of 3,698 occupational accidents leading to disability of at least four days, while in the previous year the respective figure was 3,861 (-4.2%). The number of farmers’ accidents at work has been falling almost throughout the past ten years, the year 2005 excluded (Figure 9). The accident peak in 2005 could in part be the result of the introduction that year of the full-cost responsibility system of patient care.
Figure 9. Farmers’ non-fatal accidents at work resulting in at least 4 days’ absence in 2000–2012
Farmers' risk of death at work diminished clearly
Of all the farmers' accidents at work for which compensation was paid in 2012 seven were fatal, where as in the previous year four farmers died in consequence of an accident at work. All fatal deaths at work occurred to men. Of all the farmers' fatal accidents at work in 2000 to 2012 only one occurred to a woman. Figure 10 presents the accident incidence rates of farmers from 2000 to 2012 with regard to deaths at work and accidents leading to disability of at least four days. The figure shows that the risk of death at work varies strongly in different years. In 2012, 9.4 per 100,000 insured farmers died, while in 2011 the corresponding ratio was 5.2. In 2010, the corresponding ratio was 7.5 and in 2009 it was 4.8. The year 2000 was the darkest in the near past; a total of 12.9 per 100,000 insured farmers died in accidents at work. An examination of the time series reveals that farmers’ risk of fatal accidents at work has fallen by around eight per cent during the 2003 to 2012 period. This becomes clear if we compare two five-year periods with each other. In the 2003 to 2007 period, farmers had 35 fatal accidents at work, which is an average of 7.6 per 100,000 farmers per year. In the 2008 to 2012 period, a total of 28 farmers died accidents at work, which converts to an annual average of 7.0 fatal accidents per 100,000 farmers.
Figure 10. Farmers’ accident rates in 2000 to 2012
Table 13 compares the incidence rate of accidents leading to the death of the farmer with the riskiest industries among wage and salary earners in 2012. Because the majority of persons who die as the result of accidents at work are generally men, their accident incidence rates are given separately. The figures indicate that male farmers' work was the most dangerous. Of them, a total of 14.0 per 100,000 insured farmers died in accidents at work in 2012. In 2011, the corresponding figure was 7.8.
In 2012, the second most risky industry was construction for wage and salary earners. In this industry the risk of death at work was 5.3 (for men 5.8) per 100,000 insured wage and salary earners. In 2011, the respective figures were 3.0 and 3.3. Then the riskiest industry was transportation and storage (8.1).
Table 13. Farmer’s fatal accidents at work compared with wage and salary earner’s fatal accidents in high risk industry per 100,000 farmers or wage and salary earners in 2011 to 2012
2012 2011
Males Total Males Total
14,0 9,4 7,8 5,2 Farmers
2,8 1,5 2,5 1,2 Wage and salary earners
2,0 1,5 0,4 0,3 Manufacturing
5,8 5,3 3,3 3,0 Construction
5,4 5,0 10,6 8,1 Transportation and storage
The data by industry are based on the revised Standard Industrial Classification TOL 2008 which was adopted in the Statistics on Accidents at Work in the statistical reference year 2008. The data classified by the revised industrial classification are not comparable with those produced by its predecessor TOL 2002 (this applies to data from reference year 2007 and prior to it) 1)
Among farmers, the proportion of minor accidents at work resulting in disability of less than four days has stayed roughly on level in recent years at slightly under one-fifth of all compensated accidents (Table on page 1 of the publication). Nearly every third (32.4%) accident at work was a so-called serious accident, i.e. they caused a disability lasting longer than one month (Appendix table 5). In the following, the focus will be on those accidents at work that resulted in absence of at least four days from work.
Farmers’ risk of accidents increases with age
In 2012, there were 5,008 occupational accidents per 100,000 insured farmers, which is slightly fewer (-0.8%) than in 2011 (5,048). Farmers’ risk of accidents is still clearly higher than that of wage and salary earners and distinctly higher for men than for women: men had 5,694 and women 3,615 accidents at work per 100,000 insured farmers (Figure 11). The difference between the genders is partly explained by the
fact that in farming men conventionally do the kind of work in which accidents are common. Such work includes construction work and tasks related to the use and maintenance of machinery and equipment.
Figure 11. Farmers’ accident at work per 100,000 insured by gender and age in 2012
More than six out of ten (65.0%) of farmers' accidents occur to those aged 45 or over. In 2012, the number of accidents was relatively highest in the age groups of those aged 55 or over: 4,915 per 100,000 farmers. The corresponding ratio for persons aged under 25 was 3,822 in 2012.
Most accidents occur in animal husbandry
The proportion of accidents occurring in various animal husbandry tasks was about the same as one year previously, or good four in ten (43.1%) of all accidents at work (Table 14). Especially women fell victims to accidents at work when tending cattle, as three fourths (75.4%) of women’s accidents at work took place in animal husbandry. Among men, the respective proportion was around one-third (33.0%). The second highest number (24.6%) of accidents occurred in other agricultural and forestry work, including tasks such as installation and maintenance of machinery and equipment. Approximately one sixth (14.3%) of accidents at work occurred while performing other tasks related to farming. However, no actual conclusions can be drawn from the available statistical data about the dangerousness of work in different areas, because then the number of working hours spent on different tasks should also be known. The classification of the variables describing the stage of work is national. The classification used by MELA is more detailed than the ESAW variable illustrating the working process (cf. Table 2).
Table 14. Farmers’ accidents at work by type of work and gender in 2012
Females Males
Total
% N % N % N
100 881 100 2 817 100 3 698 Total
7,6 67 16,3 460 14,3 527 Farming work
75,4 664 33,0 931 43,1 1 595 Animal husbandry
3,0 26 11,9 336 9,8 362 Forest work
1,2 11 5,6 157 4,5 168 Construction work
11,9 105 28,6 806 24,6 911 Other agricultural and forestry work
0,9 8 4,5 127 3,6 135 Other work
Farmers most often injured as a consequence of horizontal or vertical impact with or
against a stationary object
Horizontal or vertical impact with or against a stationary object was the most common mode of injury for farmers. In three cases out of ten (32%) the person was injured due to horizontal or vertical impact with or against the floor, ground or the like (Figure 12). Women farmers were pushed or kicked by an animal more often than men, as every fourth (25%) of women farmers’ accidents was caused by an animal. Every tenth (10%) man injured in an accident was hurt by an animal bite, kick or the like.
The Farmers’ Social Insurance Institution collects data on the material agent, type of injury and injured body part using the ESAW classification.
Figure 12. Farmers’ accidents at work by contact-mode of injury (ESAW) and gender in 2012
In more than one-quarter (27.5%) of farmers’ accidents at work the material agent was an animal or a human-being, or the injury was caused by a plant (Figure 13). In all probability most of these farmers' accidents were expressly caused by animals. Various buildings, structures and surfaces were the material agents in every fifth accident (21.4%). The third most common material agent was noise, pressure, fire, light arcs, light, snow or stretches of water (7.8%).
Figure 13. Farmer’s accidents by material agent of contact-mode of injury in 2012
In 2012, a total of 38 per cent of farmers’ injuries sustained in accidents at work were various kinds of dislocations, sprains and strains. Wounds and superficial injuries form another big group of injuries (34%). Seventeen per cent of all injuries to farmers were bone fractures. There were no significant differences in the distributions of men’s and women’s injuries: men’s injuries were more often wounds and superficial injuries, while women’s injuries were different kinds of sprains and strains (Figure 14).
Figure 14. Farmers’ accidents at work by type of injury (ESAW) and gender in 2012
About seven out of ten (72%) of all the accidents at work which occurred to farmers concerned extremities (Figure 15). Women injured their lower extremities more often than men did. Injuries to lower extremities most often involved knees and those to upper extremities palms or fingers.
Figure 15. Farmers’ accidents at work by injured body part (ESAW) and gender in 2012
Self-employed persons most often injured in construction and in transportation and
storage industries
In 2012, insurance companies paid self-employed persons compensation for a total of 6,100 accidents at work. This also includes accidents on which compensation was paid only for medical treatment expenses. The proportion of these accidents at work that led to absence from work for less than four days was about 45 per cent of all self-employed persons’ accidents. One year previously compensation was paid for 6,229 accidents. The data concern self-employed persons other than farmers.
In 2012, self-employed persons had 3,346 accidents at work that led to disability of at least four days. This is 74 cases fewer than in the previous year. The gender distribution of accidents at work is the same among self-employed persons as among wage and salary earners: the vast majority (76%) of the accidents of self-employed persons occurred to men. The age distribution of victims of accidents at work show that nearly two-thirds (64.9%) of self-employed persons’ accidents occurred in the 45 to 54 age group (Table 15).
Table 15. Self-employed persons’ accidents at work by gender and age in 2012
Females Males
Total Age
% N % N % N
100 881 100 2 817 100 3 698 Total
1,0 9 1,3 37 1,2 46
7,9 70 7,9 223 7,9 293
23,6 208 18,3 516 19,6 724
37,5 330 35,7 1 006 36,1 1 336
25,3 223 29,9 843 28,8 1 066
4,7 41 6,8 192 6,3 233 Others
Examined by industry, self-employer persons’ risk industries are mostly the same as those of wage and salary earners. The most dangerous industries are construction, and transportation and storage. The variables describing the causes and consequences of self-employed persons’ accidents are examined more closely in Appendix tables 6 to 9.
Quality Description: Accidents at Work Statistics
1. Relevance of statistical information
1.1 Contents and purpose of statistical information
Accidents at Work statistics contain statistical information on employment and commuting accidents involving wage and salary earners, farmers and other self-employed persons or entrepreneurs.
The information in the Accidents at Work statistics has been obtained by combining register data compiled in connection with occupational accidents insurance and the data of Statistics Finland. Information on accidents involving wage and salary earners and self-employed persons were obtained from the Federation of Accident Insurance Institutions (FAII). The details on accidents involving farmers are based on information collected by the Farmers' Social Insurance Institution (MELA). The information of Statistics Finland’s Labour Force Survey (TYTI) and Employment Statistics has also been used in compiling the statistics.
In the statistics, accidents at work are accidents for which insurance companies have paid compensation. The statistics mainly cover accidents at work of the latest statistical reference year, but in addition, various time series also shed light on changes in the occupational accidents situation during the 1990s and 2000s.
1.2 Definitions of concepts used in the accidents at work statistics
Accident at Work
An accident at work is defined in Section 4 of the Employment Accidents Act. An accident at work means any accident causing injury or illness sustained by the employee in the course of his/her employment or in circumstances arising from employment. According to the Act, accidents at work can be divided according to the place where the accident occurs as follows:
• An accident at work has occurred at work or in work-related circumstances. In this case, traffic accidents that occur during work are also defined as accident at work.
• As for commuting accidents, these are accidents that have occurred outside the actual working time while commuting from the employee’s residence to work or vice versa.
In the statistics, accidents are categorised according to their severity as follows: accidents at work leading to death and accidents at work leading to at least four days of disability or under four days of disability (so-called minor incidents). The statistics almost exclusively cover accidents at work leading to at least four days of disability.
Accident incidence rate and accident frequency
The different types of accident risks in different industries or occupational and other groups can be established by calculating the ratio between the number of accidents that occur and the number of employees in each industry, or the number of working hours. When the ratios between accidents and the number of employees and working hours are established, these ratios can be considered the “risk figures” of certain occupations or industries. In practice, the susceptibility to accidents varies within an industry, for instance, according to work tasks.
•Theaccident incidence ratemeans the ratio of the number of employees to the accidents that occurred. In accidents that lead to at least four days of disability, the ratio was calculated per 100,000 employees and in fatal accidents per 100,000 employees.
•The accident frequencymeans the ratio of the number of hours worked to the accidents that occurred. The ratio is calculated for 1,000,000 working hours. The frequency is mainly used in comparisons between different industries.
Information on the number of employees and working hours in different industries and occupations is obtained from Statistics Finland’s Labour Force Survey.
Occupation
Occupation means an activity or work which constituted the injured party’s principal livelihood at the time of the accident. Occupations have been divided into categories on grounds of similar activities, so that education, status in occupation, position or industry does not have an effect on the classification of occupations. Occupations have been categorised by insurance institutions. The insurance institution classification differs slightly from that of Statistics Finland, but for the purposes of this publication, the classification has been harmonised with the one used by Statistics Finland (Statistics Finland: Classification of Occupations 1987).
If the injured party has held several positions, the most dangerous position has been classified as his/her occupation on the grounds of previous information.
The used classification of occupations has a 3-digit structure, but in most tables of the publication, a classification with a 1 or 2-digit structure has been used for the purposes of data protection and reliability. By using a detailed classification, it is possible to identify occupational groups where the risk of an occupational accident is exceptionally high. However, the detailed classification also has its drawbacks: due to the small number of observations in the Labour Force Survey sample, there is some uncertainty related to the calculated accident incidence rates of small occupational groups. The accident incidence rates have only been calculated for occupational categories that have had at least five accidents and 10,000 employees according to the Labour Force Survey sample. It is considered unreliable to calculate an accident incidence rate for a smaller group.
Industry
The classification used in the publication is based on Statistics Finland's Standard Industrial Classification of 2008 (Standard Industrial Classification TOL2008, Handbooks 4, Statistics Finland). The Standard Industrial Classification is a grouping system for companies and equivalent units and establishments with economic activities. The injured party’s industry is classified according to the main object of production or type of activity of his/her establishment.
The injured party’s industry has been classified by insurance institutions. There may be some uncertainty related to the industry classification, mainly due to the difficulty of classifying multifunctional companies with a single insurance. Accidents occurring in such multifunctional companies fall in the same category regardless of the nature of the activities.
Some municipalities only take out a single insurance on their employees although they employ individuals from several different industries. For this reason, the occupational accidents suffered by the employees of these municipalities fall in the category of the general central government sector.
In the statistics, the Standard Industrial Classification has been used either on the 1 or 2-digit level. The goal was to achieve the most detailed classification in the industries where the number of accidents known to have occurred was greater than average.
ESAW variables (joint European data) Workstation
The variable describes whether the accident victim was working at a workstation managed by his/her own employer or at a workstation owned or controlled by a party other than his/her employer.
Working process
The working process describes the accident victim’s working phase at the time of the accident. However, the working process does not refer to an occupation.
Specific physical activity
The specific physical activity describes the accident victim’s actual activities before the accident. Information on this variable specifies the details of the work task with regard to the events preceding the accident.
Deviation
Contact - mode of injury
The mode of injury describes the way in which the injured body part came into contact with the object that caused the injury.
Material agent of the contact
The material agent of the contact refers to information on the material object with which the injured body part came into contact at the time of the accident.
Part of body injured
The part of body injured refers to the main body part injured in the accident.
Type of injury
The type of injury describes the nature of the physical injury caused by the occupational accident. The information on the type of injury is based either on medical diagnosis or on the description in the accident report.
2. Methodological description of the statistical survey
2.1 Statistical population
The data of the accidents at work statistics, which are part of the Official Statistics of Finland series, have been obtained from several different sources. The Federation of Accident Insurance Institutions (FAII) provides Statistics Finland with the information on accidents to wage and salary earners and self-employed persons, whereas the information on farmers is obtained from the Farmer’s Social Insurance Institution (MELA). In addition, the data of Statistics Finland’s Employment statistics and the Labour Force Survey are used to compile the statistics.
The data of the Federation of Accident Insurance Institutions
The information on accidents involving wage and salary earners and self-employed persons (excl. farmers) is based on the data obtained from the Federation of Accident Insurance Institutions (FAII) in which the individual accident is used as an observation unit. The data include all accidents that occurred between January 1 and December 31 for which insurance companies have paid compensation. The data contain demographic information on the injured party (age, sex) and diverse information on the circumstances of the accident, and the cause and the consequences of the accident. The data content became increasingly versatile when the collection of data conforming to the joint European variable list began in 2003 in connection with the implementation of Eurostat’s new European Statistics on Accidents at Work (ESAW) methodology.
The data on accidents involving wage and salary earners and self-employed persons (excl. farmers) were originally obtained from accident report forms used by employers to inform insurance companies of accidents to their employees. The same forms are used to inform insurance companies of occupational diseases, but in Finland, statistics on occupational diseases and occupational accidents are compiled separately. The Finnish Institute of Occupational Health annually compiles a set of statistics on occupational diseases which is part of the Official Statistics of Finland (OSF) series.
The information is supplemented during the compensation procedures, but final information cannot be expected during the compilation of the statistics. The statistical data (mainly the period of disability) are updated almost 1.5 years after the end of the year following the accident. This means for instance that the information in the data for the 2010 statistics has been supplemented until early 2012. The relatively long period is required to ensure the sufficient reliability of the data.
The data of the Farmers' Social Insurance Institution
The information on accidents involving farmers is based on the comprehensive individual-level total data provided to Statistics Finland by the Farmers' Social Insurance Institution. These data contain information on all occupational accidents for which the MELA has paid compensation.
The basic acts on farmers’ accident insurance are included in the Farmers' Accident Insurance Act. The compulsory insurance covers farmers aged 18 to 64 years who reside in Finland. A farmer is an individual involved in agricultural activities on a farm of at least five hectares on his/her own or joint account, as a member of a family business or as a self-employed person's cohabitant. Fishermen involved in professional fishing activities without an employment relationship or as family members are also considered farmers. Reindeer rearers involved in reindeer husbandry on their own account, or who are employed by a family member or a married couple, and persons involved in reindeer husbandry as a reindeer owner’s family members, are also considered farmers.
The definition of “accident” used in the statistics corresponds to the definition of accidents involving other self-employed persons and wage and salary earners. Farmers involved in regular agricultural activities but who are excluded from compulsory insurance due to their age or their small labour input may take out an optional accident insurance policy. The content of the data is largely equivalent to the data compiled by the FAII. For some variables, the MELA classification is more detailed than that of the FAII data.
The data of Statistics Finland
Statistics Finland’s Employment statistics have also been used to compile the statistics: information on accident victims’ level of education has been collected from these statistics by using social security numbers. Statistics Finland annually compiles the Employment statistics, whose main purpose is to provide regional information on the population’s economical activities. Information on the number of employees and labour input (hours worked) has been obtained from Statistics Finland’s Labour Force Survey. The survey illustrates the employment of the entire population aged 15 to 64. The Labour Force Survey’s average annual data are used to compile the statistics.
3. Correctness and accuracy of data
3.1 The reliability of the data
In Finland, private insurance companies are in charge of accident insurance. The Federation of Accident Insurance Institutions (FAII) is the central body of the statutory accident insurance whose main purpose is to coordinate the implementation of statutory accident insurance. In Finland, insurance companies that provide statutory accident insurance must be members of the FAII.
For work done for the employer, the employer must take out an obligatory accident insurance policy in accordance with the Accident Insurance Act (608/48) at an insurance company licensed to issue accident insurance policies. However, the employer’s obligation to take out insurance does not begin until the work done for the employer during a calendar year exceeds 12 days. The obligation to take out insurance does not concern State officials or individuals with a working relationship with the State. However, the State must pay them compensation from State resources for occupational accidents and occupational diseases in accordance with the Accident Insurance Act.
As for accidents involving wage and salary earners, the statistical coverage is good, since all employees are in practice covered by the accident compensation. Accident reporting is not neglected, since reporting accidents is financially profitable to the employer. Coverage is also affected by the employer’s choice of either a compulsory or fully comprehensive insurance. The fully comprehensive insurance does not include the employer’s contribution. The information on accidents involving central government sector wage and salary earners has been obtained from the FAII. As for the information on accidents involving State employees, this was originally obtained from the State Treasury, but Statistics Finland can also acquire it through the FAII.
The insurance is optional for self-employed persons except for farmers, who must take out a compulsory insurance policy at the Farmer’s Social Insurance Institution (MELA) if the size of the farm exceeds five hectares. Fishermen and reindeer rearers must also take out an insurance policy at the MELA. For this reason, all occupational accidents involving self-employed persons mentioned above are comprehensively included in the statistics. The MELA has a national network of agents who transmit accident information to the MELA. As for other self-employed persons, they may take out optional insurance policies.
Approximately 41 to 42 per cent of self-employed persons other than farmers have taken out an optional accident insurance policy.
In 2011, accident data was collected according to the ESAW variables for the ninth time. Compared with the previous years, the distributions seem uniform and reasonable. In addition, the variables describing the chain of events leading to an accident are similar. With increasing experience, however, adjustments may be made to the recording instructions. Over the years to come, this may have some effect on the results related to the ESAW variables that were obtained from the data.
Information on occupational accidents is collected by using accident report forms. Accident reporting is usually not neglected, since fulfilling the reporting obligation is financially profitable to the employer. The MELA data are probably more reliable than those of the FAII, since the employees recording the statistics are also in charge of the compensation procedures. The reliability of the data is also improved by the fact that the MELA agents act as intermediaries in filling in and submitting compensation applications.
4. Timeliness and promptness of published data
4.1 The frequency and the assessment period of the statistics
The accidents at work statistics data are completed with the delay of “n+1 years”, where n refers to the statistical year. For instance, the data on the accidents at work of 2011 are completed at the beginning of 2013. However, the data are not final at the completion: due to compensation procedures, they will be complemented with a few cases even after having been submitted to Statistics Finland. Since the breaking point is the same every year, statistical years are comparable, unless other, e.g. legislative changes affecting the compensation practices have occurred.
The relatively long delay is indispensable due to the final information on consequences. Information on consequences means the duration of disability due to an injury or the number of days absent from work. The long delay ensures sufficient reliability of the data.
According to the Accident Insurance Act, daily benefits are paid if the injured individual is fully or partially incapacitated for at least three consecutive days, excluding the day of the accident.
5. Accessibility and transparency/clarity of data
Since the statistical reference year 2005, the accidents at work statistics are only published online. The online publication and database tables on the statistics are available at:
http://tilastokeskus.fi/til/ttap/index_en.html.
The Working conditions research and adult education statistics unit of the Social Statistics Department are in charge of the publication of the accidents at work statistics. The persons responsible for the statistics are Arto Miettinen ([email protected]) and Tarja Seppänen ([email protected]).
6. Comparability of statistics
6.1 Additional information on accidents at work and occupational diseases
Other parties also provide information on accidents at work and occupational diseases:
The Federation of Accident Insurance Institutions (FAII)
The FAII annually publishes its own statistics on accidents at work and diseases for which compensation has been paid. The statistics are available in print and online. In addition, the FAII publishes on its website cross-sectional statistics that compare two time periods. In these statistics, the accidents at work figures are not final. The statistics can be used to examine the tendency in the number of accidents. The statistical data published by the FAII and Statistics Finland are based on the same source data, but the principles for
statistics compilation differ. Since 2005, both Statistics Finland and the FAII have defined an accidents at work as disability for at least four days. This is the definition used in the Eurostat accidents at work statistics. The statistics published by the FAII do not include accidents involving self-employed persons. Both the FAII and Statistics Finland have a separate category for the central government sector.
The FAII also publishes survey reports on accidents at work leading to death which are based on the fatal workplace accident investigation system (TOT).
The Farmer’s Social Insurance Institution
The Farmer’s Social Insurance Institution publishes its own statistics on accidents at work involving farmers.
The Finnish Institute of Occupational Health
Since 1964, the Finnish Institute of Occupational Health has maintained a register of work-related diseases (formerly the occupational diseases register). The register includes information on new occupational diseases reported to insurance companies and on new occupational diseases reported to labour protection authorities by physicians, and on other work-related pathological conditions. The Finnish Institute of Occupational Health annually publishes a set of statistics on diagnosed occupational diseases. The Finnish Institute of Occupational Health also releases accidents at work statistics in which central government sector accidents at work are included according to occupation.
Eurostat
The Statistical Office of the European Communities (Eurostat) annually publishes information on accidents at work in the European Union Member States (European Statistics on Accidents at Work, ESAW).
Miscellaneous
The Labour Protection Department of the Ministry of Social Affairs and Health maintains an accident report register which contains data on accidents at work leading to severe injuries or death from 1982 onwards. The documents report on the course of the accident, the direct and indirect reasons for the accident and the possibility of preventing similar accidents in the future. Since 1985, investigated work and workplace accidents leading to death have been included in the register as a result of an agreement between the Federation of Accident Insurance Institutions (FAII) and the central labour market organisations.
Information on accidents at work involving forest holders and wage and salary earners is available in the Forest Statistics Yearbook published by the Finnish Forest Research Institute.
6.2 Time series
The contents of the accidents at work statistics have not remained the same over the years, as the occupational accident statistics time series also includes the occupational diseases discovered between 1976 and 1994. However, commuting accidents were not included in the figures of this time period. This information has been collected since 1992.
Accidents at work involving self-employed persons have only been included in the statistics if the self-employed person has taken out an optional insurance policy. Approx. 41 to 42 per cent of self-employed persons currently have an occupational accident insurance policy (n = 125,000). Therefore, the number of accidents also reflects the popularity of insurance policies among self-employed persons. It can be estimated that individuals involved in high-risk jobs are more likely to take out an insurance policy than those whose line of work involves fewer risks. Between 1995 and 2010, the number of accidents at work involving self-employed persons has varied between 2,000 and 3,500 cases.
Since 1992, the accidents at work statistics have been compiled at Statistics Finland. Since the 2007 statistics reform, it has been possible to update reliably the time series on wage and salary earners' employment accidents until 1996. The accidents at work information on farmers can be obtained from 2000 onwards.