319
© Global Society of Scientific Research and Researchers http://asrjetsjournal.org/
Effect of Attack angle on Aerodynamics Analysis of
Different Wind Turbine Wings using Numerical
Simulation
Yin Yin Htay Aung
a*, Myat Myat Soe
b, Aung Myat Thu
c a,b,cMandalay Technological University (MTU), Patheingyi, Mandalay, MyanmaraEmail: [email protected] bEmail: [email protected]
b
Email: [email protected]
Abstract
In this research, the performance of two airfoils are compared by using Numerical analysis. There are so many dedicated airfoils to be used in various kinds of wind turbine blades. The lift coefficient and drag coefficient are the key parameters to determine the airfoil performance. The right choice of airfoil gives good performance in wind turbine blade design based on the available wind velocity, Reynold number, blade material. The author wants to compare the performance of 3D model two airfoils (SG 6043 and NACA 4412) for low Reynold number; less than 500,000 [1]. The numerical simulation is carried out by using Ansys-Fluent software. The lift and drag coefficients are compared based on different angle of attack 0º, 5º, 10º at wind velocity 10m/s, rated wind velocity for intended regions. The design chord length is 0.5m and width of the wing is 0.25m. The numerical results are compared with the results of Profili 2.0c software. By doing this simulation, understand their flow nature and the performance of two airfoil profiles is compared. Therefore, the suitable airfoil will be used in local horizontal axis wind turbine industries.
Keywords: Airfoil profiles; Lift and drag coefficient; Numerical analysis; 3D model.
--- * Corresponding author.
1.Introduction
Nowadays, great effort is used to find out the more and more renewable energy utilization due to the energy crisis and global warming. Wind energy is the one of the renewable energy. Wind turbines or wind mills extract wind kinetic energy and convert to useful energy form for human beings.
320
Wind turbine blade profile is the key to transfer wind kinetic energy to rotational mechanical energy. Standalone small wind turbine applications are mostly interested in electrical generation for remote areas. Due to small size and face to low wind velocity, special design dedicated low Reynolds number airfoils are needed. While the design and analysis of airfoils for Reynolds numbers above 500,000 can be accomplished with a high level of confidence that the resulting aerodynamics will be as predicted. Due to the dependency of airfoil performance at low Reynolds numbers on the location of the laminar separation bubble, the design philosophies of such airfoils are considerably different than those employed at higher Reynolds numbers [2].
Airfoil performance predictions are crucially needed in advance technologies of rotor design and power development. There are three different ways to analyze the airfoil nature; numerical, analytical, and experimental. Among them, numerical analysis based on Computational Fluid Dynamics (CFD) software reduce tidiness, time consuming, installation cost, etc. The numerical simulation analysis for the aerodynamics performance of wind turbine airfoils mainly concentrated in the influence of mesh density, turbulence model, leading edge roughness, airfoil camber and Reynolds number [3]. In CFD software, wind turbines are simulated under the turbulent flows. The turbulence model contains one or two equations model. The famous one equation model is Spalart-Allmaras and two equations is standard k-ε [4]. Many researchers do numerical simulations of 2D airfoils and 3D airfoil profile and blade to improve the wind turbine technologies. F. A. Najar and G. A. Harmain investigate that the CFD analysis of the flow over S809 wind turbine airfoil is investigated with k-ε, Spalart-Allmaras and Invicid model at different angle of attack. During investigation they observed maximum angle of attack for S809 and k-ε model pointed out the efficient results [5]. Also, 2D CFD-RANS simulations have been carried out at high Reynolds number (Re > 106) for the wind turbine blade profiles NACA 0008 and NACA 0012 by Hoogedoorn and his colleagues [6]. A. Gross and H. F. Fasel employed numerical simulations for investigating the low Reynolds number aerodynamics of four different airfoil sections. The numerical results are compared with XFoil predictions and wind tunnel data [7]. D. Hartwanger and A. Horvat carried out 2D blade sections analysis and the results used to construct and validate a 3D CFD model of the turbine. Then 3D results were used to develop estimates for actuator disk induction factors [8]. Two airfoils (NACA 4412 and SG 6043) which are similarly the same at leading edge portion and different at trailing edge portion. This action points out the duty of trailing edge. NACA 4 series airfoils are really intended for high Reynolds number and SG series for low Reynolds number. Aerodynamics performance is grate important in wind turbine blade design and the shape of airfoil influence the aerodynamics. This research points out the influence of airfoil geometry in flow nature.
2.Airfoils
The segment of the wind turbine blade is called wing and blade segment face shape is called airfoil. The word of airfoil or aerofoil is derived from the two Greek words Aeros (of the air) and Phyllon (leaf) [9]. An airfoil looks like the leaf which capture the wind.
Figure 1 show the nomenclature of airfoil. The chord line connects the leading edge and trailing edge of airfoil with straight line. The camber line is the geometrical center line.
321
Figure 1: Airfoil nomenclature
2.1.NACA 4412
NACA means National Advisory Committee for Aeronautics. NACA families dedicated their airfoils due to the airfoil dimension. NACA 4412 means maximum camber is occurred 4% at 40% of the chord and maximum thickness found 12% at 30% of the chord [11]. Figure 2 shows the sketch of NACA 4412.
Figure 2: Sketch of NACA 4412
2.2.SG 6043
SG series are specially designed for low Reynolds number airfoils. These airfoils are researched and designed by M. Selig and P. Giguere.SG 6043 has maximum camber is occurred 5.49% at 48.8% of the chord and maximum thickness found 10.01% at 32.3% of the chord [11]. Figure 3 shows the sketch of SG 6043.
Figure 3: Sketch of SG 6043
3.Parameters
There are two important parameters to show the airfoil performance, lift coefficient and drag coefficient. Lift force create the rotation action of the blade and drag force is the parasitic force. Two forces have same parameters but different in coefficient terms. The airfoil angle of attack is selected from the maximum lift to drag ratio at designed Reynolds number.
322
3.1. Lift and Drag Coefficient (Cl and Cd)There are two forces acting on the airfoil due to wind. They are lift force and drag force. The incoming wind strike the blade and pass over the airfoil. Due to the airfoil shape, the upper surface wind velocity is different from the lower surface. The upper surface wind velocity is faster than lower surface. This different create pressure different and pressure is inversely proportional to velocity. Since force is the product of pressure and area, pressure create force. Lift force(L) is wanted force and perpendicular to the wind flow. Drag force (D) is the parasitic force and parallel to the wind flow. Wind turbine power output is calculated from tangential force; consequences of lift and drag forces. The lift and drag forces are demonstrated in Figure 4.
Figure 4: Demonstration of lift and drag forces
The ratio of lift force to wind kinetic force is called lift coefficient. The ratio of drag force and kinetic force is also called drag coefficient.
c ρV 2 1 L C 2 l = (1) c V 2 1 D C 2 d ρ = (2) Where, ρ = Density (kg/m3 ) V = Velocity (m/s) c = Chord length (m) L = Lift force (N) D = Drag force (N)
323
In design considering of wind turbine, airfoil profile must be selected based on the Reynolds number. The characteristics of flow over airfoil depend on the size of the foil and on the speed of relative wind. This relation is shown by Reynolds number, dimensionless parameter. The equation of Reynolds number(Re) is
Where, μ = Dynamic viscosity (N.s /m2
)
υ = Kinematic viscosity (m2/s)
4.Numerical Analysis
There are three numerical methods to discretize the governing differential equations of mass, momentum and energy. These are Finite Different Method (FDM), Finite Element Method (FEM) and Finite Volume Method (FVM). The simulation of wind turbine airfoil, wing and blade are wisely done with Fluent or CFX solver of CFD software. Fluent or CFX solver use FVM in numerical analysis. In this research, Fluent solver in Ansys software is used to solve the airfoil performance.
4.1.Governing Differential Equation
In k-ε model, the first transported variable is turbulent kinetic energy, k. The second transported variable is the turbulence dissipation, ε.
In standard k-ε model, the turbulent kinetic energy k can be described as;
k M b k j k l j i i S Y P P x k x ku x k t + + − − + ∂ ∂ + ∂ ∂ = ∂ ∂ + ∂ ∂
ρε
σ
µ
µ
ρ
ρ
) ( ) ( (4)The turbulent dissipation ε can be described as;
ε ε ε ε ε
ε
ρ
ε
σ
µ
µ
ρε
ρε
S k C G C G k C x k x u x t j k b l j i i + − + + ∂ ∂ + ∂ ∂ = ∂ ∂ + ∂ ∂ 2 2 3 1 ( ) ) ( ) ( (5)The eddy viscosity is given by
ε
ρ
µ
µ 2 k C l = (6)The production of the turbulence kinetic energy is given by
(3) υ = µ ρ =Vc Vc Re
324
2
S
P
k=
µ
l (7)In these equations, Gk and Gb are the generation of turbulence kinetic energy. Ym is the dilatation dissipation
term which is the contribution of the fluctuating dilatation in compressible turbulence to the overall dissipation rate. The empirical constants C1ε =1.44, C2ε =1.92, Cμ =0.09, σε =1.3 and σk= 1.0. In ANSYS-Fluent Sε and Sk
are the user defined terms [4].
4.2.Geometrical Import
The first step in numerical simulation, airfoil geometry is created or imported. Airfoil coordinates are got from existing airfoil database. The sketch of airfoil geometry is imported using other Modelling software, like SolidWorks, Gambit, AutoCAD. Besides, the geometry can be created Design Modeler in Ansys software.
Figure 5: Geometry in Design Modeler
The NACA 4412 and SG 6043 airfoils are created at different angle of attack(α) with AutoCAD software. The
different angles of attack(α) are 0º, 5º, 10º. The design chord length is 0.5m and the width is 0.25m. After the
geometry is imported, fluid volume boundary is drawn for further processing.
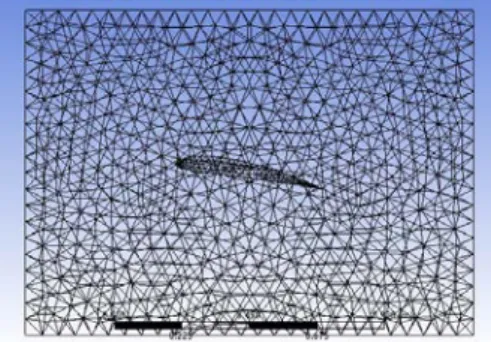
4.3.Meshing
Meshing is done to create discrete boundary condition in fluid domain interface. Size function is proximity and curvature and relevance center is fine. There are 40037 nodes and 221246 elements. Fine mesh gives the good results but time consuming is too long. After meshing is finished, the airfoil performance is predicted in Fluent solver.
325
4.4.FluentThere are two portion in Fluent solver, pre-processing and post-processing. In pre-processing step, the solving method is selected. Table 1. shows the solving ways and then the results are seen in post-processing.
Table 1: Setup for Solving with Fluent
Solver Pressure-based Simulation type Steady Fluid material Air Temperature 300K Kinematic Viscosity 1.46x10⁻⁵m2/s Interpolating Scheme Pressure (standard),
Density (Second Order Upwind) Momentum (Second Order Upwind)
Modified Turbulence Viscosity (Second Order Upwind)
Turbulence model k-ε, Realizable, Wall-treatment Enhancement Inlet velocity 10m/s
Reference area 0.1m2
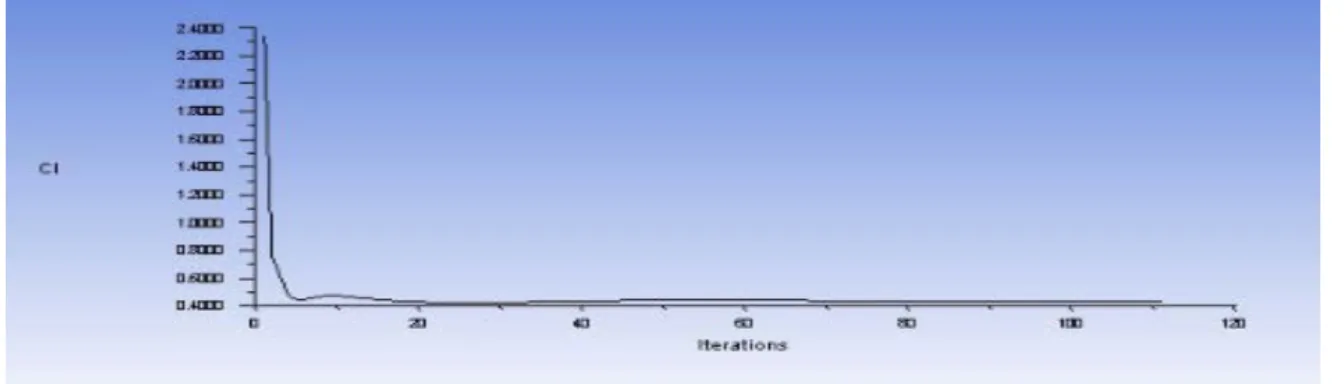
5.Results and Discussions
The design chord length is 0.5m and wind velocity is 10m/s. So the calculated Reynolds number is 350,000. This is the low Reynolds number. Although RNG k-ε model is appropriate for low Reynolds number and realizable k-ε model produces non-physical turbulent viscosities, the realizable k-ε model is used. Because the realizable k-ε model give more accurate results. Figure 7 and 8 show the lift coefficient plot of NACA 4412 and SG 6043. Figure 9 and 10 show the drag coefficient plot of two airfoils. The results are compared at angle of attack 0º, 5º, 10º respectively.
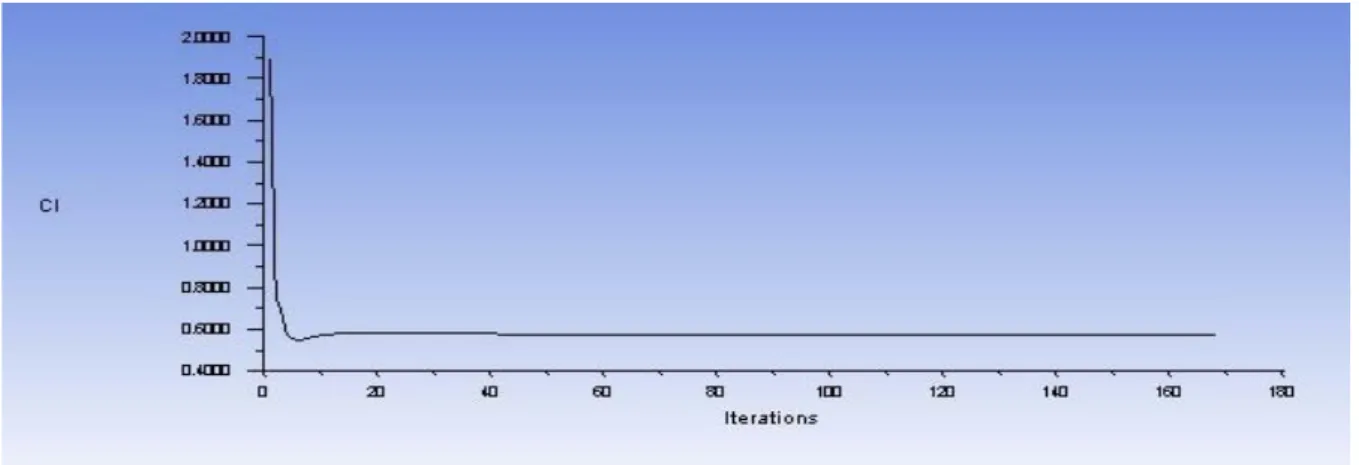
326
Figure 8: Lift coefficient of SG 6043 wing at 0º angle of attack
Figure 9: Drag coefficient of NACA 4412 wing at 0º angle of attack
Figure 10: Drag coefficient of SG 6043 wing at 0º angle of attack
The iteration times are between 100 and 200. The numerical results of lift coefficient are similarly the same but the drag coefficients are little higher than the Profili results. Table 2 and 3 show the comparison results of lift and drag coefficient for each airfoil.
327
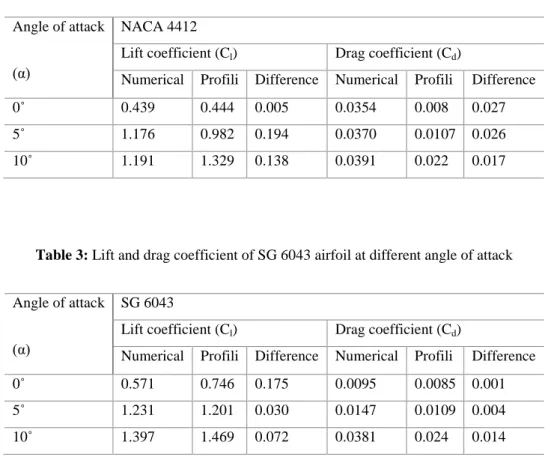
Table 2: Lift and drag coefficient of NACA 4412 airfoil at different angle of attack
Angle of attack
(α)
NACA 4412
Lift coefficient (Cl) Drag coefficient (Cd)
Numerical Profili Difference Numerical Profili Difference 0˚ 0.439 0.444 0.005 0.0354 0.008 0.027 5˚ 1.176 0.982 0.194 0.0370 0.0107 0.026 10˚ 1.191 1.329 0.138 0.0391 0.022 0.017
Table 3: Lift and drag coefficient of SG 6043 airfoil at different angle of attack
Angle of attack
(α)
SG 6043
Lift coefficient (Cl) Drag coefficient (Cd)
Numerical Profili Difference Numerical Profili Difference 0˚ 0.571 0.746 0.175 0.0095 0.0085 0.001 5˚ 1.231 1.201 0.030 0.0147 0.0109 0.004 10˚ 1.397 1.469 0.072 0.0381 0.024 0.014
The lift coefficient difference shown tables occur maximum value of 0.194 and minimum value is 0.005. SG
6043 results are approximately same except 0˚ angle of attack. The drag coefficient difference range is from
0.001 to 0.027. The results are different due to the import geometry, mesh quality, and CFD equations. Suitable agreement occurs in lift coefficient of SG 6043. At angle of attack 5º, both airfoils are higher than the expected result. According to the results, SG 6043 has high performance than NACA 4412. Figure 11 shows the lift to drag ratio of NACA 4412 and SG 6043 airfoil in Numerical and Figure 12 shows the expected results.
Figure 11: Numerical comparison of lift to drag coefficient ratio of NACA 4412 and SG 6043
12.4 31.78 30.46 60.06 83.73 36.67 0 20 40 60 80 100 0 5 10
Numerical Comparison results of Lift to Drag Coefficient Ratio Vs Angle of Attack
328
Figure 12: Expected results of lift to drag coefficient ratio of NACA 4412 and SG 6043
According to Figure 11 and 12 have similarly same track but the values are much differ. The maximum lift to drag coefficient ratio of SG 6043 and NACA 4412 occur angle of attack 5º. Although the angle of attack should be checked in step by step, the lift and drag coefficient values are similarly the same as other angles. So angle step is used at 5º. At angle of attack 10º, both methods have similarly the same values. SG 6043 airfoil give the best result at Reynolds number 350,000 and angle of attack 5º.
6.Conclusion
The lift and drag coefficient describe the performance of airfoil. In numerical simulation, import geometry smoothing and fine mesh give the close results with another printed results. Moreover, the accuracy of the simulation depends on the ability to accurately guess the transition location. Although the airfoil database is declared according to many researchers in research fields, any airfoil profile used in wind turbine blade may be tested with numerical simulation and wind tunnel testing before constructing the wind turbine blade. Because blade material useable, available wind flow and chord length, temperature effect, production technologies are different. It is also needed to test the airfoil shape in wind tunnel test and comparison the results of any other printed data. The author use chord length 0.5m and wind speed 10m/s for the experimental building of wind turbine blade in local regions. According to the results, SG 6043 is suitable for local low wind speed regions.
Acknowledgements
The author is deeply gratitude to Dr. Myint Thein, Rector, Mandalay Technological University. The author gratefully acknowledges to Dr. Tin San, Associate Professor and Head of Mechanical Engineering Department, Mandalay Technological University. The author would like to express grateful thanks to her supervisor Dr. Myat Myat Soe, Associate Professor, Department of Mechanical Engineering, and to all her teachers from Mandalay Technological University. The author’s special thanks are sent to her parents and only sister for their guidance from childhood till now.
50.4773 91.7757 60.4364 87.7412 110.2202 61.2083 0 20 40 60 80 100 120 0 5 10
Expected Results Comparison of Lift to Drag Coefficient Ratio Vs Angle of Attack
329
References[1] R. Eppler and D. M. Somers. “ Airfoil Design for Reynolds Numbers between 50,000 and 500,000,” in Proc. Conference on Low Reynolds Number Airfoil Aerodynamics, 1985, pp. 1-14
[2] M. D. Maughmer and M. S. Selig. “ Low Reynolds Number Airfoil Design,” in Proc. Conference on Low Reynolds Number Airfoil Aerodynamics, 1985, pp. 15-26.
[3] J. Yao, W. Yuan, J. Wang, et al. “ Numerical simulation of aerodynamic performance for two dimensional wind turbine airfoils,” in Proc. Engineering 31, 2012, pp. 80-86.
[4] H. Cao. “ Aeroddynamics Analysis of Small Horizontal Axis Wind Turbine Blades by Using 2D and 3D CFD Modelling. ” MSc (by Research), University of the Central Lancashire, Preston, England, 2011.
[5] F. A. Najar and G. A. Harmain. “ Blade Design and Performance Analysis of Wind Turbine,” in Proc. IJCRGG, 2013, pp. 1054-1061.
[6] E.Hoogedoorn, G. B. Jacobs, A. Bey. “ Aero-elastic behavior of a flexible blade for wind turbine Application: a 2D computational study,” in Proc. Energy, 2010, pp. 778-785.
[7] A. Gross and H. F. Fasel. “ Numerical Investigation of Different Wind Turbine Airfoils,” AIAA Aerospace Sciences Meeting including the New Horizons Forum and Aerospace Exposition, Oriando, Florida, 2011.
[8] D. Hartwanger and A. Horvat. “ 3D Modelling of a Wind Turbine Using CFD,” Engineering Simulation: Effective Use and Best Practice, Cheltenham, United Kingdom, 2008.
[9] M. Kevadiya and H. A. Vaidya. (2013, May). “ 2D Analysis of NACA 4412 Airfoil.”International Journal of Innovative Research in Science, Engineering and Technology. [On-line]. 2(5), pp-1686-1691. Available:www.ResearchGate/file.PostFileLoader.html [Nov5, 2015]
[10] D. Stefano. “ Profili 2.00c Pro.” Internet: www.profili2.com/eng/default.html, Apirl.6,2013. [Oct.27, 2015]