Increasing Employees’ Fruit Consumption through Access
and Peer Support at Work
Amanda D. Hutchinson1,2, Georgina Howlett3, Carlene Wilson1,2
1
Flinders Centre for Innovation in Cancer, Flinders University, Adelaide, Australia; 2Cancer Council South Australia, Adelaide, Aus- tralia; 3School of Psychology, Flinders University, Adelaide, Australia.
Email: [email protected]
Received May 26th, 2013; revised June 26th, 2013; accepted July 4th, 2013
Copyright © 2013 Amanda D. Hutchinson et al. This is an open access article distributed under the Creative Commons Attribution License, which permits unrestricted use, distribution, and reproduction in any medium, provided the original work is properly cited.
ABSTRACT
Objective: To assess the effect of providing free fruit and peer support in the workplace, on employees’ consumption of fruits and high fat snacks at work and home. Methods: Three worksites, including 75 employees, were randomly as- signed to a free fruit condition (Group A), a free fruit and peer education and modelling condition (Group B), and a control group (Group C). Groups A and B had free fruit delivered to their workplace each morning for four weeks. Consumption of fruit and high fat snacks was measured pre- and post-intervention, and after a two week maintenance period. Results: Despite a small sample, the intervention increased employees’ fruit intake at work, decreased high fat snacks and was more successful in those who were not currently meeting the recommendations of two pieces of fruit per day. Peer support led to increased fruit consumption at work and sustained decreases in unhealthy snacks post-in- tervention. Conclusions: The provision of fruit in the workplace with peer support is a simple and effective method for improving fruit consumption at work in the short-term, particularly in those not meeting current recommendations. In addition, those participating in the intervention reduced their consumption of high fat snacks. Further research is neces- sary to determine whether a longer larger scale intervention can sustain dietary changes and thereby reduce risk for chronic disease in the Australian population.
Keywords: Workplace; Peer Education; Health Promotion; Fruit
1. Introduction
Research indicates that there is an inverse relationship between fruit consumption and obesity [1]. The preven- tion of obesity is important because overweight and obe- sity are associated with an increased risk of chronic dis- eases including cancer, cardiovascular disease and dia- betes [2]. For example, the World Cancer Research Fund/ American Institute for Cancer Research report on Food, Nutrition, Physical Activity and the Prevention of Cancer [3] states that the consumption of fruits probably protects against cancers of the mouth, pharynx, larynx, oesopha- gus, lung and stomach. Therefore, fruit consumption is often promoted in order to reduce the risk of cancer and other chronic diseases.
The current Australian recommendation for adults is two serves of fruit daily, where one serve is equivalent to one medium sized piece of fruit (e.g. apple, banana), two pieces of smaller fruit (e.g. apricots, plums), or half a cup of fruit juice [4]. However, only 32% of Australian adults
meet this recommendation [5].
Interventions aimed at increasing fruit consumption have been implemented in a variety of settings in order to decrease the rate of obesity and improve the health of members of the community [6-10]. The workplace may be chosen for interventions because of the potential health benefits for employees and associated decreases in ab- senteeism and sick leave [11,12]. Furthermore, these ini- tiatives are thought to improve employee satisfaction thereby reducing staff turnover. The workplace is also a setting for interventions aimed at increasing fruit con-sumption because people spend a lot of their time at work and workplace social networks can be utilized to spread positive messages about fruit consumption.
availability and accessibility of fruit can improve daily intake over several months. Furthermore, the daily intake of added sugar was significantly reduced in the employees from intervention workplaces. It is not clear whether fruit was provided to employees beyond the five-month study period or whether dietary changes were maintained.
Sorensen et al. [14] found that social norms and social networks were associated with fruit and vegetable intake. These social factors may be an important part of work- place interventions. Buller and colleagues [15] utilised social networks in an 18-month workplace education intervention that promoted the consumption of fruits and vegetables but did not provide fruit or vegetables. This involved the addition of a peer education component to the intervention for the last nine months. Peer education programs utilize social networks by identifying influen- tial individuals who then share a health message or model a new behaviour to others. Therefore, education and health promotion occurs more informally than it does in more structured programs. Post-intervention, the peer education program was found to have a significant effect on fruit intake compared with the standard education program highlighting the potential for peer education to influence health promotion. Buller et al. [15] also meas- ured fruit and vegetable consumption six months after the program ended. They found that awareness of the program, knowledge of recommended serves and some diet-related attitudes were maintained over this time. However, the results were inconsistent in terms of actual consumption. Although the change in the consumption of fruits and vegetables using a 24-hour recall measure per- sisted, daily serves measured using a food-frequency questionnaire did not.
Taken together past research suggests the provision of free fruit and peer support both serve to encourage intake, at least in the short-term. Data on maintenance of fruit intake are more concerning and it is unclear the extent to which dietary changes generalise beyond the workplace or impact on consumption of other foods. The current study aims to examine the separate contribution of peer support and the provision of fruit at work to dietary change. In addition, we will evaluate the extent of gener- alisability of any observed dietary change to the home setting, maintenance of behaviour after the intervention, and influence on high fat snack consumption. This re- search was approved by the university’s Social and Be- havioural Research Ethics Committee.
2. Method
2.1. Participants
Participants (N = 75, two females) were recruited from three worksites from one South Australian utility com- pany. These worksites were matched in terms of size and
the type of work conducted (field work) but located separately. Employees spent time in the office at the be- ginning of each day and in between jobs that were car- ried out in the community. Employees were predomi- nantly middle-aged; 42 were 41 years or older, 12 were aged between 31 and 40 and the remainder (21) were aged less than 30. Participation was voluntary.
2.2. Design
Each worksite was randomized to a fruit condition (Group A), a fruit and peer education/modelling condition (Group B), or a control condition (Group C). The control com- pleted the assessments at the same time as the other two groups but did not receive any intervention. Groups A and B had free fruit delivered to their workplace each morning for a period of four weeks. Fruit was placed in a communal room where employees went each morning as well as throughout the day. Fruit was available to all em- ployees; however, participation in the study was volun- tary. Participation ranged from 27% and 28% in Groups A and C respectively to 45% of employees in Group B at baseline.
Group B also received peer support for consumption in the form of modelling and education. Influential peers were identified using a Peer Identification Questionnaire (see Method) prior to the beginning of the intervention. Employees who were identified through this process were invited to participate as peer educators. The role involved encouraging people to eat fruit, modelling eat-ing fruit and/or talkeat-ing about the health benefits of eateat-ing fruit. Four employees (14% of employees in Group B) agreed to take on this role and attended a training session that included examples of how to encourage fruit con-sumption. Peer educators were told that they could talk about the fruit in their general conversations or ask ques- tions such as “Have you had a piece of fruit today? The bananas are really good”. Peer educators received a small financial reimbursement for their time. Consistent with Campbell et al. [16], peer educators were asked to keep a daily record of the number of times they spoke to a col-league about fruit or encouraged them to eat fruit. The purpose of the log was to assess the extent to which the peer component of the intervention was implemented.
Employees’ consumption of fruits and high fat snacks was measured before the intervention (pre-intervention), at the conclusion of the four week intervention period (post-intervention) and two weeks after the fruit was withdrawn (maintenance). This final assessment was in- cluded in order to determine whether any behaviour changes observed during the intervention were maintained.
2.3. Measures
gender and age range. for support?”, “Among your work colleagues, who is the person that you respect the most?” and finally “Who do you think is a good leader in your workplace?” Five peo- ple with the highest number of nominations from their peers were invited to participate as peer educators and four agreed to fulfil this role.
Food Frequency Questionnaire. Fruit consumption was measured using a Food Frequency Questionnaire designed for the present study. All participants were asked “In the last week at work (Monday to Friday) how many serves of fruit did you eat?” Respondents then in-dicated whether they had eaten 0, 1, 2, or more than 3 serves of fruit on each work day at work. A serve was defined as one medium sized fruit such as an apple, pear, banana or two small sized fruits such as apricots. This measure was also used to measure fruit consumption at home. The sum of these scores provided a total score for fruit eaten in the workplace and fruit eaten at home dur-ing the week. In addition to fruit consumption at work and at home, the number of high fat snacks was also measured in a similar manner. High fat snacks were de-fined as sweet biscuits, sweet pastries, sweet pies, cake, chocolate, corn chips, potato chips and high fat savoury biscuits. This was included to see whether any increase in fruit consumption was accompanied by a decrease in high fat snack consumption.
3. Results
3.1. Sample Attrition
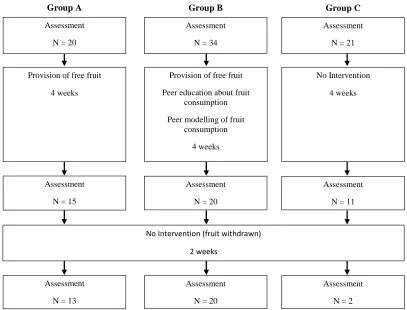
Seventy-five employees completed the pre-intervention assessment (Group A = 20, Group B = 34, Group C = 21). Post-intervention, 46 participants completed the assess-ment (Group A = 15, Group B = 20, Group C = 11). The total sample decreased to 35 employees after the two week maintenance period (Group A = 13, Group B = 20, Group C = 2). Although we set out to have a clus-ter-randomised controlled design this was not possible due to attrition. Therefore, as indicated by the CON-SORT statement [17], this is a non-randomised observa-tional study. Information on participant attrition and par-ticipant inclusion in all analyses are provided as recom-mended by CONSORT (see Figure 1). Peer logs indi-cated that peer educators spoke to their co-workers about fruit consumption an average of 21 times per week.
Peer Identification Questionnaire. The Peer Identifica- tion Questionnaire was modelled on Campbell et al.’s [16] questionnaire, which was used to identify potential peer educators in a smoking prevention program. Ques- tions included “In your workplace, whom do you look to
Group A Group B Group C
Provision of free fruit
Peer education about fruit consumption
Peer modelling of fruit consumption
4 weeks
No Intervention
4 weeks Provision of free fruit
4 weeks
No Intervention (fruit withdrawn)
2 weeks
Assessment
N = 13
Assessment
N = 20
Assessment
N = 2 Assessment
N = 11 Assessment
N = 20 Assessment
N = 15 Assessment
N = 20
Assessment
N = 34
Assessment
[image:3.595.93.500.406.716.2]N = 21
Figure 1. Study design and participation attrition.
3.2. Consumption of Fruit and High Fat Snacks
Multivariate ANOVAs were used to compare the three groups pre- and post-intervention. There were no signi- ficant differences in fruit consumption at home, at work, or consumption of high fat foods at baseline (see Table 1
[image:4.595.58.539.328.516.2]for mean consumption before the program). Results in- dicated that there was a significant interaction of group and time for fruit consumption at work (p = 0.04) (see
Table 1 and Figure 2). Post hoc analyses using Tukey’s HSD test indicated that fruit consumption in Group B (free fruit and peer education/modelling), was signifi-cantly greater than that in Groups A (fruit only) and C (controls). Furthermore, the calculation of a reliable change indicator demonstrated that 9 out of 15 partici-pants in Group A and 12 out of 20 participartici-pants in Group B showed changes in their fruit intake that were greater
than that expected due to measurement error. In contrast, only 3 of 11 participants in Group C, the control group, made reliable changes.
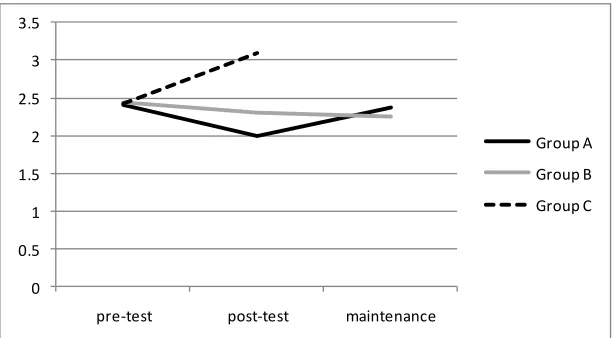
Similarly, there was a significant interaction of group and time for high fat snack consumption (p = 0.04), with both Groups A and B decreasing the number of high fat snacks consumed pre- to post-intervention and controls increasing high fat snack consumption (see Table 1 and
Figure 3).
Multivariate analyses of variance indicated that there was no significant difference in fruit consumption at home between the three groups pre- to post-intervention (see Table 1). This suggests that changes in fruit con- sumption at work did not generalise to the home envi- ronment.
MANOVAs were also used to compare consumption of fruit and high fat snacks in the two week maintenance
Table 1. Consumption of fruit at work, home and consumption of high fat snacks pre and post-intervention and after a 2- week maintenance period.
Group A (fruit) Group B (fruit + peer education) Group C (control)
N Mean SD N Mean SD N Mean SD F p
Fruit consumption at work Pre 20 5.95 4.67 34 8.88 4.22 21 8.52 5.10
Post 15 10.53 4.31 20 13.70 1.92 11 7.73 4.59 3.38a 0.04*
Maintenance 13 8.62 5.55 20 10.25 4.45 0.10b 0.76
Fruit consumption at home Pre 20 6.35 5.78 34 6.62 5.39 21 6.00 5.36
Post 15 7.53 6.50 20 8.20 5.38 11 6.36 5.52 0.16a 0.86
Maintenance 13 7.77 8.02 20 7.25 5.51 0.14b 0.71
High fat snack consumption Pre 20 2.40 0.75 34 2.44 1.08 21 2.43 0.68
Post 15 2.00 1.07 20 2.30 0.98 11 3.09 1.14 3.49a 0.04*
Maintenance 13 2.38 0.96 20 2.25 1.02 4.34b 0.05*
Note: aComparison of pre- and post-measures; bComparison of post and maintenance measures (Groups A & B only); *p < 0.05.
0 2 4 6 8 10 12 14 16
pre‐test post‐test maintenance
Group A
Group B
[image:4.595.144.461.539.706.2]Group C
0 0.5 1 1.5 2 2.5 3 3.5
pre‐test post‐test maintenance
Group A
Group B
[image:5.595.145.453.84.253.2]Group C
Figure 3. High fat snack consumption in Groups A, B and C over time. Note: Group C not included at maintenance due to poor response rate.
period (see Table 1). Group C was excluded from this analysis due to participant attrition. A significant effect of time was found for fruit eaten at work with both Groups A and B decreasing fruit consumption during the maintenance period, F(1, 26) = 15.31, p = 0.001. There was no significant difference between the two groups. However, a comparison of fruit consumption before the intervention and during the maintenance period found a trend towards an effect of time, F(1, 30) = 4.07, p = 0.053, such that more fruit was eaten during the mainte- nance period than before the free fruit program.
No significant effects were found for fruit eaten at home during the maintenance period. Interestingly, there was a significant interaction of group and time for high fat snacks; consumption increased in Group A (free fruit) but decreased in Group B (free fruit and peer educa- tion/modelling) during this maintenance period. Although the magnitude of these changes was small, this result suggests that peer education and modelling was more ef- fective than the provision of fruit alone in maintaining a reduction in high fat snack consumption.
To summarise, the provision of free fruit increased employees’ fruit intake and decreased high fat snacks but only the group receiving peer support managed to main- tain this change, and only in the reduction of unhealthy snacks.
3.3. Comparing Impact of the Intervention on Participants Who Met Fruit Intake
Guidelines at Baseline with Those Who Did Not
Baseline data indicated that the consumption of fruit was quite high in all three work groups before the intervene- tion began with the mean consumption in each group ranging from six to nine serves at work per week. In ad- dition, participants in each group reported consuming six
serves of fruit per week at home.
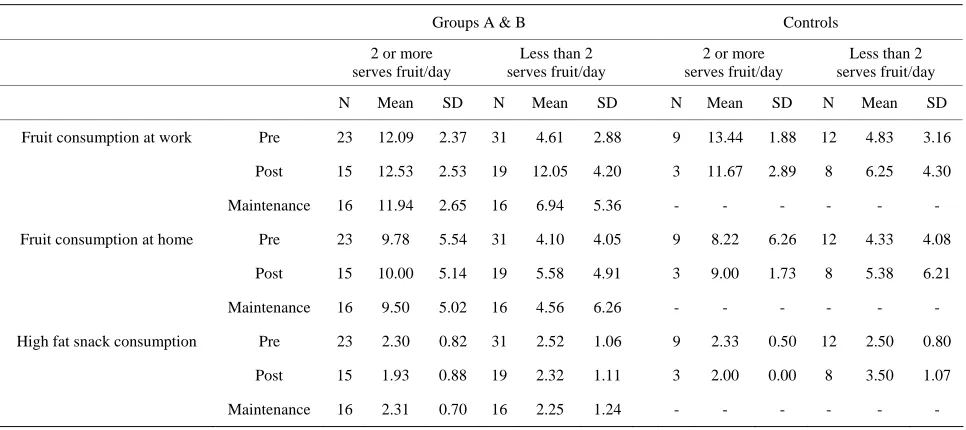
In order to distinguish whether the impact of the in- tervention differed depending on baseline consumption, analyses were conducted comparing those who con- sumed less than recommended with those who achieved or exceeded recommendations at baseline. For analysis of consumption during the intervention period (pre- to post-measures) Groups A and B were combined and com- pared with Group C (see Table 2). There were no sig- nificant effects of time or group (meeting recommenda- tions or not) for fruit consumption at work or at home during the intervention. However, reliable change calcu- lations indicated that 18 of 19 participants who were not meeting the current guidelines in Groups A and B dem- onstrated reliable change in fruit consumption during the intervention compared with 3 of 8 controls. Among those already meeting the recommendations, 3 of 12 partici- pants in Groups A and B and none of the 3 controls made reliable changes.
Analyses that included the maintenance period ex- cluded controls (Group C), due to the poor response rate in this group. MANOVA indicated that there was a sig- nificant effect of time (pre-intervention, post intervention, maintenance period) on fruit consumption at work, F(2, 50) = 23.66, p < 0.001. Furthermore, there was a signifi-cant interaction effect of time (pre-intervention, post in- tervention, maintenance period) and group (meeting the recommendations or not) on fruit consumption at work,
F(2, 50) = 11.90, p < 0.001, indicating that the increased fruit consumption was greater in those who were not meeting the daily recommendations for fruit intake prior to the study (see Figure 4). There were no significant effects on fruit consumption at home.
0 2 4 6 8 10 12 14
pre‐test post‐test maintenance
Groups A and B: 2 +
serves fruit/day
Groups A and B: < 2
[image:6.595.145.453.85.254.2]serves fruit/day
Figure 4. Fruit eaten at work in Groups A and B: comparison of those meeting the current recommendations with those who were not.
Table 2. Consumption of fruit and snacks over time for those eating 2 or more serves of fruit per day and those eating less than 2 serves of fruit/day before the intervention.
Groups A & B Controls
2 or more serves fruit/day
Less than 2 serves fruit/day
2 or more serves fruit/day
Less than 2 serves fruit/day
N Mean SD N Mean SD N Mean SD N Mean SD
Fruit consumption at work Pre 23 12.09 2.37 31 4.61 2.88 9 13.44 1.88 12 4.83 3.16
Post 15 12.53 2.53 19 12.05 4.20 3 11.67 2.89 8 6.25 4.30
Maintenance 16 11.94 2.65 16 6.94 5.36 - - -
Fruit consumption at home Pre 23 9.78 5.54 31 4.10 4.05 9 8.22 6.26 12 4.33 4.08
Post 15 10.00 5.14 19 5.58 4.91 3 9.00 1.73 8 5.38 6.21
Maintenance 16 9.50 5.02 16 4.56 6.26 - - - - - -
High fat snack consumption Pre 23 2.30 0.82 31 2.52 1.06 9 2.33 0.50 12 2.50 0.80
Post 15 1.93 0.88 19 2.32 1.11 3 2.00 0.00 8 3.50 1.07
Maintenance 16 2.31 0.70 16 2.25 1.24 - - - - - -
group (intervention or control), time (pre to post inter-vention) and consumption of high fat snacks during the intervention, F(1, 41) = 3.40, p = 0.07, such that more high fat snacks were consumed by controls (Group C) who were not already eating two or more serves of fruit per day. When the maintenance period was included in the analysis and controls were excluded, no significant effects were found.
In summary, the intervention was more successful in increasing fruit consumption at work among those who were not currently meeting the recommendations. High fat snacks were also reduced to a greater extent in those who were not already eating two serves of fruit per day. However, this result was not maintained at the end of the intervention.
4. Discussion
The current study assessed the effect of providing free fruit and peer education about/modelling of fruit con- sumption in the workplace on the consumption of fruits and high fat snacks at work and at home. Results from the present study indicate that supplying free fruit in the workplace can increase fruit intake, particularly in those consuming small amounts of fruit, and decrease con- sumption of high fat snacks. This is an important result as it confirms other research which has found that simply making fruit accessible and affordable can lead to dietary change [13].
[image:6.595.57.540.323.538.2]thermore, the reduction of high fat snacks was main- tained in the peer education/modelling group, demon- strating the importance of social norms. Ongoing provi- sion of fruit has been shown to improve fruit consump- tion over a five month period [13]. Therefore, the provi- sion of free fruit on an ongoing basis and the utilisation of naturally occurring social networks within the work- place may achieve long-term change in employees’ fruit intake. Alternatively, a subsidised fruit program could be trialled to support long-term dietary change.
Dietary changes observed in the workplace did not ex- tend to the home environment. Consequently, social norms that may be affected by peer education in the workplace do not appear to extend beyond the worksite. However, fruit consumption at home was higher than expected at baseline in the current study. It is also im-portant to note that the current sample was predomi-nantly made up of middle-aged males. It is not known whether generalisation of improvements in consumption to the home environment is more likely with female em-ployees.
The results of the present study should be considered in light of a number of potential limitations. First, while the study aimed to establish the effectiveness of a short- term intervention on fruit consumption, a longer inter- vention, or the provision of fruit on an ongoing basis, may be more likely to elicit long-term changes in dietary behaviour. Second, the number of participants was lim- ited by the number of employees working at comparable sites resulting in a small sample size. In addition, com-plete data were not available for all three time points for all participants. Attrition was particularly problematic in the control group (Group C), resulting in the exclusion of this group from the analysis of data from the two week maintenance period. The high drop out in this group may have been due to the fact that this group did not receive fruit and, therefore, did not receive any benefit from par-ticipation. Thirdly, reported fruit consumption at baseline was higher than populations statistics would predict. Magarey et al. [5] reported that 32% of Australians ate at least two serves of fruit per day whereas 43% of our par-ticipants reported consumption levels equal or above re- commendations. Finally, using self-report measures of dietary intake can lead to socially desirable responding. Nevertheless, questionnaires were worded carefully to encourage honest responding, and any bias resulting from use of self-report measures should have affected partici- pants in the control group as well as those participating in the interventions.
In sum, the provision of fruit in the workplace led to increased fruit consumption in employees, particularly among those eating less than the recommended two serves of fruit per day before the intervention. This is an impor- tant finding due to the health benefits associated with
eating fruit and the difficulty in achieving change in die-tary behaviours. These results are also encouraging in terms of the potential to improve employees’ diets on a large scale through the implementation of similar pro-grams in workplaces across the country. Despite the short-term success of this intervention, maintenance of these behaviour changes over time remains to be seen. The addition of peer education and modelling resulted in the maintenance of reductions in high fat snacks beyond the four week program but did not successfully maintain increases in fruit consumption. Further research is nec-essary to determine whether continued provision of fruit leads to long term dietary changes because sustained improvements may reduce the risk of obesity and chronic disease in the community.
REFERENCES
[1] S. Alinia, O. Hels and I. Tetens, “The Potential Associa- tion between Fruit Intake and Body Weight—A Review,” Obesity Reviews, Vol. 10, No. 6, 2009, pp. 639-647. http://dx.doi.org/10.1111/j.1467-789X.2009.00582.x [2] D. P. Guh, W. Zhang, N. Bansback, Z. Amarsi, C. L.
Birmingham and A. H. Anis, “The Incidence of Co-Mor- bidities Related to Obesity and Overweight: A Systematic Review and Meta-Analysis,” BMC Public Health, Vol. 9, 2009, p. 88. http://dx.doi.org/10.1186/1471-2458-9-88 [3] World Cancer Research Fund/American Institute for Can-
cer Research, “Food, Nutrition, Physical Activity and the Prevention of Cancer: A Global Perspective,” 2007.
[4] National Health and Medical Research Council, “Food for Health: Dietary Guidelines for Australians,” 2005.
[5] A. Magarey, S. McKean and L. Daniels, “Evaluation of Fruit and Vegetable Intakes of Australian Adults: The National Nutrition Survey 1995,” Australian and New Zealand Journal of Public Health, Vol. 30, No. 1, 2006, pp. 32-37.
http://dx.doi.org/10.1111/j.1467-842X.2006.tb00083.x [6] C. Knai, J. Pomerleau, K. Lock and M. McKee, “Getting
Children to Eat More Fruit and Vegetables: A Systematic Review,” Preventive Medicine, Vol. 42, No. 2, 2006, pp. 85-95. http://dx.doi.org/10.1016/j.ypmed.2005.11.012 [7] S. A. French and H. Wechsler, “School-Based Research
and Initiatives: Fruit and Vegetable Environment, Policy, and Pricing Workshop,” Preventive Medicine, Vol. 39, No. S2, 2004, pp. S101-S107.
[8] J. D. Seymour, A. L. Yaroch, M. Serdula, H. M. Blanck and L. K. Khan, “Impact of Nutrition Environmental In- terventions on Point-of-Purchase Behavior in Adults: A Review,” Preventive Medicine, Vol. 39, No. S2, 2004, pp. S108-S136.
http://dx.doi.org/10.1016/j.ypmed.2004.04.002
[10] G. Sorensen, L. Linnan and M. K. Hunt, “Worksite-Based Research and Initiatives to Increase Fruit and Vegetable Consumption,” Preventive Medicine, Vol. 39, No. S2, 2004, pp. S94-S100.
http://dx.doi.org/10.1016/j.ypmed.2003.12.020
[11] K. Dalziel and L. Segal, “Time to Give Nutrition Inter- ventions a Higher Profile: Cost-Effectiveness of 10 Nutri- tion Interventions,” Health Promotion International, Vol. 22, No. 4, 2007, pp. 271-283.
http://dx.doi.org/10.1093/heapro/dam027
[12] C. Wanjek, “Food at Work: Workplace Solutions for Mal- nutrition, Obesity and Chronic Diseases,” International Labour Office, 2005, 466 p.
[13] S. Alinia, A. D. Lassen, K. S. Krogholm, T. Christensen, O. H. Hels and I. Tetens, “A Workplace Feasibility Study of the Effect of a Minimal Fruit Intervention on Fruit In- take,” Public Health Nutrition, Vol. 14, No. 8, 2010, pp. 1382-1387.
http://dx.doi.org/10.1017/S1368980010002569
[14] G. Sorensen, A. M. Stoddard, T. Dubowitz, E. M. Bar- beau, J. Bigby, K. M. Emmons, et al., “The Influence of
Social Context on Changes in Fruit and Vegetable Con- sumption: Results of the Healthy Directions Studies,” Ame- rican Journal of Public Health, Vol. 97, No. 7, 2007, pp. 1216-1227. http://dx.doi.org/10.2105/AJPH.2006.088120 [15] D. B. Buller, C. Morrill, D. Taren, M. Aickin, L. Sen-
nott-Miller, M. K. Buller, et al., “Randomized Trial Test- ing the Effect of Peer Education at Increasing Fruit and Vegetable Intake,” Journal of the National Cancer Insti- tute, Vol. 91, No. 17, 1999, pp. 1491-1500.
http://dx.doi.org/10.1093/jnci/91.17.1491
[16] R. Campbell, F. Starkey, J. Holliday, S. Audrey, M. Bloor, N. Parry-Langdon, et al., “An Informal School-Based Peer- Led Intervention for Smoking Prevention in Adolescence (ASSIST): A Cluster Randomised Trial,” Lancet, Vol. 371, No. 9624, 2008, pp. 1595-1602.
http://dx.doi.org/10.1016/S0140-6736(08)60692-3 [17] CONSORT, “CONSORT Transparent Reporting of
Tri-als,” 2010.