PL ISSN 1233-5835
Marek Walesiak
DISTANCE MEASURE FOR ORDINAL DATA
*The study considers the problem of construction measures of similarity for ordinal data. The ordinal character of the data required the application of a specific measure of the object’s dis-tance. Walesiak (1993, p. 44–45), gives the proposal of a new measure of an objects similarity, which can be applied in the situation when variables describing objects are mea sured on the or-dinal scale. This measure was used in order to evaluate the similarities of objects, which were based on numbers of relations “equal to”, “greater than”, and “smaller than”. The distance measure takes care of variables with equal weights. We shall describe a slight gene ralisation of this measure, also covering different weights of variables. The strengths and wea knesses of the proposed distance measure are discussed.
1. INTRODUCTION
Classification, multidimensional scaling and linear ordering methods are important and frequently applied tools of multivariate statistical analysis. The application of these methods requires formalisation of the term “similarity of objects”. The use of a particular construction of similarity measure depends on the scale on which the variables are measured. In the measurement theory four basic scales are distinguished: nominal, ordinal, interval and r atio. These were introduced by Stevens (1959). Among the four scales of measurement, the nominal is considered the weakest. It is followed by the ordinal scale, the in-terval scale, and the ratio scale, which is the strongest.
The choice of similarity measures is rather simple when all the variables de-scribing examined objects are measured on the same scale. Literature presents plenty of different ways of similarity measurement which can be adopted to variables measured on the scale: ratio, interval and (or) ratio, nominal (i nclud-ing binary variables). A wide range of similarity measures has been shown in: Cormack (1971); Anderberg (1973); Everitt (1974); Kaufman and Rousseeuw (1990); Cox and Cox (1994, p. 10–11); Wedel and Kamakura (1998, p. 47).
*
Department of Econometrics and Computer Science, Wrocław University of Economics, e-mail: [email protected].
Walesiak (1993, p. 44–45), gives the proposal of a new measure of objects simi-larity, which can be applied in a situation when variables describing those o b-jects are measured only on the ordinal scale (see: also Walesiak, Dziechciarz and Bąk 1998, p. 656–657).
If we have a set A of objects described by m ordinal variables, then counting of events is the only possible arithmetic operation, which can be performed on these objects. The proposed measure is given by the following formula:
, 2 2 1 2 1 1 , 1 2 1 2 1 , 1 2 1 2 1 1 , 1
m j n k i l l klj m j kij m j n k i l l ilj m j ikj m j m j n k i l l ilj klj j i k j k i k i b b a a b a b a d(1)
where:
j r j k j p j i j r j k j p j i j r j k j p j i j r k j p i x x x x x x x x x x x x b a if , 1 if , 0 if , 1for
p = k, l; r = i, l; i, k, l =1, ..., n – number of object, j = 1, ..., m – number of ordinal variable,) , ( kj lj
j i x x
x – i–th (k–th, l–th) observation on j–th ordinal variable,
, object for observed han” “smaller t and han” “greater t relations of number – 1 , 1 2 1 2 i a a m j n k i l l lij m j ikj
. object for observed han” “smaller t and han” “greater t relations of number – 1 , 1 2 1 2 k b b m j n k i l l klj m j j ki
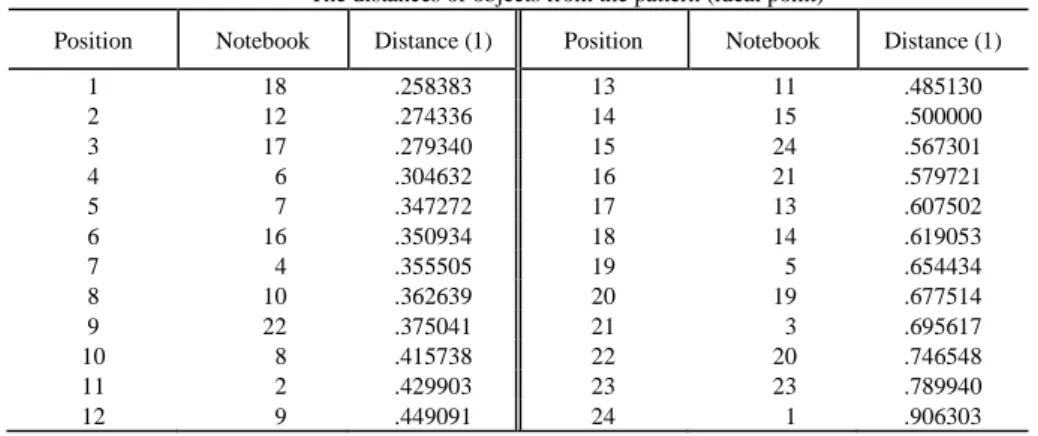
Example 1. Application of distance (1) to compute the distances of objects from the pattern (ideal point). The output result is vector of distances.
Table 1 Data
No. Notebook Efficiency Equipment Quality Ergonomics Document-ation 1 California Access 6200 62 76 3 35 6 2 California Access 7000 100 119 6 35 8 3 Clevo Mitsu P-96-3R 90 87 5 38 7 4 Clevo Mitsu P-98R 80 168 5 40 10 5 Compaq Armada 1590DT 66 92 5 42 7 6 Dell Latitude CP 166ST 103 107 6 47 8 7 Digital HiNote VP 735 122 130 5 48 7
8 Digital HiNote Ultra 2000 87 112 5 51 8
9 Eurocom 8500 124 154 5 32 7
10 Fujitsu LifeBook 675xCDT 116 146 5 58 5
11 Fujitsu LifeBook 765xTCDT 98 147 5 42 5
12 Fujitsu LifeBook 985xCDT 125 177 6 38 7
13 GerlCom Overdose Empire 8500T 111 110 5 33 7
14 Hyundai HN-5000 93 133 2 39 7
15 IBM ThinkPad TP380ED 87 94 4 52 9
16 Pablo 1800 114 153 7 35 7
17 Toshiba Satellite Pro 480CDT 102 122 7 40 10
18 Toshiba Tecra 750DVD 111 142 5 43 10
19 Tulip Motion Line db 5/166 77 104 5 42 5
20 Twinhead Aristo FT-9000 DSC 166 63 69 5 34 8 21 Twinhead Aristo FT-9000 TFT 200 91 93 5 38 8
22 Twinhead Aristo FT-9300T 125 147 5 39 7
23 Vobis HS LeBook Advance 166 DSC 64 86 4 40 7 24 Vobis HS LeBook Advance 200 TFT 78 131 5 40 7
Pattern 125 177 7 58 10
Weights 1 1 1 1 1
Source: CHIP 1998, no. 4.
Table 2
The distances of objects from the pattern (ideal point)
Position Notebook Distance (1) Position Notebook Distance (1)
1 18 .258383 13 11 .485130 2 12 .274336 14 15 .500000 3 17 .279340 15 24 .567301 4 6 .304632 16 21 .579721 5 7 .347272 17 13 .607502 6 16 .350934 18 14 .619053 7 4 .355505 19 5 .654434 8 10 .362639 20 19 .677514 9 22 .375041 21 3 .695617 10 8 .415738 22 20 .746548 11 2 .429903 23 23 .789940 12 9 .449091 24 1 .906303
2. MODIFICATION OF DISTANCE MEASURE
d
ikThe distance measure (1) takes care of variables with equal weights. We shall describe a slight generalisation of this measure, also covering different weights of variables. Suppose variable weights wj (j = 1, ..., m) satisfy conditions:
j w (0; m),
m j j w 1 m. (2)Three major methods of variable weighting have been developed: a priori based on expert opinions, procedures based on information included in the data and combination of these two methods. Grabiński (1992), Milligan (1989), Abra-hamowicz and Zając (1986) and Borys (1984) discuss the problem of variable weighting in multivariate statistical analysis.
The problem of whether or not to weight variables has caused controversy. Williams says (see: Aldenderfer and Blashfield, 1984, p. 21) that weighting is simply the manipulation of a value of a variable. Sneath and Sokal (1973) suggest that the appropriate way to measure similarity is to give all variables equal weight.
If variable weights are not uniform then distance measure is defined as (3).
, 2 2 1 2 1 1 , 1 2 1 2 1 , 1 2 1 2 1 1 , 1
m j n k i l l j klj m j j kij m j n k i l l j ilj m j j ikj m j m j n k i l l j ilj klj j i k j k i j k i b w b w a w a w b a w b a w d (3)When all variable weights are equal then formula (3) becomes distance measure (1).
Example 2. Application of distance (3) to compute the distances of objects from the pattern (ideal point). The output result is vector of distances.
Table 3
Weights for variables based on CHIP expert opinions Variable
Efficiency Equipment Quality Ergonomics Documentation
Weights 1.54 1.15 0.385 1.54 0.385
Table 4
The distances of objects from the pattern (ideal point)
Position Notebook Distance (3) Position Notebook Distance (3)
1 10 .349586 13 16 .515041 2 18 .372148 14 9 .522398 3 7 .395476 15 2 .522562 4 12 .399222 16 14 .522562 5 6 .432806 17 5 .522730 6 22 .438462 18 21 .522730 7 11 .446563 19 19 .522730 8 4 .454197 20 13 .530083 9 8 .462396 21 3 .606073 10 17 .477099 22 23 .667944 11 24 .500000 23 20 .813573 12 15 .500000 24 1 .862357
Source: own research.
3. THE STRENGTHS AND WEAKNESSES OF THE DISTANCE MEASURE
d
ikDistance measure dik:
– can be applied in a situation when variables describing objects are measured only on the ordinal scale,
– needs at least one pair of non-identical objects in A not to have zero in the denominator,
– Kendall’s idea of correlation coefficient for ordinal variables was used for the measure dik construction (see: Kendall 1955, p. 19),
– distance dik assumes values from the [0; 1] interval. Value 0 indicates that for the compared objects i, k between corresponding observations of ordinal vari-ables, only relations “equal to” take place. Value 1 indicates that for the compared objects i, k between corresponding observations on ordinal variables, relations “greater than” take place or relations “greater than” and relations “equal to”, if they are held for other objects (i.e. objects numbered l = 1, ..., n; where l i, k),
– distance dik satisfies conditions: dik 0, dii 0, dik dki (for all i, k = 1,..., n),
– simulation analysis proves that distance dik not always satisfies the triangle inequality,
– transformation of ordinal data by any strictly increasing function does not change the value of dik distance.
4. CONCLUDING REMARKS
The use of variables measured on ordinal scale is relatively rare in the litera-ture. Specific analytical tools are needed for such information. The proposed dis-tance measures (1) and (3) are appropriate in such situations.
When all variable weights are equal formula (3) becomes distance measure (1). The additional result of this study is a computer program, which allows com-puting distances between objects (see Appendix).
APPENDIX
The computer code in the C++ language computing the value of measure (3) of the distance considered is available at Wrocław University of Economics in the Dept of Econometrics and Computer Science (e-mail: [email protected]).
This version of the program allows to compute distances between objects (the output result is symmetric distance matrix) and also calculation of the distances of objects from the model or ideal point (the output result is vector of distances).
This matrix may be used in the hierarchical agglomerative methods of the clas-sification for the division of a set of objects into classes. This matrix can also be used for further computations in the SPSS for Windows package.
Acknowledgements:
The research presented in the paper was supported by the project KBN 1 H02B 011 16.
REFERENCES
Abrahamowicz, M., Zając, K. (1986): Metoda ważenia zmiennych w taksonomii numerycznej i pro-cedurach porządkowania liniowego [Variable Weighting Algorithm in Numerical Taxonomy and Linear Ordering Procedures]. Wrocław University of Economics, Research Papers no. 328, pp. 5–17.
Aldenderfer, M. S., Blashfield, R. K. (1984): Cluster Analysis, Sage, Beverly Hills.
Anderberg, M. R. (1973): Cluster Analysis for Applications. Academic Press, New York, San Fran-cisco, London.
Borys, T. (1984): Kategoria jakości w statystycznej analizie porównawczej [Category of Quality in Stati-stical Comparative Analysis]. Wrocław University of Economics, Research Papers no. 284.
Cormack, R. M. (1971): A Review of Classification (with Discussion), ”Journal of the Royal Statisti-cal Society”, series: A, (3), pp. 321–367.
Cox, T.F., Cox, M,.A. A. (1994): Multidimensional Scaling, Chapman and Hall, London. Everitt, B. S. (1974): Cluster Analysis, Heinemann, London.
Grabiński, T. (1992): Metody taksonometrii [Taxonometric Methods], Cracow University of Eco-nomics, Kraków.
Kaufman, L., Rousseeuw, P. J. (1990): Finding Groups in Data: an Introduction to Cluster Analysis, Wiley, New York.
Kendall m, G. (1955): Rank Correlation Methods, Griffin, London.
Milligan, G. W. (1989): A Validation Study of a Variable Weighting Algorithm for Cluster Analysis, Journal of Classification, no. 1, pp. 53–71.
Sneath, P. H. A., Sokal R. R. (1973): Numerical Taxonomy, W.H. Freeman and Co., San Francisco. Stevens, S. S. (1959): Measurement, Psychophysics and Utility, in: Churchman, C. W. and Ratoosh,
P. (eds.): Measurement; Definitions and Theories. Wiley, New York.
Walesiak, M. (1993): Statystyczna analiza wielowymiarowa w badaniach marketingowych [ Multi-variate Statistica Analysis in Marketing Research]. Wrocław University of Economics, Research Papers no. 654.
Walesiak, M. (1996): Metody analizy danych marketingowych [Methods of Marketing Data Analy-sis]. PWN, Warszawa.
Walesiak, M., Dziechciarz, J., Bąk, A. (1998): Ordinal Variables in the Segmentation of Advertise-ment Receivers, in: Rizzi, A., Vichi, N., Bock, H. H.: Advances in Data Science and Classifica-tion, Proc. 6th Conf. International Federation of Classification Societies in Rome. Springer, Hei-delberg, pp. 655–662.
Wedel, M., Kamakura, W. A. (1998): Market Segmentation. Conceptual and Methodological Foun-dations, Kluwer, Boston, Dordrecht, London.