DOI: 10.2298/AVB1203261P UDK 612.12:543.645.6:599.735.5:591.35:616.34-008.314.4
SERUM BIOCHEMISTRY AND NATIVE PROTEIN ELECTROPHORESIS IN DIARRHEIC CALVES WITH ARTHRITIS
PEKCAN M*, ALTINTAS A*, KARAGUL HILAL*, FIDANCI UR*, UYSAL H*, BESALTI O*, UNUBOL AYPAK SERAP**, CIFTCI GULAY***, BILGIHAN SIBEL**** and HANEDAN BASAK*****
*Ankara University, Faculty of Veterinary Medicine, Diskapi, Ankara, Turkey **Adnan Menderes University, Faculty of Veterinary Medicine, Isikli, Aydin, Turkey ***Ondokuz Mayis University, Faculty of Veterinary Medicine, Kurupelit, Samsun, Turkey
****EVET Veteriner Tani-Tedavi, Emek-Ankara, Turkey *****Diskapi Veteriner, Diskapi-Ankara, Turkey
(Received 22ndAugust 2011)
In this study, serum biochemistry and native protein electrophoresis in newborn calves with diarrhea and arthritis, were performed in order to evaluate the changes along with clinical findings for their possible application in the diagnosis and prognosis of disease. Based on clinical examination, animals were allotied into two groups comprising either diseased or healthy animals. Urea, creatinine, ALT, AST, LDH, albumin, total protein, glucose, total cholesterol, uric acid and iron levels were determined in the sera. Serum protein native polyacrilamide gel electrophoresis (nPAGE) was performed followed by protein band ratio estimation supported with densitometry at 596 nm. Differences between the average mean of healthy and diseased animals were compared statistically (Kruskal-Walley test). In this study a decrease in serum glucose and cholesterol values (p<0.001), increase in urea, LDH levels anda1-anda2-globulin levels (p<0.01 and p<0.05 respectively) were found to be associated with the disease. As a result, the observed significant changes in biochemical parameters and clinical investigation in calves, suggesting acute inflammation causing the decrease in glucose and increase in a-globulins, may be of prognostic value.
Key words: arthritis, calf diarrhea, PAGE, polyarthritis, serum protein electrophoresis, serum biochemistry
INTRODUCTION
Newborn diarrhea is a disease with the dominant symptom of white watery stool. The often expected result is death (Brenneret al., 1993; Sahalet al., 1994; Smith et al., 1996). Various pathogens (Salmonella spp, Criptosporidium spp, Giardia sppand E. colienteropathogenic types) and management conditions cause diarrhea in newborn (Brenneret al., 1993; Sahalet al., 1994; Samsar and Akin, 2000; Hewicker-Trautwien et al., 2002; Svensson and Jensen, 2007).
Kidneys may also be affected by the consequences of diarrhea (Altintas et al., 2002).
In the diagnosis and selection of the adequate treatment strategy blood and synovial fluid analysis are performed. During the disease, disturbances in both blood protein profile and electrolyte levels are expected (Sahal et al., 1994; Karagul et al., 2002). Electrophoretic pattern varies between species, but commonly observed bands are a1-globulin, a2-globulin, b-globulin and g -globulin (Trumel et al., 1996; Kaneko et al., 1997; Chaudhary et al., 2003). Accordingly, data obtained from native gel electrophoresis presumably is important for the clinical interpretation. Hence, investigation of arthritic-diarrheic calves’ sera with routine biochemical parameters in conjunction with electrophoresis can be useful in diagnosis and/or prognosis.
MATERIAL AND METHODS
Nineteen calves (2 crossbred, 17 purebred) of which seven of them male (2-75 days) admitted to Ankara University Faculty of Veterinary Medicine clinics with signs of diarrhea and swelling at the joints constituted the study material. Among all, two of the animals were vaccinated. Ten of them had signs of diarrhea and arthritis, three of them polyarthritis and diarrhea and six of them just arthritis. All the data in terms of age, sex, breed, feeding, colostrum intake, body temperature, pulse rate, etc. was recorded. Seven Holstein calves (15-60 days) raised at the Ankara University Education and Research Farm constituted the control group. All the control group calves received colostrum either spontaneously or by feeding. Blood samples (7-8 mL) were collected from each animal through thevena jugularis, upon separation of sera biochemical parameters were assayed and the remaining kept at -20oC. AST, LDH, glucose, cholesterol and iron levels were determined by commercial reagents in an autoanalyzer (Alcyon 300/300i, Abbott). Separation of serum proteins were maintained by 7.5% acrylamide gel (Laemmli UK, 1970, HSI, 1993) .
Statistical significance between groups was determined by computer assisted ANOVA and Kruskal-Wallis test (Kutsalet al., 1990).
RESULTS
In the study, ten of the calves aging 2-75 days received colostrum spontaneously. One calve responding poorly to treatment, in comatous and dehydrated state died after its pulse rate to 84 with respiration rate of 18. Respiratory distress was observed in two of the animals. One of the animals had BVD antibodies (+) and the other one hadCryptosporidia. Clinical investigation revealed swelling at joints, increase in synovial fluid volume, heat and pain. Swelling in a single joint was recorded as monoarthritis else as polyarthritis. 16 of 19 calves had monoarthritis (10 calves had diarrhea). 3 of the calves had diarrhea and polyarthritis. One of the calves with polyarthritis had umbilical infection, and the other one did not receive sufficient colostrum.
Observation of altered ALT and LDH and rise in serumg-globulin levels were interpreted as infection. In diseased animals glucose and total cholesterol values were low (p£0.001) and urea – LDH levels were high (p<0.01). Differences among ALT, AST, creatinine, total protein, albumin, Fe and uric acid levels were statistically not significant (Table 1).
Although serum Fe levels were about half of the (49.78±6.56mg/dL) control group (98.42±24.72mg/dL), the differences between the groups were statistically not significant (p>0.05). Stool occult blood was not observed in any of the diseased animals.
Serum total protein and albumin values in control calves were found to be 5.54±0.17 g/dL and 3.04±0.12 g/dL, respectively. The percentage of albumin (56.76±3.50%) calculated after electrophoresis were proportionate (Table 1 and Table 2). The relationship between the percentage of serum proteins and the degree of diarrhea and/or arthritis is presented (Table 3).
Table 1. The average values and statistical significances of sera biochemical parameters in healthy (control) and diseased calves with diarrhea and /or arthritis
Parameter Control group Diseased group p
n x Sx n x Sx Glucose (mg/dL) 6 99.33 1.90 17 71.58 4.76 p£0.001 Cholesterol (mg/dL) 7 112.57 11.88 18 57.33 4.61 p£0.001 AST (U/L) 6 41.83 4.00 17 48.58 5.93 p³0.05 ALT (U/L) 7 6.28 2.65 17 5.35 1.04 p³0.05 Urea (mg/dL) 7 17.73 2.79 17 41.54 5.29 p£0.001 Creatinine (mg/dL) 7 1.24 0.03 19 1.43 0.16 p³0.05 T-Protein (g/dL) 7 5.54 0.17 19 5.32 0.22 p³0.05 Albumin (g/dL) 7 3.04 0.12 19 2.75 0.07 p³0.05 Fe (mg/dL) 7 98.42 24.72 19 49.78 6.56 p³0.05 Uric acid (mg/dL) 7 1.05 0.09 19 1.57 0.20 p³0.05 LDH (U/L) 7 350.14 29.65 13 940.46 259.55 p£0.01 Table 2. Electrophoretic (native-PAGE) protein distribution as percentage of calves and statistical significances between the healthy (control) and diseased calves with diarrhea and / or arthritis
Parameter Control Group Diseased Group p
n X Sx n X Sx Albumin (%) 7 56.76 3.50 16 51.25 1.39 p³0.05 a1-globulin (%) 7 5.29 0.96 16 6.94 0.54 p£0.05 a2-globulin (%) 7 4.99 1.41 16 7.25 0.67 p£0.05 b-globulin (%) 7 10.42 0.85 16 12.55 0.65 p³0.05 g-globulin (%) 7 22.70 3.39 16 21.91 2.06 p³0.05
Table 3. The relation between serum protein percentages and the severity of with diarrhea and /or arthritis
Parameter Severe Mild Moderate p
n X±Sx n X±Sx n X±Sx
Serum Albumin 6 51.56±0.95 4 53.06±2.95 5 49.44±3.53 p³0.05 Seruma-globulin 6 13.15±1.58 4 14.54±1.07 5 15.18±2.63 p³0.05 Serumb-globulin 6 12.86±0.99 4 12.73±0.59 5 12.03±1.66 p³0.05 Serumg-globulin 6 20.74±3.81 4 19.73±2.25 5 23.33±5.41 p³0.05 In diseased animals a statistically significant rise in a1- and a2-globulin levels (p<0.05) were observed compared to the control group. In the remaining fractions, changes were not significant (Table 2).
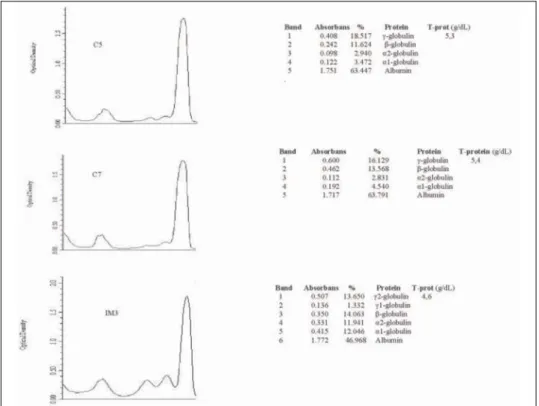
The detected bands by electrophoresis were a1-globulin, a2-globulin, b -globulin andg-globulins in healthy cows. Albumin followed byg-globulins were the predominant fractions (Figure 1).
Figure 1. Representative deansitometric distribution of serum proteins of calves (C:control; S: Surgery Clinics; IM: Internal medicine clinics)
DISCUSSION AND CONCLUSION
Newborn diarrhea is an intestinal disease induced by various factors. Many of the diseased animals have swellings at the joints (arthritis/polyarthritis) which cause restriction in movements and/or respiratory disorders (Brenneret al., 1993; Sahalet al., 1994; Hewicker-Trautwienet al., 2002; Svensson and Jensen, 2007). In the diseased animal group sixteen animals had polyarthritis, one of them received insufficient colostrum and another one had an umbilical infection. This finding is consistent with the explanation of Samsar and Akýn (2000) as lack of hygiene and colostrum intake are the principal causes of polyarthritis.
The data obtained in this study could not be classified because of two main factors. One reason is the difficulty in discriminating the stages of the disease such as onset of diarrhea and at the time of admission, arthritis may be already developed. Second factor is lack of available animals to be included in the study. Low blood glucose levels probably are the result of insufficient absorption caused by diarrhea. Right after delivery, newborn animals shift to sources of glucose from feedstuff rather than maternal sources. Between sucking periods glycogen reserves are utilized to maintain glycemia. In newborns, these sources are scarce and during starvation, an insufficiency can occur abruptly. Accordingly, newborn animals are dependent on glyconeogesis and susceptible to hypoglycemia (WHO, 1997; Kleinet al., 2002). Newborns have fewer resources of glyconeogenic precursors compared to adults (Kleinet al., 2002). In newborn calves diarrhea, the decrease in glucose levels is considered as a substantial loss because of the mentioned factors above. Age may also be an important factor in the decrease of glucose levels. In delivery, animals have high glucose concentrations and on consequent days the levels reach to the points of adults (Lipowitz, 1985). Glucose levels in 1-4 and 140-180 days Holstein cows are 2.8-7.5 mmol/L (50.4-135.0 mg/dL) and 2.3-5.8 mmol/L (41.4-104.4 mg/dL), respectively (Lumsden et al., 1980). In newborn calves after sucking the glucose levels are expected to be higher than 100 mg/dL (Rosenberger, 1979). In newborn calves glucose levels were found to be in the range 36-117 mg/dL (65.00±21.66) (Adamset al., 1993). In our study, the glucose levels of healthy calves are consistent with the earlier studies (Lipowitz, 1985).
Serum total cholesterol values in healthy and diarrheic cows are 112.57±11.88 and 57.33±4.61 respectively and these levels between groups are statistically significant (p<0.001) (Table 2). Normal levels in 1-14 and 14-180 day calves are 1.0-3.2 mmol/L (38.67-123.73 mg/dL) and 1.2-3.8 mmol/L (46.40-146.93 mg/dL) respectively (Lumsdenet al., 1980). Reporting values according to age intervals is more reliable (Mohri et al., 2007). Blood urea levels are significantly higher in diseased animals. (p<0.001). The difference among creatinine levels between groups was not significant (Table 1).
Serum nitrogen produced in newborn calves has been reported to be 2-14 mg/dL; calves in the first day (n=30) 4-12 mg/dL and 3-18 mg/dL calves at the third day after birth (n=30) (Mohriet al., 2007). The average value obtained in the group of healthy calves (Table 1) is not different from the reference values.
Significant increase in serum urea levels (p<0.001) with a not significant rise in creatinine and fall of albumin levels (p>0.05) may indicate the impact of diarrhea on the kidneys. As reported in previous studies the kidneys in newborn animals can be affected due to diarrhea (Altintas and Fidanci, 1993). Therefore, in diarrhea i.v. fluid-electrolyte replacement therapy is recommended (Sahalet al., 1994).
Serum creatinine levels are expected to be high as 0.9-2.5 mg/dL on delivery but in the following first and second day calves creatinine levels fall to 0.8-1.9 mg/dL as in adult animals (Adamset al., 1993). Creatinine levels in the control group (1.24±0.03 mg/dL) are coherent with the articles published earlier.
Mean levels of uric acid in healthy and diseased animals are 1.05±0.09 and 1.57±0.20 mg/dL, respectively and the difference between groups is not statistically significant (p>0.05) (Table 2). Normal serum uric acid levels for cows are expected to be 0.0-2.0 mg/dL (Kanekoet al., 1997; Altintas and Fidanci, 1993). It can be considered that the levels in the control group fall within the values indicated above.
Serum LDH activity in the control and diseased group are 350.14±29.65 and 940.46±259.55 U/L, respectively. In the diseased group it was significantly higher (p<0.01). AST and ALT difference between groups is not significant (Table 1). Normal ALT levels in Holstein cows at 1-14 days and 14-180 days are 2-11 and 3-18 U/L, respectively; AST is 12-48 and 18-50 U/L; LDH is 151-412 and 264-551 U/L, respectively (Lumsdenet al., 1980).
Serum AST, ALT and LDH activities for young cows are 71.3±6.2; 6.3±0.5 and 670.5±80.1 IU/L, respectively (Mouthon et al., 1975). In this study, the newborn calves enzymes activities were as follows; AST 3.77-16.32 IU/L; ALT 3.37-10.15 IU/L and LDH 232-738 IU/L and are compatible with the research reported by Trende and Milling (1982).
Kaneko et al. (1997) reported ALT, AST activity in 7-27 days old calves 2±3 IU/L and 25±6 IU/L, respectively and in 1-97 week calves ALT values were 18±12 IU/L and AST values were 24±17 IU/L. Rosenberger (1979) reported LDH activity 500-1500 IU/L, AST and ALT activity 10-50 IU/L and 5-20 IU/L, respectively. Long (1961) reported LDH activity as 200-650 IU/L.
Serum AST activity was reported to be 7-114 IU/L in newborn (n=30); 68-145 IU/L in one day old (n=30) and 39-178 IU/L (n=30) in two days old calves (Adamset al., 1993). There are no significant differences between the previously reported values of earlier studies and our study. It is appropriate to give the reference values of cows according to age groups (Mohriet al., 2007). Increase in LDH activity and urea levels, without the increase in ALT and AST activity is associated primarily with the intestinal tissue and skeletal muscles. Joint disease and periarticular tissue damage caused by the disease contribute to the increase, as well. In bovines the increase in serum LDH activity may indicate the loss of cell integrity and tissue damage (Meyer and Harvey, 1998).
The statistical difference in serum AST, ALT, creatinine, protein, albumin, iron and uric acid values between diseased and healthy groups was not significant (Table 1). Fe levels between groups were not statistically significant (p>0.05).
Total protein and albumin levels in 1-14 and 14-180 day old calves were 39-70 and 48-73 g/L, 22-33 and 25-38 g/L, respectively (Lumsdenet al., 1980). Total protein and albumin levels in healthy calves were 5.8 and 3.2 g/dL, respectively and a slight increase was observed in the following 24 days (Je`eket al., 2006).
Upon delivery serum g-globulins cannot be detected until receiving colostrum (Kanekoet al., 1997; Lumsdenet al., 1980; Adamset al., 1993). Serum albumin,aandb-globulins are also low in newborns. After birth in 6-46 weeksg -globulins have their lowest values and they have tendency to rise up to 10 years of age (Long, 1961).
Serum albumin levels in 1-14 and 14-180 days old calves were found to be 22-33 g/L and 25-38 g/L, respectively. Globulin levels in 1-14 and 14-180 days old calves were found to be 15-41 g/L and 19-40 g/L, respectively (Lumsdenet al., 1980).
Native PAGE analysis of healthy calves demonstrated 5 bands of a 1-globulin,a2-globulin,b-globulin andg-globulin (Figure 1). In calves with diarrhea and arthritis a1-, a2-gobulin fractions significantly increased (p<0.05) and the difference among other fractions were not statistically significant (Table 2). Similarly in camels and their calves serum protein pattern can be observed as a1,2; b1,2; and g-globulin bands. The b-globulin fraction is higher in calves (Chaudhary et al., 2003).
In our study the rise ina2-globulin levels is interpreted as an inflammation. In previous reports increase in a2-globulin levels was regarded as acute inflammation and b- and g-globulin increase in chronic disorders (Groulade, 1985). In animals, the increase in a1-globulin level does not imply a diagnostic value (Kanekoet al., 1997). In healthy cows averages of albumin 56.76±3.50%; a1-globulin 5.29±0.96%;a2-globulin 4.99_1.41% ;b-globulin 10.42±0.85% and g-globulin 22.70±3.39% were as indicated (Table 2). Reference values in 1-14 and 14-180 days old Holstein cows were in terms ofa-globulin 7-13 g/L,b1-globulin 6-12 g/L and 6-10 g/L,b2-globulin 1-9 g/L and 3-8 g/L andg-globulin 0.5-12 g/L and 1-144 g/L, respectively (Lumsden et al., 1980). Changes in g-globulin values (Table 2) are not statistically significant. The appearance of electrophoretic patterns varies among species (Trumelet al., 1996; Groulade, 1985). In all species g-globulin level reflect antibody levels and in some cases this fraction may represent abnormal proteins (Meyer and Harvey, 1998). Low Ig levels in newborns may indicate insufficient transfer of passive immunity (Mohri et al., 2007) and from this point of view all animals included in the study have taken colostrum of which just two of them had been vaccinated. Theg-globulin levels of animals included in the study are correlated with previous studies and deficiency symptoms were not observed. The difference between two groups was statistically not significant (Table 2). Nevertheless, the relation between serum protein fractions and clinical scoring of diarrhea and arthritis was statistically not significant (Table 3).
In conclusion, diarrhea and arthritis cause a significant decrease in blood glucose and cholesterol levels (p<0.001) in conjunction with the rise in urea and LDH levels (p<0.01). Acute inflammation leading to a significant increase ina 1-and a2-globulin (p<0.05) fractions accompanied with insignificant changes in
albumin, and total protein levels may implicate to be of prognostic and diagnostic value.
ACKNOWLEDGEMENT:
This study was supported by Ankara University Research Fund (2003-08-10-053). Address for correspondence:
Mert Pekcan, PhD
Ankara University, Faculty of Veterinary Medicine Department of Biochemistry
Diskapi, Ankara, Turkey E-mail: pekmertªyahoo.com
REFERENCES
1.Adams R, Garry FB, Aldridge BM, Holland MD, Odde KG,1993, Physiologic differences between twin and single born beef calves in the first two days of life,Cornell Vet, 83, 13-29.
2.Altintas A, Fidanci UR, 1993, Evcil hayvanlarda ve insanda kanin biyokimyasal normal degerleri, Ankara Univ Vet Fak Derg, 40, 173-86.
3. Altintas A, Sahal M, Celik S, Yasa Duru S, Uren, N, 2002, Ishalli buzagilarda idrar protein elektroforezinin onemi (Abstract). I. Ulusal Veteriner Biyokimya ve Klinik Biyokimya Kongresi, Bildiri ozetleri 21-22 Haziran 2002, Ankara, 39.
4.Brenner J, Elad D, Markovics A, Trainin Z,1993, Epidemiological study of neonatal calf diarrhoea in Israel- A one year survey of fecal samples, Isr J Vet Med, 48, 113-6.
5.Chaudhary ZI, Iqbal J, Rashid J,2003, Serum protein electrophoretic pattern in young and adult camels,Aust Vet J, 81, 625-6, 2003.
6.Groulade P,1985, Apercus sur l’electrophorese des proteins seriques en medecine veterinaire, et en particulier chez le chien,Bull Soc Vét Prat de France, 69, 235-68.
7. Hewicker-Trautwein M, Feldmann M, Kehler W, Schmidt R, Thiede S, Seeliger F et al., 2002, Outbreak of pneumonia and arthritis in beef calves associated withMycoplasma bovisand Mycoplasma californicum,Vet Rec, 151, 699-703.
8. HSI (Hoeffer Scientific Instruments), 1993, Hoeffer Protein Electrophoresis Applications Guide, San Francisco USA.
9.Kaneko JJ, Harvey JW, Bruss ML, 1997, Clinical Biochemistry of Domestic Animals. 5th ed. Toronto. Academic Press.
10.Karagul H, Altintas A, Fidanci UR, Sel T, 2002, Klinik Biyokimya. Medisan Yayinevi. Yayin Serisi: 45. 1. Baski-Ankara, 2000.
11.Klein KA, Clark C, Allen AL, 2002, Hypoglycemia in sick and moribund farmed elk calves.Can Vet J, 43, 778-81, 2002.
12.Kutsal A, Alpan O, Arpacik R,1990,Istatistik Uygulamalar. X+231. Bizim Buro Basimevi, Ankara. 13. Laemmli UK, 1970, Cleavage of structural proteins during the assembly of the head of
bacteriophage T4,Nature, 227, 680-5.
14.Lipowitz AJ,1985,Synovial Fluid. In: Textbook of Small Animal Orthopaedics, CD Newton and DM Nunamaker (Eds). 1985.
15.Long C, 1961, Biochemists Handbook. E. & F.N. Spon Ltd. London.
16.Lumsden JH, Mullen K, Rowe R,1980, Hematology and biochemistry reference values for female Holstein cattle.Can J Comp Med, 44, 24-31.
17.Meyer DJ, Harvey JW,1998,Veterinary Laboratory Medicine. Interpretation and Diagnosis. Second edition. W.B. Saunders Company, Philadelphia.
18.Mohri M, Sharifi K, Eidi S, 2007, Hematology and serum biochemistry of Holstein dairy calves: Age related changes and comparison with blood composition in adults,Res Vet Sci, 83 30-9. 19.Mouthon G, Roy JC, Magat A,1975, Diagnostic biochimique de la myopathie dégénérative des
20.Rosenberger G,1979, Clinical examination of Cattle, Verlag Paul Parey, Berlin, 136-7.
21.Sahal M, Kurtdede A, Borku K, Unsuren H, Ýmren HY, Ozlem MB et al.,1994, Yeni dogan ishalli buzagilarin klinik bulgulari ve asit baz dengesi dikkate alinarak sodyum bikarbonat ve elektrolitik sivilarla sagaltimi,Ankara Univ Vet Fak Derg,4, 599-625.
22.Samsar E, Akin F, 2000, Eklem hastaliklari, In: Genel Cerrahi. Medipress, 367-416.
23.Smith BP, 1996, Large Animal Internal Medicine. Diseases of Horses, Cattle, Sheep and Goats. Second edition, St. Louis, Mosby-Year Book, Inc., 396-417.
24.Svensson C, Jensen MB, 2007, Short communication: Identification of diseased calves by use of data from automatic milk feeders,J Dairy Sci, 90, 994-7.
25. Trumel C, Schelcher F, Braun JP, Guelfi JF, 1996, L’electrophorese des proteines sériques: principes d’interprétation chez le chien, le chat et le cheval.Revue Méd Vét, 147, 123-30. 26. Trende HJ, Mulling M, 1982, Enzymuntersuchungen im blutplasma von Kuhen und Kalbern
wahrend und nach der Geburt sowie in der amnion haut,Berl Munch Tierarztl Wschr, 95, 436-9. 27.Je`ek J, Klop~i~ M, Klinkon M, 2006, Influence of age on biochemical parameters in calves.Bull Vet
Inst Pulawy, 50, 211-4.
28.WHO (World Health Organization),1997, Hypoglycaemia of the newborn: Review of the literature. Retrieved from: http://www.who.int/maternal_child_adolescent/documents/chd_97_1/en/
BIOHEMIJSKE ANALIZE KRVNOG SERUMA I ELEKTROFOREZA NATIVNIH PROTEINA KOD TELADI SA DIAREJOM OBOLELIH OD ARTRITISA PEKCAN M, ALTINTAS A, KARAGUL HILAL, FIDANCI UR, UYSAL, BESALTI O, UNUBOL AYPAK SERAP, CIFTCI GULAY, BILGIHAN SIBEL i HANEDAN BASAK
SADR@AJ
U ovim ispitivanjima su vr{ene biohemijske analize krvnog seruma i elektro-foreza nativnih proteina seruma kod novoro|ene teladi sa dijarejom i obolele od artritisa, radi upore|ivanja promena vrednosti pojedinih parametara i klini~kih na-laza. Pri tome je osnovni cilj bio da se utvrdi zna~aj ovih promena u dijagnostici i prognostici oboljenja. Na osnovu rezultata klini~kih ispitivanja, telad je bila pode-ljene u dve grupe: bolesnu i zdravu. U krvnom serumu teledi je odre|ivana kon-centracija uree, kreatinina, albumina, ukupnih proteina, glukoze, ukupnog holes-terola, mokra}ne kiseline i gvo`|a kao i aktivnost enzima ALT, AST, LDH. Elektro-foreza serumskih proteina je vr{ena na poliakrilamidnom gelu (nPAGE), a analiza je vr{ena denzitometrom na 596 nm. Statisti~ka zna~ajnost utvr|enih razlika u srednjim vrednostima parametara, dobijenim za obe grupe, utvr|ivana je Kruskal-Wallis testom. Utvr|eno je da su pad koncentracije glukoze u serumu i vrednosti holesterola (p<0.001), pove}anje koncentracije uree, aktivnosti LDH i pove}anje koncentracijea1- ia2-globulina (p<0.01 i p<0.05 respektivno) povezani sa poja-vom bolesti. Zna~ajne promene u vrednostima biohemijskih parametara i klini~ko ispitivanje teladi ukazuju, da su pre svega, pad koncentracije glukoze i pove}anje koncentracije a-globulina, posledica akutne inflamacije i da mogu imati prog-nosti~ku vrednost.