Neural phase locking predicts BOLD response in human auditory cortex
Hiroyuki Oya
a,*, Phillip E. Gander
a, Christopher I. Petkov
b, Ralph Adolphs
c, Kirill V. Nourski
a,
Hiroto Kawasaki
a, Matthew A. Howard
a, Timothy D. Grif
fi
ths
da
Department of Neurosurgery, Human Brain Research Laboratory, University of Iowa, Iowa City, IA 52252, USA bInstitute of Neuroscience, Newcastle University Medical School, Newcastle, UK
cDivision of the Humanities and Social Sciences, California Institute of Technology, Pasadena, CA 91125, USA dWellcome Trust Centre for Neuroimaging, Institute of Neurology, University College London, UK
A R T I C L E I N F O Keywords: Neurovascular coupling Phase locking BOLD Auditory cortex Human Broadband power Gamma band A B S T R A C T
Natural environments elicit both phase-locked and non-phase-locked neural responses to the stimulus in the brain. The interpretation of the BOLD signal to date has been based on an association of the non-phase-locked power of high-frequency localfield potentials (LFPs), or the related spiking activity in single neurons or groups of neurons. Previous studies have not examined the prediction of the BOLD signal by phase-locked responses. We examined the relationship between the BOLD response and LFPs in the same nine human subjects from multiple corre-sponding points in the auditory cortex, using amplitude modulated pure tone stimuli of a duration to allow an analysis of phase locking of the sustained time period without contamination from the onset response. The results demonstrate that both phase locking at the modulation frequency and its harmonics, and the oscillatory power in gamma/high-gamma bands are required to predict the BOLD response. Biophysical models of BOLD signal gen-eration in auditory cortex therefore require revision and the incorporation of both phase locking to rhythmic sensory stimuli and power changes in the ensemble neural activity.
Introduction
The biophysical basis of the BOLD effect is magneticfield distortion caused by the existence of local deoxyhemoglobin; the response is generally considered to be a spatially and temporallyfiltered version of the ensemble neural activity. The measured BOLD effect reflects a com-plex function of cerebral bloodflow (CBF), cerebral blood volume (CBV) and energy demand in local brain tissue (cerebral metabolic rate of ox-ygen, CMRO2). Since the initial application of the BOLD effect in
neuroscience research, the relationship between BOLD signal and neuronal recordings (single-unit activity, multi-unit activity and LFPs) has been investigated in experimental animals and humans in both task-induced and resting conditions (Hermes et al., 2012; Logothetis et al., 2001; Ojemann et al., 2013; Viswanathan and Freeman, 2007; Winawer et al., 2013). These studies generally indicate that high-frequency power in the LFPs and thefiring rate of neural responses correlate positively with the BOLD response. A study in humans (Mukamel et al., 2005) examined the ability of single-unit spiking activity and LFPs recorded from the auditory cortex of two subjects to predict the BOLD response to a movie stimulus in a distinct normal population. Examination of the
LFPs showed that power above 20 Hz positively correlated with the BOLD response whilst power below 20 Hz negatively correlated with the BOLD response. Another study of visual stimuli that were regular in time assessed time locked and asynchronous LFP components and showed better correspondence between the BOLD response and the asynchronous component (Winawer et al., 2013).
However, current discussions address whether the relationship be-tween the BOLD response and neuronal signal, neurovascular coupling is underspecified (Bentley et al., 2016; Conner et al., 2011; Jabbi et al., 2015; Nir et al., 2007) and could be more complex. For example, uncoupling between CBV increase and power change in high-frequency LFP was observed in experimental animals (Huo et al., 2014) for rea-sons that are still not fully clear. Although the phase-coordination in the LFP (mostly at low frequencies below 8 Hz) has been highlighted in neurophysiological studies to be a signature of neural population response coordination, for example, in encoding the outcome of a visu-ally guided task (Lopour et al., 2013), in selective attention (Lakatos et al., 2008; Zion Golumbic et al., 2013) and in multisensory integration (Mercier et al., 2015), the relationship between LFP phase and bloodflow changes associated with the BOLD response has not been considered
* Corresponding author. Department of Neurosurgery, University of Iowa Hospitals and Clinics, 200 Hawkins drive, Iowa City 52242-1061, IA. USA.
E-mail address:[email protected](H. Oya).
Contents lists available atScienceDirect
NeuroImage
journal homepage:www.elsevier.com/locate/neuroimage
https://doi.org/10.1016/j.neuroimage.2017.12.051
Received 18 August 2017; Received in revised form 22 November 2017; Accepted 16 December 2017 Available online 22 December 2017
1053-8119/©2017 The Author(s). Published by Elsevier Inc. This is an open access article under the CC BY-NC-ND license (http://creativecommons.org/licenses/by-nc-nd/4.0/).
previously. We hypothesized that the phase of neuronal recordings may hold a predictive relationship with the BOLD signal. The auditory mo-dality is a good model system to study the general principles of phase locking and how it may relate to BOLD (Lakatos et al., 2008; Zion Golumbic et al., 2013).
We sought to predict the BOLD signal with neural recordings at local cortical sites in human auditory cortex using both LFP oscillatory power in different neural-frequency bands and phase information: specifically, phase locking to the sensory stimuli. We used amplitude-modulated pure tones and measured both power and phase alignment characteristics of the LFPs in response to the stimuli. Such amplitude-modulated stimuli have been used for examining tonotopic organization in the human auditory cortex (Formisano et al., 2003; Langers, 2014; Langers and van Dijk, 2012). The use of these repetitive and long duration (4 s) acoustic stimuli here allowed us to assess both power changes and phase locking to the stimulus in both the onset and sustained period as predictors of the BOLD response (Fig. 1). We analyzed the relationship between BOLD and LFP responses in a regression framework. The results show that phase locking of the LFP to the stimulus is an important contributor to the BOLD response in the human auditory cortex.
Materials and methods Subjects
Experiments were carried out on nine neurosurgical patients (age 23–47 y/o, 8 males and 1 female) with medically refractory epilepsy. The patients were implanted with chronic intracranial electrodes (either clinical or clinical-research macro-micro hybrid penetrating depth elec-trodes) for purposes of identifying a seizure focus that could be surgically resected. Temporal lobe surface and depth electrodes were placed in each subject, including a multi-contact electrode array positioned within the superior temporal plane including HG. In three subjects, a left sided HG electrode was placed, a right sided HG electrode was placed in the other six subjects. The preoperative workup included structural and functional MRI, neuropsychological testing and audiogram. Following implantation of the intracranial electrodes, subjects remained in the epilepsy moni-toring unit for approximately two weeks while continuous clinical LFPs and video recordings were obtained. Written informed consent was provided by all subjects. Placement of the electrodes was determined by the University of Iowa comprehensive epilepsy treatment program for clinical investigation of seizure focus. All protocols were approved by the University of Iowa Institutional Review Board. Subject demographics are presented inTable 1.
Intracranial electrode placement, localization and mapping onto subject and template brain surface
Depth electrodes were implanted as described previously (Howard et al., 1996; Reddy et al., 2010). Two different electrode designs were implanted between patients: one type was a clinical depth electrode with 6–8 cylindrical macro Pt-Ir contacts, the other was a hybrid clinical-research depth electrode that has 4 cylindrical macro Pt-Ir contacts and 14–15 Pt-Ir microwires. Inter-contact distance was 10 mm for the clinical depth electrode and approximately 2 mm for macro and micro contactson the hybrid depth electode. We inserted the depth electrode roughly parallel to the long axis of Heschl's gyrus under navigation. Inter-contact Fig. 1.Auditory stimulus design, example data from a single subject for LFP power and
phase locking.A,Auditory stimulus waveform and spectrogram of a stimulus with 1 kHz carrier frequency. The color scale indicates relative power on a logarithmic scale. Note the auditory stimulus contains recorded MRI scanning noise. Note that sparse sampling of the fMRI data acquisition (TR¼10 s). Averaged response is shown on the bottom. Onset period is 0–0.8 s and sustained period is 0.8–6 s after the tone stimulus onset.B,Examples of LFP power spectrum recorded from a site in Heschl's gyrus in response to the amplitude modulated tones (sustained period). Left panel shows power spectrum between 3 and 150 Hz and the right panel shows enlarged view of the left. Two kinds of responses are
clearly seen. Broadband high-frequency power increase in gamma and high-gamma fre-quency band (red arrow) on the left panel) and stimulus locked response at harmonic frequencies at 5 and 10 Hz (blue arrow).C,Phase locking in time-frequency domain at the site shown in panel B (thresholded at significance threshold, see Methods). Note that there is virtually no significant phase locking at frequencies higher than 30 Hz. D, Non-thresholded version of phase-locking above neural-frequency 30 Hz at the same site of panel B and C. Phase-locking values for each tone stimulus are shown separately. The same colormap is used as in panel C.
spacing is 2 mm Electrode contact locations were determined by identi-fying each contact on the post-implantation imaging studies (volumetric thin-sliced CT scans with 0.510.51 mm pixel dimension and 1.0 mm slice thickness and MRI with the same scan protocol as in the pre-operative MRI described in the next section), and then assigning a
loca-tion for that contact on the preoperative MRI (MPRAGE,
1.01.01.0 mm voxel size) as previously reported (Brugge et al., 2009) using custom made MATLAB programs. The depth electrode contacts that were localized in white matter were excluded from analysis (seeTable 2for included electrodes).
Functional MRI sessions and analysis
All subjects underwent an auditory functional MRI session pre-operatively (within 2 weeks before electrode implantation surgery). Auditory stimuli were amplitude modulated pure tones with carrier frequency of 0.5, 1.0, 4.0 (5.04 for subject 178L) kHz. We used a sparse sampling design (Hall et al., 1999) in which sounds of different tone frequency were presented in between the acquisition of functional brain images when the BOLD response to sound stimuli is measured. A no-tone condition (silence condition) was also added. The number of trials ranged from 33 to 38 for all conditions. The stimulus was 6.4 s in duration and was presented in the“silent”period by inserting a delay in the TR. The modulation rate was set to 5 Hz with rise and fall times of 10 ms (Han-ning windowed) and with a 75% duty cycle. The theta frequency mod-ulation rate we chose is well below the reported phase locking limit in the human auditory cortex and within the range of the temporal envelope of human speech (Nourski et al., 2009; Rosen, 1992). Stimulus delivery was controlled by Presentation software (Neurobehavioral systems, Berkeley, CA, USA). After passing through a sound level equalizer (Yamaha, model 02031B, Yamaha corporation, Buena Park, CA, USA), the auditory stimuli were delivered to the subjects through MRI compatible head-phones (Avotec Incorporated, Stuart, FL, USA). Gradient-echo single--band echo-planar imaging (EPI) was performed on a Siemens TIM Trio
3 T scanner using a 12-channel head coil with the following parameters: TR¼10 s, TE¼30 ms, Voxel size¼3.03.03.0 mm, no gap between
slices, Flip angle¼90 deg. Matrix size¼6868,
Band-width¼1935 Hz/Px, Interleaved acquisition, Number of slices¼40. Structural MRIs were obtained during the same imaging session using a MPRAGE sequence (1 mm isotropic voxels, TI¼1100 ms, TE¼3.52 ms, TR¼2.53 s, 2 vol averaged). Structural MRI data were further processed with FreeSurfer to perform whole brain surface reconstructions. Func-tional imaging data were analyzed with Analysis of FuncFunc-tional Neuro-Images (AFNI). Pre-processing included slice timing correction, motion correction, detrending with least squaresfit with Legendre polynomials up to 7and spatial smoothing with an 8 mm FWHM Gaussian kernel. For the creation of maps of the spatial distribution of GLM weights (Fig. 11A–C) spatial smoothing was not applied to the functional imaging data. Framewise displacement (FD) was calculated from the motion pa-rameters and we censored (applied a temporal mask) when FD>0.7 mm was observed. One volume prior to that volume was also censored. The first volume is always discarded from the modeling. We also applied image-based denoising using FIACH (Tierney et al., 2016) on the motion-corrected unsmoothed data. Mass-univariate general linear models (GLMs) were employed in single subject based analyses. All GLMs were performed in each subject's original space. Sound-induced BOLD responses were modeled with one parameter gamma basis functions convolved with a boxcar function of the sound duration. 6 principal components derived from the FIACH algorithm were included as nuisance regressors. The BOLD responses were mapped onto the subject's brain surface. Because of the complexity of the anatomy of the human superior temporal plane and inter individual variability, simple transfer of standard brain coordinates (e.g., MNI coordinates) onto the template brain is problematic for this type of study. To address this problem, a non-linear spherical surface registration (Fischl et al., 1999) was utilized (we used default penalization parameters) to match gross anatomical features across subjects. We chose to use the ICBM152 Nonlinear asym-metrical brain as the template (Fonov et al., 2011). The group-level Table 1
Subject demographics.
Subject ID Age Gender Language Dominance
Handedness Audiogram (0.25–4 kHz)
Surgical treatment
178L 47 Male Left Right Normal No resection
180R 36 Female Left Left Normal Right ATL
186R 28 Male Left Right Normal Right ATL
198R 23 Male Left Right Normal Right temporal cavernoma Resection 206L 48 Male Left Right 50 dB at 4 kHz
(left ear)
Left ATL
210R 33 Male Left Right 25 dB at 4 kHz (left ear)
Right inferior temporal lobe resection 307L 29 Male Left Right 40 dB at 4 khz
(right ear)
Left insular cavernoma resection
330R 43 Male – Left Normal Right occipital and inforior temporal cortex resection 334R 39 Male Left Left 35 and25 dB at 4 kHz (right and left, respectively) Right ATL
Table 2
Depth electrode contacts.
Subject ID Contact ID (Assigned from the tip of each depth electrode)
1 2 3 4 5 6 7 8 9 10 11 12 13 14 15 16 17 18 19 178L o o o o o o o o o o o o o o o o o o o 180R x o o o o o o o o o o o o o o x x x x 186R x x x x x x o o o o o o o o o o o o 198R x x x x x o o o o o o o o o o o o o 206L x o o o o x 210R o o o o o o o o o o o o o o o o o x 307L o o o o o o o o 330R x o o o o o 334R o o o o o o x x
o: Depth electrode contacts included in the analysis. x: Depth electrode contacts not included in the analysis.
preferred tone frequency map was created by averaging the individual preferred tone-frequency map after the non-linear surface-based warping mentioned above.
Local Field Potential (LFP) recording sessions and analysis
LFP recordings using the same auditory stimulus were conducted during the epilepsy monitoring period (between 2 and 14 days after the electrode implantation surgery) in a specially designed clinical-research room that is electrically shielded at the Institute for Clinical and Trans-lational Science at the University of Iowa. Depth electrode (Ad-Tech Medical, Racine, WI, USA) LFP signals were digitized at 2034.5 Hz (macro contacts) and 12207 Hz (micro contacts) using a digital recording system (Tucker-Davis technologies, PZ2 amplifier and RZ2 processor, Alachua, FL, USA). Sound intensity was calibrated with Golay-pairs (Zhou et al., 1992). The signals were band-passfiltered (1.6–1000 Hz) and stored for offline analysis. Digitized data were down-sampled to 500 Hz for further analyses. Trial rejection according to an amplitude threshold was applied using data between 1 s before and 6.4 s after the stimulus onset. The amplitude threshold for the trial rejection was set to the 75 percentile point plus 3 times inter-quartile range calculated from all the rectified trials within the time window after subtraction of the mean waveform. We replicated the auditory environment heard by the patient during the fMRI study, including the amplitude modulated pure tone test stimuli as well as scanning noise and other environmental noise, such as gradient switching noise, pump and fan noise. These environ-mental noises were also presented in the silence condition. The auditory stimuli presented during the electrophysiological recording experiments (Fig. 1A) exactly reproduced the sounds heard by subjects during the pre-operative fMRI experiment (see previous section regarding the auditory stimulus). To achieve this, audio recordings were obtained from a microphone positioned within the MRI compatible headphones during functional MRI scanning. As in the fMRI session, the subjects were asked to passively listen to the sounds. Stimulus presentation was controlled by Presentation software as used in the fMRI session. Stimuli were presented through earphones (ER-4, Etymotic research, Inc., Elk Grove, IL, USA) inserted into a custom-made ear mold.
LFPs in the human auditory cortex during the stimulus presentation contain both stimulus-locked and asynchronous components as shown in the power spectrum in Fig. 1B. We extracted the non-phase locked (asynchronous or induced) component by subtracting the locked responses from the single trial raw LFP traces. The stimulus-locked response was approximated by an averaging procedure with bootstrapping. Namely, we randomly resampled 30 trials with replace-ment across the tone stimulus categories. This procedure was repeated the same number of times as the number of stimulus presentations (33–38 times). These stimulus-locked responses were subtracted from the raw LFP signals (Crone et al., 2001). The resulting induced responses were subjected to spectral analysis. For this, we decomposed the single-trial induced LFP using multi-taper spectral analysis. A sliding time window with a duration of 500 ms with 75% overlap was used above the 5 Hz neural-frequency component. For the low neural-frequency com-ponents below 5 Hz, we used a longer time window of 1200 ms. Three Slepian tapers were used for both settings. LFP power change from the silence condition was calculated as follows. LFP power was logarithmi-cally transformed and the median value in the silence condition was subtracted to yield relative change of the band power from the reference (silence) condition in dB scale (Fig. 2A).
The stimulus-locked response seen in the power spectrum (Fig. 1B) is not guaranteed to be phase-locked. Therefore, we further evaluated the degree of phase locking by calculating the phase locking values (PLV) (Goldberg and Brown, 1969) using analytic signals derived from band-passfiltered LFP data (600 order no group-delay hamming windowed FIR filter, passband width at6 dB is 2 Hz). We evaluated the PLV between 2 and 100 Hz and the results showed most of the phase locking occurred at harmonics (up to 6-th) of the driving frequency (5 Hz) in the time
window of interest (sustained period, see below), therefore phase locking analysis was focused on the above 6 frequencies (Fig. 1C).
18 LFP features were extracted as follows. Induced asynchronous LFP power in the onset (0–0.8 s after stimulus onset) and sustained periods (0.8–6.0 s after stimulus onset) in the following neural-frequency bands (delta: 1.0–4.0 Hz, theta: 4.0–8.0 Hz, alpha: 8.0–15 Hz, beta: 15–30 Hz, gamma: 30–50 Hz and high gamma: 70–150 Hz) was calculated and relative change from the silence condition was found in dB scale as explained above. PLV was computed up to the 6 t h harmonic (5, 10, 15, 20, 25, and 30 Hz). The significance of these band-power changes and phase locking (PLV) was found by bootstrapping the data in the silence (no tone) condition (trial randomization with replacement, 500 times). Values above 97.5% or below 2.5% for power changes and above 95% for PLV were considered to be significant.
General linear model (GLM) analysis
We used a linear regression framework to examine the relationship between BOLD responses (Y) and LFP features (X: power change from the silence condition and phase-locking at different frequencies). The design matrix X comprises the following 18 LFP features: 1, Averaged induced power change from the silence condition (6 bands) within the onset period. 2, Averaged induced power change from the silence condition in the sustained period (6 bands). 3, Averaged phase-locking (PLV) at 6 harmonic frequencies in the sustained period. We repeated the bootstrap for creating the input design matrix 100 times for each tone stimulus condition. The input design matrix (LFP data) was standardized with respect to their mean and standard deviation before the regression ana-lyses. The observation variable (Y) is composed of the beta coefficients from bootstrapped fMRI GLM analysis. We divided the data matrix X into test and training sets. The GLM was built from training data sets using 90% of the data points and this model was tested on the remaining 10% of the data. The modeling was repeated 60 times with new resampling. Mean beta values were used for variable importance for prediction of the BOLD response. Since there is no trial correspondence between the LFP session and the fMRI session (BOLD and LFP data were not simulta-neously obtained), this procedure basically conducted a signal correla-tion with bootstrapped samples. Pearson correlacorrela-tion coefficients between the model outputs and the target and mean squared errors (MSE) of the model were computed as the indicator of modelfitting. The correlation coefficients were Fisher transformed, and if the mean Fisher transformed correlation coefficient was larger than 2 times the standard error of the mean, the modelfitting was considered significant (Fig. 2B). We also performed separate GLMs using shuffled data (300 times, shuffled without regard to tone stimulus condition). LFP features with regression Beta values that exceeded 90% of the shuffled GLM Beta distribution were considered as significant.
Mixed-effects general linear model (LME-GLM)
To generalize the overall regression results across our subjects to the population, we considered electrode location as a random factor and carried out linear mixed-effects GLM modeling (LME-GLM) using data-sets from contacts that showed statistically significantfitting in the GLM across all nine subjects. The same 18 LFP features (Onset and sustained power in six neural-frequency bands and six phase-locking frequencies) were treated as afixed-effect and contact was treated as a random factor (includes intercepts). The same bootstrapping was applied as in each contact-level GLM regression. Averaged beta values for LFP features were calculated and features that showed P<.05 were considered significant. Given the inherent uncertainty of electrode localization and functional-structural volume registration we also examined the effect of voxel shift on the GLM model results. Functional volumes were shifted along the z-axis up to 4 voxels and the same GLM procedure was applied to the shifted functional data. Overallfitting was assessed by calculating log-likelihood of the LME-GLM.
Effect of relative magnitude of power and phase-locking metrics on the GLM beta
A potential confounding factor for interpreting the GLM betas is the relative SNR or magnitude differences among the LFP features, especially between power change and phase-locking metrics (PLV). We normalized the design matrix in terms of each LFP feature's standard deviation before the GLM procedure. We also examined the potential systematic rela-tionship between GLM betas and relative magnitude for power and PLV by calculatingPPratioas below:
sPower¼abs½Power change=sdðpower changeÞ
sPhase locking¼PLV=sdðPLVÞ
PPratio¼ sPower
ðsPowerþsPhase lockingÞ
We examined the relationship between the PPratio and GLM betas for high-frequency induced LFP power (gamma and high-gamma band).
Spatial map of LFP feature contribution to the GLM models
Spatial organization of GLM beta weights within Heschl's gyrus was examined as follows. We divided the contact locations into 3 categories, that is, recording sites where only GLM betas for gamma/high-gamma band power is significant (power only sites), sites where only GLM betas for phase-locking is significant (phase-locking only sites) and sites where both GLM betas for gamma/high-gamma band power and phase-locking is significant (both power and phase-locking contributing site). For this analysis, we obtained GLM results usingnon-smoothed functional MRI data as described before. A total of 64 recording sites localized in the gray matter were included for this analysis. The percentage of these categorized recording sites are shown in a bar graph (Fig. 11A) and the color-coded recording sites are mapped onto the MNI template surface (Fig. 11B). The degree of the relative contribution between power vs phase-locking in the GLM model was found by calculating the difference between maximum GLM beta for gamma/high-gamma power for both the onset and sustained periods and that for phase-locking at 5 Hz and its harmonics. These values are also mapped onto the MNI template. Heat-kernel smoothing with 2 mm sigma was applied for 1st order neighbors on the surface (Fig. 11C).
Fig. 2.GLM modeling andfitting evaluation.A.Creating the design matrix for the GLM. Averaged potentials were calculated from the raw LFP data bootstrapped within the tone stimulus frequency (upper row, second panel) and these were subtracted from the raw LFP traces to estimate the asynchronous induced LFPs (upper row, third trace). Multi-taper spectrograms were constructed from these induced LFPs (upper row, rightmost panel). Red and black box show onset and sustained period, respectively. Phase locking across trials were also computed from bootstrapped raw LFP traces by applying the bandpassfiltering (second row). These power and phase locking measurements are put into the matrix and standardized with respect to each feature's standard deviation.B.Evaluating the modelfit. Fitting was done using training data and the resulted model was tested on the test data. Correlation coefficients between model prediction and target were calculated (left panel). Inset indicates comparison of the mean squared error distribution calculated from the real data (red) and shuffled data (gray). Dis-tribution of the correlation coefficients between the model prediction and the target calculated for 60 contacts over nine subjects is shown on the right. Orange bar indicates contacts where GLMfit is significant.
Results
Electrode placement
The depth electrode contacts that were situated in gray matter were plotted onto each individual's brain as well as onto the ICBM152 tem-plate brain surface inFig. 3. Overall, depth electrodes with a total of 120 contacts were implanted in nine patients and 98 contacts were localized within the gray matter. Since there is large variability in Heschl's gyrus (HG) anatomy between patients, the gross anatomical features of the superior temporal plane were mapped onto the template brain using spherical surface non-linear morphing (see Methods). The locations of the HG electrode contacts varied between subjects. In each subject, however, an array of electrodes was successfully placed in gray matter close to the long axis of HG with a tendency for the placement to be toward the anterior slope of the gyrus (except for 330R in which the electrode traversed across HG).
BOLD preferred stimulus frequency map
Previous human functional imaging studies based on the BOLD response (Da Costa et al., 2011; De Martino et al., 2015; Formisano et al., 2003; Langers, 2014; Saenz and Langers, 2014; Talavage et al., 2004; Woods et al., 2009, 2010), reviewed in (Baumann et al., 2013), have examined the mapping of the tone frequency response of human auditory cortex based on the BOLD response. These studies converge in suggesting a sound frequency preference for high frequency tones in the medial part of HG on the superior temporal plane, and for low frequency tones in the lateral part of HG in between the high-frequency areas. Opportunities to map sound-frequency representation in humans based on direct re-cordings from neurons or neuronal ensembles are much more limited than in primate models in which cortical tonotopic patterns are well
described (Merzenich and Brugge, 1973; Morel et al., 1993; Philibert et al., 2005). In this study, we have demonstrated a pattern of tonotopic mapping using human neurophysiology that confirms the previous pat-terns based on the BOLD response.
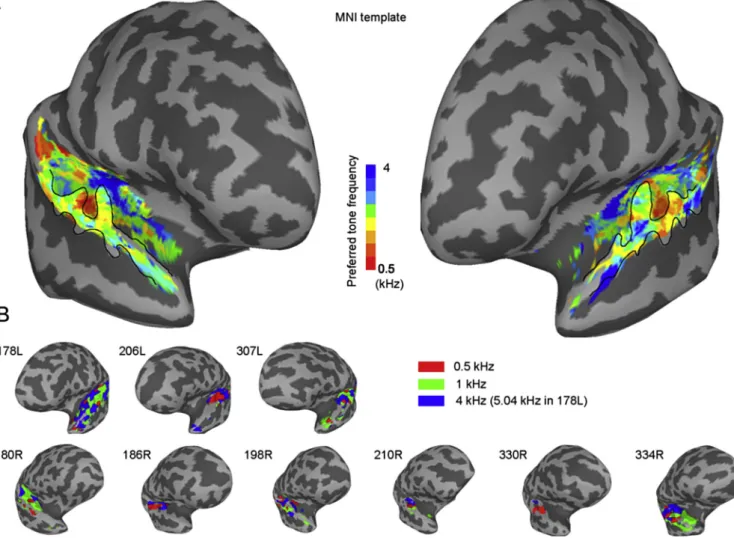
The BOLD response to each of the tone stimuli (carrier frequencies 0.5 kHz, 1.0 kHz and 4.0 kHz in all subjects except 178L who was given 5.04 kHz for the highest frequency) was used to define the preferred tone frequency of voxels within the superior temporal plane for each subject. BOLD responses and the preferred tone frequency, defined as the stim-ulus tone frequency producing the largest F-value, are shown inFig. 4. A preferred tone frequency was defined for all voxels that showed a sig-nificant response to sound, with correction for multiple comparisons in the temporal lobe.Fig. 4A shows the group preferred tone frequency data projected onto the ICBM152 template brain andFig. 4B shows the data for all individual subjects. The tonotopic map in the group and in indi-vidual patients is generally in agreement with other reports (Da Costa et al., 2011; De Martino et al., 2015; Formisano et al., 2003; Langers, 2014; Langers et al., 2014a, 2014b; Moerel et al., 2014; Saenz and Langers, 2014; Talavage et al., 2004; Woods et al., 2009, 2010) of the tonotopic organization of the human auditory cortex, with a medially pointing ‘V’ shaped arrangement of high tone-frequency preferring voxels, where the point of the‘V’is in the region of medial HG, and a region of low tone-frequency preferring voxels is defined between the arms of the‘V’. For a comprehensive review on this topic, please see (Brewer and Barton, 2016). The electrode contacts can be seen to be situated in voxels with different tone frequency preference within this arrangement. Out of 98 contacts that are localized within the gray matter in the superior temporal plane or very close to the pial surface of the superior temporal plane (180R contact 16 and 17), 60 contacts were situated in the region that showed a significant BOLD response to the sound stimuli.
Fig. 3. Electrode contact locations for each subject. Gray scale indicates binary curvature values (gyri are white and sulci are black) plotted onto individual inflated superior temporal plane patches with electrode contact locations (left panels). Surface-based non-linear warping was performed to project the contact locations from each individual subject onto the ICBM 152 asymmetric template brain. Only the contacts localized in gray matter are shown. HG: Heschl's gyrus, STG: Superior temporal gyrus.
LFP phase locking to the stimuli can occur without increases in high neural-frequency power
As shown inFig. 1B, the typical power increase in the high neural-frequency region (gamma and high-gamma band) showed broadband raise in the power spectrum from approximately 20–160 Hz and this high neural-frequency power increase does not show any significant phase locking to the stimulus, confirming the asynchronous feature of the response (Miller et al., 2014; Xing et al., 2012). The stimulus-locked components are clearly observed as a narrow-band power increase and usually show high PLV (Fig. 1C). Overall, for both onset and sustained periods, the tone stimulus induced a similar response profile across neural-frequency bands. Namely, reduction of delta band power and increase of gamma and high-gamma band power occurred with and increasing trend across the neural-frequency (Fig. 5A). We examined the relationship between high neural-frequency power response (gamma and high-gamma band) and maximum phase locking (across 3 tone-frequency conditions). Data from 52 sites that showed significant GLMfitting are shown inFig. 5B. For both onset and sustained periods, significant phase locking could still be observed when the power increase in the gamma and high-gamma band was non-significant (blue circles inFig. 5B).
Figs. 6–8show BOLD and LFP data in 6 different cortical sites that showed significant BOLD response to the auditory stimulus. Panels A and E in Figs. 6–8 show thresholded (FDR in superior temporal plane, q<0.05) overall BOLD response overlaid onto the subject's MRI volumes to the three different auditory stimuli. It is notable that there are sites
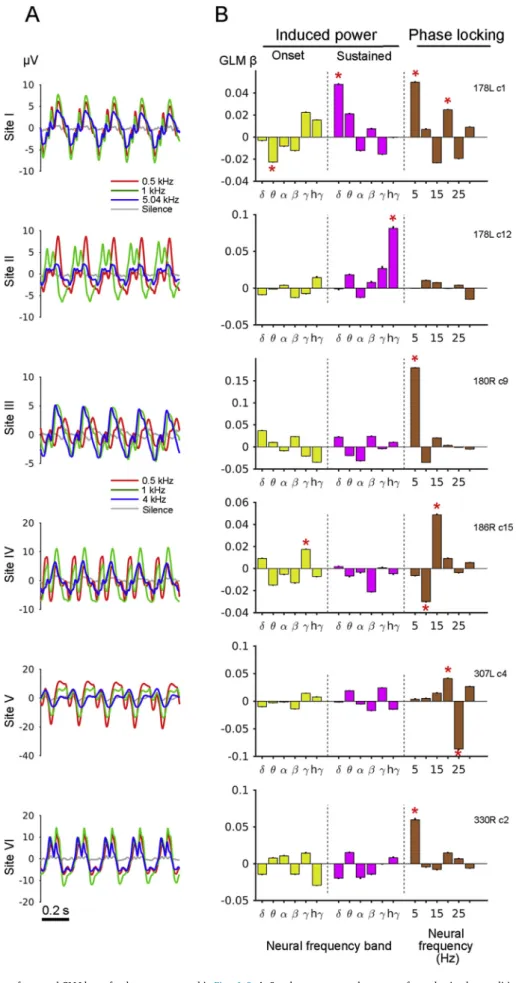
showing no significant increase in high neural-frequency (gamma and high gamma) LFP power, but clear phase locking to the amplitude modulated tone stimulus (Fig. 6C and D,Fig. 7C, D and G, H,Fig. 8C, D and G, H). Significant phase locking to the amplitude modulated input was not restricted to the fundamental of the modulation waveform (5 Hz), but was also seen at higher-harmonics usually up to 30 Hz (Panels D and H inFigs. 6–8). The power spectrum of the stimulus is dominated by the frequency of the tone (carrier frequency), but the spectrum of the modulation waveform contains multiple harmonics of 5 Hz. The analyses show that significant phase locking of the LFP occurs to these harmonics indicating sensitivity to the sound envelope. No significant gamma or high-gamma band phase locking in the induced LFP component was detected. Across the LFP features, significant response of the sustained power above the alpha neural-frequency band tended to be less frequent (for gamma and high-gamma band, seeFig. 9B), but other LFP features showed a significant response in at least 40% of all sites analyzed. The steady-state LFP waveforms (Fig. 9A) show complex morphology, consistent with the presence of higher harmonics in the phase-locked response to the stimulus modulation. These waveforms also show markedly different morphology across sites and subjects (note that sites I and II are from the same subject). In the dataset we analyzed, among the sites that showed significant phase locking at any of six harmonic fre-quencies (40 sites out of 60), significant high gamma power increase could only be observed in 50% (20 sites out of 40) in either the onset or sustained periods.
Fig. 4.fMRI activation maps.A,Group averaged BOLD preferred tone frequency maps in the superior temporal plane and superior temporal gyrus constructed from nine subjects mapped onto the template brain in the MNI space.B,BOLD data from single subjects. Preferred tone frequency maps of individual subjects mapped onto each individual's inflated brain. Thresholded at FDR¼0.05 within the temporal lobe.
LFP phase locking predicts the BOLD response in individual contacts The relationship between the BOLD response and LFPs was assessed with GLM for each electrode site. Onset as well as sustained induced LFP power in six neural-frequency bands and a phase locking metric (PLV; see Methods) at thefirst to sixth harmonic frequencies were computed. All the LFP features without regard to their significance were entered the regression model (see Methods) given the potential importance of sub-threshold fluctuation of these features. The regression coefficients of the models (beta values) indicate the effect of each feature on the BOLD response. Overall,fitting was significant for 52 sites out of 60 contacts where significant BOLD responses were obtained (Fisher Z transformed correlation coefficients between model predictions and target values with cross-validation>2SE). GLM beta values from model fitting at single sites using the data presented inFigs. 6–8are shown inFig. 9B. Modelfitting was evaluated by applying the GLM built using the training data to the separate test dataset and calculating the correlation between target and the model prediction. The significance of each beta was accessed with a separate GLM with shuffled trials (see Methods). Site II shows significant broadband power increase in gamma and high-gamma band range (Fig. 6G) in the sustained period and this broadband high neural-frequency power is the main contributor for predicting the BOLD response consistent with prior work (Winawer et al., 2013). On the other hand, other contacts (site I, III, IV, V and VI) do not show significant increase in high neural-frequency power (note: using the original LFP signal and not the induced LFP). For these recording sites, the main contributor for predicting BOLD is the phase-locking to different har-monics of the repetition rate of the stimulus.
Population regression results across subjects and contacts
We accessed the overall modelfitting across 52 sites (over nine sub-jects) that show significant GLMfitting at single contacts with a linear mixed-effects GLM (LME-GLM). Beta values of the LME-GLM are shown inFig. 10A. As described in previous studies, onset and sustained induced high gamma band power significantly predicts the BOLD signal. LME-GLM Beta values increase as LFP frequency increases for onset induced power features. The data also corroborate the negative correlation be-tween low neural-frequency LFP power and the BOLD response. In particular, the coefficients for onset delta band power and sustained alpha band power are large, significant and negative (LME t-test, p<106and p<1010, respectively). The most strikingfinding is the significant positive weights for the PLV. High positive coefficients for the
phase locking are seen at multiple harmonic frequencies at 5, 20 and 30 Hz (LME t-test, p<1010, p<106 and p<106, respectively) consistent with the responses being driven by a complex stimulus waveform. These weights also exceed the significant threshold deter-mined by the random shuffling procedure (95 percentile point, see Methods).
A potential confound of this analysis would be the effect of mean response magnitude difference between the input features. Therefore, we normalized the input design matrix in terms of their standard deviation. We have also assessed the potential effect of SNR/magnitude differences between power measurements and phase-locking metrics on the GLM betas. PPratio was computed (see Methods) and the scatter plots for PPratio and GLM betas were examined. Relationship between the PPratio (for high-gamma power and 5 Hz PLV) and GLM beta for high-gamma power are shown inFig. 10B for onset and sustained period separately. There was no significant relationship between the two (all p>.2, Pear-son's r¼ 0.12 and0.17 for onset and sustained periods, respectively). Coregistration between functional and structural scans and electrode contact localization has uncertainties due to electrode size and spatial resolution of the imaging data. We have examined thefitting when the functional volumes were shifted in z-direction (see Methods) to evaluate the effect of voxel shift. Log-likelihood of the LME-GLM shows a sharp decline over 2-voxel shift and high plateau within 1 voxel shift, indi-cating coregistration and contact localization is closely coupled (Sup-plementary Fig. 5).
Spatial pattern of GLM regression beta weights
The percentage of sites where the main beta weight contribution is either gamma/high-gamma band power, phase-locking, or both power and phase-locking are plotted in a bar-graph inFig. 11A. 61% of the sites show significant GLM weights both in power and phase-locking. 15.6% and 23.4% of the sites show power only and phase-locking only contri-bution for predicting the BOLD response, respectively. Spatial distribu-tion of these sites is shown inFig. 11B. There is a trend that the antero-lateral part of Heschl's gyrus has more“phase-locking only”contributing sites, and this can also be seen in the GLM weight difference map on Fig. 11C. However, given the relatively sparse spatial sampling within Heschl's gyrus in our dataset, we do not attempt to relate this trend to parcellation maps created with cytoarchitecture, tonotopy or perio-dotopy. For a review of these parcellation, see (Brewer and Barton, 2016).
Fig. 5.Overall LFP induced power response and relationship between high-frequency power and phase locking.A.Overall induced power response to the tone stimulus from 52 contacts that show significant GLM modelfit. Largest response within the 3 tone frequencies are shown separately for onset and sustained period (bar indicates se).B.Relationship between phase locking and high-frequency (gamma and high-gamma band) power. Highest induced power response within gamma or high-gamma band, and highest phase locking within 6 harmonic frequencies are plotted. Red circles indicate significant power response in the gamma or high-gamma band. Blue circles indicate the power responses are not significant but showed significant phase locking. Black circles indicate both power and phase locking is not significant.
Fig. 6.BOLD and LFP responses in representative contacts.A and E, Thresholded BOLD response overlaid onto the subject pre-electrode implantation volumetric MRI. Overall GLM modelfit (F-value) is shown. Blue haircross indicates contacts location.B and F.GLM betas for each tone stimulus. Color indicates stimulus tone frequency (red: 0.5 kHz, green: 1 kHz, blue 4 or 5.04 k Hz).C and G.Power spectrums (multi-taper method) of the LFP data recorded from the sites shown in A and E, respectively. Line color indicates stimulus conditions (red: 0.5 kHz, green: 1 kHz, blue 4 or 5.04 k Hz and gray: no tone). Enlarged spectrums are shown in insets. Note, the power spectrums are calculated using original LFP signals and not using induced (stimulus-locked response subtracted) LFPs. n.s. indicates non-significant power change in induced high-frequency (gamma or high-gamma band) LFP power. Note that the second example shown in G clearly shows significant broadband power increase in both onset and sustained period (*). Increased stimulus locked power at multiple harmonics is also seen (black arrows).D and H.Bar graphs showing phase locking values (PLV) of the LFP recordings at the same sites for each tone conditions and at 6 harmonic frequencies. Color indicates stimulus frequency as above.
Fig. 8.Examples of BOLD and LFP responses in different subjects. The same format is used as inFig. 6.
Fig. 9.Steady-state response waveforms and GLM betas for datasets presented inFigs. 6–8.A,Steady state averaged responses for each stimulus conditions. Note the complex waveform morphology. Driving frequency is 5 Hz.B,GLM beta values for each LFP features from datasets presented inFigs. 6–8indicate significant LFP features (indicated by asterisks. above 95% point from bootstrapped GLM with the shuffled data). Phase locking features have the highest beta in sites except for site II where significant broadband increase in power is seen.
Discussion
To our knowledge, this is thefirst study to systematically examine the combined contribution of induced asynchronous (non-phase locked) and stimulus-locked (phase-locked) LFP power to the prediction of the BOLD response in the human cortex. We examined the relationship between LFPs and the BOLD response in the same nine subjects recorded from depth electrodes placed in the auditory cortex using an identical stimu-lation paradigm for both BOLD functional imaging and electrophysio-logical recording sessions. We extracted the induced component from the raw LFP in different neural-frequency bands and measured phase locking to the tone bursts at the burst rate and its harmonics. These power and phase locking features were used to predict BOLD responses in a GLM framework.
Our results demonstrate the following: (1) Significant LFP phase locking to the modulation waveform of the stimulus at the modulation rate and its harmonics, (2) Asynchronous broadband power in the gamma and high-gamma neural-frequency band is significantly corre-lated with the BOLD response, (3) LFP phase locking can be observed without increase in power in high neural-frequency LFP oscillations (asynchronous broadband power increase) and (4) LFP phase locking contributes significantly to predicting BOLD responses.
As in previous work, we demonstrate a relationship between high neural-frequency activity in the LFP (high-gamma band and broadband
power that is not phase locked to the stimulus) and the BOLD response in individual electrodes and in the whole dataset. However, in contrast to these previousfindings, our data also show that phase locking to the external stimulus and not high neural-frequency power predicts the BOLD response more robustly in a large number of individual electrode contacts. We found that most of the contacts that did not show significant increase in gamma or high gamma band power (calculated from the raw-LFP signal) still exhibited significant phase locking (20 out of 38 sites).
Positive correlation between LFP power in the gamma or high-gamma neural-frequency band and BOLD signal has been reported in an earlier human study (Mukamel et al., 2005) that examined the ability of single-unit spiking activity and LFPs recorded from two subjects to pre-dict the BOLD response in auditory cortex to a movie in a distinct normal population. In this study, we used repeated presentation of an identical stimulus associated with temporal regularity to allow the measurement of electrophysiological phase locking as well as induced asynchronous power changes as a predictor of the BOLD response at the same cortical position in the same patients. An MEG study based on grand-average response time-course, which is basically a phase locked response, using click trains showed the transient component in the MEG signal was tightly coupled to the BOLD response (Gutschalk et al., 2010), but explicit neural-frequency decomposition of the power and separation of the phase locking critical for examining the contribution of phase locked responses was not done in that report. Previous studies of the basis for the Fig. 10.A.Overall results of modelfit. Coefficients obtained from the linear mixed-effect model (LME-GLM) on the data from 52 sites from nine subjects. We considered depth-electrode contacts as random factor with intercepts. Beta coefficients are shown with their standard-error. Asterisks show statistically significant LFP features (P<.05).B.Effect of relative amplitude between power and phase locking on the GLM model betas. Power-phase locking ratios (PPratio, see methods) were calculated for 52 sites for onset and sustained period separately. There is no significant relationship between the two.
BOLD response in a primate visual model (Logothetis et al., 2001) also linked the response to high neural-frequency oscillations in LFP, but we are not aware of any primate work that links the BOLD response to temporal phase locking.
Phase of neural oscillatory activity has been found to be important for visual perception and attentional selection (VanRullen et al., 2014). For
example, the detection of near threshold sensory stimuli is modulated by the phase of slow frequency LFP. In the auditory domain, the importance of phase entrainment in speech perception and auditory attention has been documented (Ng et al., 2012; Peelle and Davis, 2012; Schroeder and Lakatos, 2009). Furthermore, recent behavioral experiments in humans suggest that the phase dependency on the detection of sensory stimuli Fig. 11.A.Percentage of recording sites that have different types of relationship between the LFP features and the BOLD response. 64 sites localized in the gray matter and have significant GLMfitting are included. Power only and phase locking only indicate the only GLM betas associated with the gamma/high-gamma power or phase-locking show significant contribution, respectively. Both (gray color) indicates number of sites where both gamma/high-gamma power and phase-locking contributed to the model.B.Spatial distribution of the sites divided into the 3 categories according to the GLM beta weights as used in panel A shown on the MNI template cortical surface.C.Spatial distribution of difference of maximum GLM betas for gamma/ high-gamma power and for phase-locking that shows the preferential contribution of LFP features for BOLD signal prediction. Warm color indicates it is biased towards power and cool color indicates it is biased towards phase-locking. Note, non-smoothed functional MRI data is used for these Fig.s. Total N¼64 (number of sites localized in the gray matter and shows significant GLMfitting using non-smoothed fMRI data).
can be across sensory modality (Fiebelkorn et al., 2011), and endogenous (not stimulus-evoked) phase entrainment facilitates buildup of auditory streaming (Riecke et al., 2015). It is, however, not known whether entrainment of the phase of local neuronal activity (LFPs) leads to an increased energy demand sufficient to BOLD responses observed in functional MRI.
We considered the basis for the link between phase locking and the BOLD response. Our stimulus combined a low-level and salient acoustic feature (amplitude modulation) in order to examine phase locking characteristics of pure tones used to determine the sound frequency dependence in auditory cortex. High phase locking can be observed when the phase of an oscillator aligns its phase due to external perturbation (phase entrainment or resetting), or due to an additive component (phase alignment). The observed apparent sustained phase locking without significant increase in high neural-frequency power in the LFP could be a result of stimulus induced phase resetting (entrainment) of ongoing neural oscillations that occur in the supra-granular layer of cortex (Kayser et al., 2008; Lakatos et al., 2008), or a result of additive evoked auditory responses based on the thalamic drive to the granular input layers causing depolarization (Szymanski et al., 2011) that lack high neural-frequency oscillation. Unambiguous separation and identification of the components generated by these two mechanisms remain chal-lenging, but it is likely that both mechanisms interact in the human cortex (Schroeder and Lakatos, 2009). For example, the additive auditory response could trigger the resetting of the phase of the ongoing oscillator. Work on a model of visual cortex demonstrates a relationship between synchronization of activity in neural ensembles and the BOLD response that occurs via an effect on mean activity levels and neuronal rate code and temporal code is intimately related and both coding mechanisms work together (Chawla et al., 2000). Phase resetting and synchronization of the LFP in the auditory cortex could lead to a change in overallfiring of neural ensembles, in that case we might expect that a combination of high neural-frequency oscillatory power and phase locking would be needed to explain the BOLD response.
It has been shown that the BOLD response not only represents the activity of pyramidal neurons but also reflects the activation of cortical interneurons that contribute for the regulation of cortical blood supply through both vasodilation and constriction (Cauli et al., 2004; Uhlirova et al., 2016). Although a detailed mechanism of the phase-locked component of the LFP is not well known, involvement of such cortical interneuron activity in the generation of the phase-locked LFP response is possible as in the gamma oscillations (Buzsaki and Wang, 2012; Mitzdorf, 1985; Niessing et al., 2005). This intra-cortical interaction may influence both temporal precision (phase-locking) of the discharge timing as well as the overall discharge rate (high neural-frequency power) of the cortical pyramidal neurons and associated subthreshold transmembrane voltagefluctuations.
Several points are worth mentioning in relation to the interpretation of the results. First, although our results clearly show significant contri-bution of phase locking to prediction of the BOLD response in mean ac-tivity level, simultaneous LFP and BOLD recording could add information about the trial-by-trial variability of the correlation. Second, the corre-lation between the BOLD response and LFP may be non-linear. We assessed whether the linear model was adequate by also carrying out non-linear regression using 2-layer neural networks, a general function approximator. The overall results are similar and the GLM describes the relationship well with much less parameters. Third, we considered SNR or response magnitude difference among the LFP features. We assessed the effect of relative magnitude among the LFP features by examining the relationship between these: the results demonstrate no significant effect of relative magnitude difference between the two (LFP power and phase locking features) on GLM betas. Fourth, as reported above, significant phase-locking could even be observed without high neural-frequency power increase in some of the contacts. One explanation for this is that this may be due to the difference of spatial spread or size of the tissue that contributes to the generation of these components. Although this is
possible, this does not mean that the non-phase locked high neural-frequency component and the phase-locked component of LFP carry essentially redundant information about the stimulus. Indeed, it has been shown that the these two LFP components do show different spatial distribution and functional role (Sinai et al., 2009; Winawer and Parvizi, 2016), and the relationship between the two LFP component remains to be studied further. Finally, related to the previous point, a commonly employed method to separate induced potentials from the LFP is to subtract the averaged potentials (stimulus-locked response) from the original LFPs as used in this report. We have confirmed that this sub-traction did not change gamma/high-gamma band power significantly (Fig. S1, S2, and S3) in our dataset. Also, the bootstrapping procedure used should mitigate the effect of trial-to-trial variability, since slightly different averaged potentials were created for each bootstrapped result and subtracted from the raw LFP. Further, overall GLM results are similar even when the original LFP signals (not the induced LFP signals) are used (Supplementary Fig. 4), confirming the important role of asynchronous induced LFP power and phase-locking in prediction of the BOLD signal. The complex pattern of phase locking we observed indicates diversity of the response characteristics in the cortex that might reflect differences in intrinsic oscillations and a preferred response to different driving frequencies. For example, if phase information carriesfiner temporal information than the power change, then the phase locking can be of importance in regions of the cortex that require more temporallyfi ne-grained operations. Finally, our data strongly suggest that phase lock-ing requires increased local energy demand in the cortex. Further work is required to determine if the relationship between phase locking and the BOLD response shown here is a general property of cortex or is specific to auditory cortex.
Acknowledgements
This work was supported by NIDCD (DC04290) and the Hoover fund. We thank all the members of Human Brain Research Laboratory (HRBL) at The University of Iowa, especially Haiming Chen, Matt Sutterer and Ariane Rhone for their help with conducting experiments. We thank Karl J. Friston and Nikos K. Logothetis for helpful discussion about thefi nd-ings. We would like to thank the patients who contributed their time for the experiments. The authors declare no competingfinancial interests. Appendix A. Supplementary data
Supplementary data related to this article can be found athttps://doi. org/10.1016/j.neuroimage.2017.12.051
References
Baumann, S., Petkov, C.I., Griffiths, T.D., 2013. A unified framework for the organization of the primate auditory cortex. Front. Syst. Neurosci. 7, 11.
Bentley, W.J., Li, J.M., Snyder, A.Z., Raichle, M.E., Snyder, L.H., 2016. Oxygen Level and LFP in task-positive and task-negative areas: bridging BOLD fMRI and
Electrophysiology. Cerebr. Cortex 26, 346–357.
Brewer, A.A., Barton, B., 2016. Maps of the auditory cortex. Annu. Rev. Neurosci. 39, 385–407.
Brugge, J.F., Nourski, K.V., Oya, H., Reale, R.A., Kawasaki, H., Steinschneider, M., Howard 3rd, M.A., 2009. Coding of repetitive transients by auditory cortex on Heschl's gyrus. J. Neurophysiol. 102, 2358–2374.
Buzsaki, G., Wang, X.J., 2012. Mechanisms of gamma oscillations. Annu. Rev. Neurosci. 35, 203–225.
Cauli, B., Tong, X.K., Rancillac, A., Serluca, N., Lambolez, B., Rossier, J., Hamel, E., 2004. Cortical GABA interneurons in neurovascular coupling: relays for subcortical vasoactive pathways. J. Neurosci. 24, 8940–8949.
Chawla, D., Lumer, E.D., Friston, K.J., 2000. Relating macroscopic measures of brain activity to fast, dynamic neuronal interactions. Neural Comput. 12, 2805–2821.
Conner, C.R., Ellmore, T.M., Pieters, T.A., DiSano, M.A., Tandon, N., 2011. Variability of the relationship between electrophysiology and BOLD-fMRI across cortical regions in humans. J. Neurosci. 31, 12855–12865.
Crone, N.E., Boatman, D., Gordon, B., Hao, L., 2001. Induced electrocorticographic gamma activity during auditory perception. Clin. Neurophysiol. 112, 565–582.
Da Costa, S., van der Zwaag, W., Marques, J.P., Frackowiak, R.S., Clarke, S., Saenz, M., 2011. Human primary auditory cortex follows the shape of Heschl's gyrus. J. Neurosci. 31, 14067–14075.
De Martino, F., Moerel, M., Xu, J., van de Moortele, P.F., Ugurbil, K., Goebel, R., Yacoub, E., Formisano, E., 2015. High-resolution mapping of myeloarchitecture in vivo: localization of auditory areas in the human brain. Cerebr. Cortex 25, 3394–3405.
Fiebelkorn, I.C., Foxe, J.J., Butler, J.S., Mercier, M.R., Snyder, A.C., Molholm, S., 2011. Ready, set, reset: stimulus-locked periodicity in behavioral performance demonstrates the consequences of cross-sensory phase reset. J. Neurosci. 31, 9971–9981.
Fischl, B., Sereno, M.I., Dale, A.M., 1999. Cortical surface-based analysis: II: inflation, flattening, and a surface-based coordinate system. Neuroimage 9, 195–207.
Fonov, V., Evans, A.C., Botteron, K., Almli, C.R., McKinstry, R.C., Collins, D.L., 2011. Unbiased average age-appropriate atlases for pediatric studies. Neuroimage 54, 313–327.
Formisano, E., Kim, D.-S., Di Salle, F., van de Moortele, P.-F., Ugurbil, K., Goebel, R., 2003. Mirror-symmetric tonotopic maps in human primary auditory cortex. Neuron 40, 859–869.
Goldberg, J.M., Brown, P.B., 1969. Response of binaural neurons of dog superior olivary complex to dichotic tonal stimuli: some physiological mechanisms of sound localization. J. Neurophysiol. 32, 613–636.
Zion Golumbic, E.M., Ding, N., Bickel, S., Lakatos, P., Schevon, C.A., McKhann, G.M., Goodman, R.R., Emerson, R., Mehta, A.D., Simon, J.Z., Poeppel, D., Schroeder, C.E., 2013. Mechanisms underlying selective neuronal tracking of attended speech at a “cocktail party”. Neuron 77, 980–991.
Gutschalk, A., Hamalainen, M.S., Melcher, J.R., 2010. BOLD responses in human auditory cortex are more closely related to transient MEG responses than to sustained ones. J. Neurophysiol. 103, 2015–2026.
Hall, D.A., Haggard, M.P., Akeroyd, M.A., Palmer, A.R., Summerfield, A.Q., Elliott, M.R., Gurney, E.M., Bowtell, R.W., 1999.“Sparse”temporal sampling in auditory fMRI. Hum. Brain Mapp. 7, 213–223.
Hermes, D., Miller, K.J., Vansteensel, M.J., Aarnoutse, E.J., Leijten, F.S., Ramsey, N.F., 2012. Neurophysiologic correlates of fMRI in human motor cortex. Hum. Brain Mapp. 33, 1689–1699.
Howard 3rd, M.A., Volkov, I.O., Granner, M.A., Damasio, H.M., Ollendieck, M.C., Bakken, H.E., 1996. A hybrid clinical-research depth electrode for acute and chronic in vivo microelectrode recording of human brain neurons. Technical note. J Neurosurg 84, 129–132.
Huo, B.X., Smith, J.B., Drew, P.J., 2014. Neurovascular coupling and decoupling in the cortex during voluntary locomotion. J. Neurosci. 34, 10975–10981.
Jabbi, M., Kohn, P.D., Nash, T., Ianni, A., Coutlee, C., Holroyd, T., Carver, F.W., Chen, Q., Cropp, B., Kippenhan, J.S., Robinson, S.E., Coppola, R., Berman, K.F., 2015. Convergent BOLD and beta-band activity in superior temporal sulcus and frontolimbic circuitry underpins human emotion cognition. Cerebr. Cortex 25, 1878–1888.
Kayser, C., Petkov, C.I., Logothetis, N.K., 2008. Visual modulation of neurons in auditory cortex. Cerebr. Cortex 18, 1560–1574.
Lakatos, P., Karmos, G., Mehta, A.D., Ulbert, I., Schroeder, C.E., 2008. Entrainment of neuronal oscillations as a mechanism of attentional selection. Science 320, 110–113.
Langers, D.R., 2014. Assessment of tonotopically organised subdivisions in human auditory cortex using volumetric and surface-based cortical alignments. Hum. Brain Mapp. 35, 1544–1561.
Langers, D.R., van Dijk, P., 2012. Mapping the tonotopic organization in human auditory cortex with minimally salient acoustic stimulation. Cerebr. Cortex 22, 2024–2038.
Langers, D.R., Krumbholz, K., Bowtell, R.W., Hall, D.A., 2014a. Neuroimaging paradigms for tonotopic mapping (I): the influence of sound stimulus type. Neuroimage 100, 650–662.
Langers, D.R., Sanchez-Panchuelo, R.M., Francis, S.T., Krumbholz, K., Hall, D.A., 2014b. Neuroimaging paradigms for tonotopic mapping (II): the influence of acquisition protocol. Neuroimage 100, 663–675.
Logothetis, N.K., Pauls, J., Augath, M., Trinath, T., Oeltermann, A., 2001. Neurophysiological investigation of the basis of the fMRI signal. Nature 412, 150–157.
Lopour, B.A., Tavassoli, A., Fried, I., Ringach, D.L., 2013. Coding of information in the phase of localfield potentials within human medial temporal lobe. Neuron 79, 594–606.
Mercier, M.R., Molholm, S., Fiebelkorn, I.C., Butler, J.S., Schwartz, T.H., Foxe, J.J., 2015. Neuro-oscillatory phase alignment drives speeded multisensory response times: an electro-corticographic investigation. J. Neurosci. 35, 8546–8557.
Merzenich, M.M., Brugge, J.F., 1973. Representation of the cochlear partition on the superior temporal plane of the macaque monkey. Brain Res. 50, 275–296.
Miller, K.J., Honey, C.J., Hermes, D., Rao, R.P., denNijs, M., Ojemann, J.G., 2014. Broadband changes in the cortical surface potential track activation of functionally diverse neuronal populations. Neuroimage 85 (Pt 2), 711–720.
Mitzdorf, U., 1985. Current Source-density Method and Application in Cat Cerebral Cortex: Investigation of Evoked Potentials and EEG Phenomena. American Physiological Society.
Moerel, M., De Martino, F., Formisano, E., 2014. An anatomical and functional topography of human auditory cortical areas. Front. Neurosci. 8, 225.
Morel, A., Garraghty, P.E., Kaas, J.H., 1993. Tonotopic organization, architectonicfields, and connections of auditory cortex in macaque monkeys. J. Comp. Neurol. 335, 437–459.
Mukamel, R., Gelbard, H., Arieli, A., Hasson, U., Fried, I., Malach, R., 2005. Coupling between neuronalfiring,field potentials, and fMRI in human auditory cortex. Science 309, 951–954.
Ng, B.S., Schroeder, T., Kayser, C., 2012. A precluding but not ensuring role of entrained low-frequency oscillations for auditory perception. J. Neurosci. 32, 12268–12276.
Niessing, J., Ebisch, B., Schmidt, K.E., Niessing, M., Singer, W., Galuske, R.A., 2005. Hemodynamic signals correlate tightly with synchronized gamma oscillations. Science 309, 948–951.
Nir, Y., Fisch, L., Mukamel, R., Gelbard-Sagiv, H., Arieli, A., Fried, I., Malach, R., 2007. Coupling between neuronalfiring rate, gamma LFP, and BOLD fMRI is related to interneuronal correlations. Curr. Biol. 17, 1275–1285.
Nourski, K.V., Reale, R.A., Oya, H., Kawasaki, H., Kovach, C.K., Chen, H.,
Howard 3rd, M.A., Brugge, J.F., 2009. Temporal envelope of time-compressed speech represented in the human auditory cortex. J. Neurosci. 29, 15564–15574.
Ojemann, G.A., Ojemann, J., Ramsey, N.F., 2013. Relation between functional magnetic resonance imaging (fMRI) and single neuron, localfield potential (LFP) and electrocorticography (ECoG) activity in human cortex. Front. Hum. Neurosci. 7.
Peelle, J.E., Davis, M.H., 2012. Neural oscillations carry speech rhythm through to comprehension. Front. Psychol. 3, 320.
Philibert, B., Beitel, R.E., Nagarajan, S.S., Bonham, B.H., Schreiner, C.E., Cheung, S.W., 2005. Functional organization and hemispheric comparison of primary auditory cortex in the common marmoset (Callithrix jacchus). J. Comp. Neurol. 487, 391–406.
Reddy, C.G., Dahdaleh, N.S., Albert, G., Chen, F., Hansen, D., Nourski, K., Kawasaki, H., Oya, H., Howard 3rd, M.A., 2010. A method for placing Heschl gyrus depth electrodes. J. Neurosurg. 112, 1301–1307.
Riecke, L., Sack, A.T., Schroeder, C.E., 2015. Endogenous delta/theta sound-brain phase entrainment accelerates the buildup of auditory streaming. Curr. Biol. 25, 3196–3201.
Rosen, S., 1992. Temporal information in speech: acoustic, auditory and linguistic aspects. Philos Trans R Soc Lond B Biol Sci 336, 367–373.
Saenz, M., Langers, D.R., 2014. Tonotopic mapping of human auditory cortex. Hear. Res. 307, 42–52.
Schroeder, C.E., Lakatos, P., 2009. Low-frequency neuronal oscillations as instruments of sensory selection. Trends Neurosci. 32, 9–18.
Sinai, A., Crone, N.E., Wied, H.M., Franaszczuk, P.J., Miglioretti, D., Boatman-Reich, D., 2009. Intracranial mapping of auditory perception: event-related responses and electrocortical stimulation. Clin. Neurophysiol. 120, 140–149.
Szymanski, F.D., Rabinowitz, N.C., Magri, C., Panzeri, S., Schnupp, J.W., 2011. The laminar and temporal structure of stimulus information in the phase offield potentials of auditory cortex. J. Neurosci. 31, 15787–15801.
Talavage, T.M., Sereno, M.I., Melcher, J.R., Ledden, P.J., Rosen, B.R., Dale, A.M., 2004. Tonotopic organization in human auditory cortex revealed by progressions of frequency sensitivity. J. Neurophysiol. 91, 1282–1296.
Tierney, T.M., Weiss-Croft, L.J., Centeno, M., Shamshiri, E.A., Perani, S., Baldeweg, T., Clark, C.A., Carmichael, D.W., 2016. FIACH: a biophysical model for automatic retrospective noise control in fMRI. Neuroimage 124, 1009–1020.
Uhlirova, H., Kilic, K., Tian, P., Thunemann, M., Desjardins, M., Saisan, P.A., Sakadzic, S., Ness, T.V., Mateo, C., Cheng, Q., Weldy, K.L., Razoux, F., Vandenberghe, M., Cremonesi, J.A., Ferri, C.G., Nizar, K., Sridhar, V.B., Steed, T.C., Abashin, M., Fainman, Y., Masliah, E., Djurovic, S., Andreassen, O.A., Silva, G.A., Boas, D.A., Kleinfeld, D., Buxton, R.B., Einevoll, G.T., Dale, A.M., Devor, A., 2016. Cell type specificity of neurovascular coupling in cerebral cortex. Elife 5.
VanRullen, R., Zoefel, B., Ilhan, B., 2014. On the cyclic nature of perception in vision versus audition. Philos Trans R Soc Lond B Biol Sci 369, 20130214.
Viswanathan, A., Freeman, R.D., 2007. Neurometabolic coupling in cerebral cortex reflects synaptic more than spiking activity. Nat. Neurosci. 10, 1308–1312.
Winawer, J., Parvizi, J., 2016. Linking electrical stimulation of human primary visual cortex, size of affected cortical area, neuronal responses, and subjective experience. Neuron 92, 1213–1219.
Winawer, J., Kay, K.N., Foster, B.L., Rauschecker, A.M., Parvizi, J., Wandell, B.A., 2013. Asynchronous broadband signals are the principal source of the BOLD response in human visual cortex. Curr. Biol. 23, 1145–1153.
Woods, D.L., Stecker, G.C., Rinne, T., Herron, T.J., Cate, A.D., Yund, E.W., Liao, I., Kang, X., 2009. Functional maps of human auditory cortex: effects of acoustic features and attention. PLos One 4, e5183.
Woods, D.L., Herron, T.J., Cate, A.D., Yund, E.W., Stecker, G.C., Rinne, T., Kang, X., 2010. Functional properties of human auditory corticalfields. Front. Syst. Neurosci. 4, 155.
Xing, D., Shen, Y., Burns, S., Yeh, C.I., Shapley, R., Li, W., 2012. Stochastic generation of gamma-band activity in primary visual cortex of awake and anesthetized monkeys. J. Neurosci. 32, 13873–13880.
Zhou, B., Green, D.M., Middlebrooks, J.C., 1992. Characterization of external ear impulse responses using Golay codes. J. Acoust. Soc. Am. 92, 1169–1171.