Full Terms & Conditions of access and use can be found at
https://www.tandfonline.com/action/journalInformation?journalCode=ilal20
Leukemia & Lymphoma
ISSN: 1042-8194 (Print) 1029-2403 (Online) Journal homepage: https://www.tandfonline.com/loi/ilal20
Prognostic impact of low muscle mass and low
muscle density in patients with diffuse large B-cell
lymphoma
Hánah N. Rier, Hardjit Kharagjitsing, Joost van Rosmalen, Jeroen van Vugt,
Peter E. Westerweel, Eva de Jongh, Mark Kock & Mark-David Levin
To cite this article: Hánah N. Rier, Hardjit Kharagjitsing, Joost van Rosmalen, Jeroen van Vugt, Peter E. Westerweel, Eva de Jongh, Mark Kock & Mark-David Levin (2020): Prognostic impact of low muscle mass and low muscle density in patients with diffuse large B-cell lymphoma, Leukemia & Lymphoma, DOI: 10.1080/10428194.2020.1737686
To link to this article: https://doi.org/10.1080/10428194.2020.1737686
© 2020 The Author(s). Published by Informa UK Limited, trading as Taylor & Francis Group.
Published online: 13 Mar 2020.
Submit your article to this journal
Article views: 180
View related articles
ORIGINAL ARTICLE
Prognostic impact of low muscle mass and low muscle density in patients
with diffuse large B-cell lymphoma
Hanah N. Riera,b, Hardjit Kharagjitsinga,b, Joost van Rosmalenc, Jeroen van Vugtd, Peter E. Westerweela , Eva de Jongha, Mark Kockeand Mark-David Levina
a
Department of Internal Medicine, Albert Schweitzer Hospital, Dordrecht, The Netherlands;bDepartment of Internal Medicine, Erasmus Medical Center, Rotterdam, The Netherlands;cDepartment of Biostatistics, Erasmus Medical Center, Rotterdam, The Netherlands;dDepartment of Surgery, Erasmus Medical Center, Rotterdam, The Netherlands;eDepartment of Radiology, Albert Schweitzer Hospital, Dordrecht, The Netherlands
ABSTRACT
Low muscle mass (LMM) and low muscle density (LMD) are increasingly recognized as prognos-tic factors for survival in different malignancies. This study determined the association of LMM and LMD with survival in DLBCL (diffuse large B-cell lymphoma) patients. CT-based measure-ment of muscle was performed in 164 DLBCL patients prior to chemo-immunotherapy.Z-scores adjusted for gender, age, and body mass index were derived from a healthy reference popula-tion. LMM or LMD were defined as aZ-score below 1 and were related to OS and PFS. The co-existence of both LMM and LMD was observed in 13% of the DLBCL patients and was signifi-cantly associated with shorter OS and PFS. Also, these patients more often did not complete the planned treatment. The combination of LMM and LMD is an independent prognostic factor for survival in DLBCL patients. This may guide clinical decision-making in patients with suspected insufficient performance to benefit from chemo-immunotherapy in standard doses.
KEY POINTS
Patients with DLBCL have low muscle mass (LMM) and low muscle density (LMD) compared to healthy counterparts.
The combination of LMM and LMD is a negative prognostic factor for survival, independent of comorbidities and unfavorable lymphoma characteristics.
ARTICLE HISTORY Received 24 November 2019 Revised 17 February 2020 Accepted 23 February 2020 KEYWORDS
Muscle mass; muscle density; sarcopenia; diffuse large B-cell lymphoma; overall survival
Introduction
Diffuse large B-cell lymphoma (DLBCL) is the most com-mon type of non-Hodgkin lymphoma (NHL), account-ing for approximately 30% of all NHL cases [1]. Treatment usually consists of chemotherapy combined with monoclonal antibody rituximab (R-CHOP), result-ing in a complete remission (CR) rate in 65–70% and a 5-year overall survival (OS) of 40–65% [2]. Clinical out-comes might be compromised by the fact that some patients are unable to complete the entire chemothera-peutic treatment due to toxicity or comorbidity or they are unable to receive the first choice treatment (R-CHOP) at all [3]. The determination of factors contribu-ting to physical reserve or the occurrence of treatment toxicity is clinically relevant to optimize the administra-tion of systemic treatment to patients with DLBCL.
In recent years, the impact of body composition parameters on prognosis and treatment tolerability has been extensively studied in the oncological field. Body composition analyses consist of the measure-ment of different body compartmeasure-ments, which is fat-free mass (FFM) and fat mass (FM), where muscle mass is part of the FFM. Low muscle mass (LMM) has been related to impaired OS in multiple tumor types [4–6], including DLBCL [7–11]. More recently, it has been demonstrated that the quality of the muscle fibers is even more important than the amount of muscle mass itself. More microscopic fatty infiltration of muscle (resulting in lower muscle density) showed a larger association with survival than LMM in breast cancer, renal cell carcinoma, and gastric cancer [11–14]. One study in patients with DLBCL indeed showed that low muscle density (LMD) resulted in a CONTACTHanah N. Rier [email protected] Department of Internal Medicine, Erasmus Medical Center,‘s-Gravendijkwal 230, 3015 CE Rotterdam, The Netherlands
These authors contributed equally to this work.
ß2020 The Author(s). Published by Informa UK Limited, trading as Taylor & Francis Group.
This is an Open Access article distributed under the terms of the Creative Commons Attribution-NonCommercial-NoDerivatives License (http://creativecommons.org/licenses/by-nc-nd/4.0/), which permits non-commercial re-use, distribution, and reproduction in any medium, provided the original work is properly cited, and is not altered, transformed, or built upon in any way.
shorter median OS (HR: 2.52, 95% CI: 1.40–4.54,
p¼0.002) after adjustment for gender and R-IPI score [11]. However, a high R-IPI score remained the most important prognostic factor for outcome in this study and a majority of the patients with a high R-IPI had LMD. Therefore, it is unclear whether the prognostic impact is partly due to old age or unfavorable charac-teristics of DLBCL in these patients. A problem with studies reporting LMM and LMD is that different defi-nitions of LMM and LMD are used, making it hard to generalize the results.
Therefore, we performed a study to investigate the association of LMD, LMM and the combination of both with survival in patients with DLBCL with special emphasis on investigating differences in comorbidity and received treatment between these patient groups. Secondly, we determined the prevalence of LMM and LMD in patients with DLBCL compared to a recently published reference population of healthy kidney donors. We applied a reproducible formula for LMM and LMD based on the healthy reference population, as a first step in the standardization of muscle measurement.
Methods
Study design
This single-center retrospective study was performed at a large regional hospital in the Netherlands. Patients diagnosed with DLBCL between January 2006 and December 2015 were identified using the Netherlands Cancer Registry (NCR). The date of the last known vital status (i.e. alive, dead, or emigration) was retrieved by linking the NCR to the Nationwide Population Registries Network that holds vital statistics of all residents in the Netherlands. Patients with abdominal CT scans within 3 months before the start of treatment were included. Inclusion criteria were: A histological diagnosis of DLBCL, 18 years of age and treatment with R-CHOP chemo-immunotherapy. Exclusion criteria were: a second active malignancy or a history of malignant lymphoma in the past. Medical records were searched for patient charac-teristics, length, weight, chemotherapeutic dosage, and tumor response.
The primary endpoint was OS. Secondary endpoints were progression-free survival (PFS), the CR-rate and the completion of the planned treatment. OS was defined as the date of the pathological diagnosis to the date of death or end of follow-up (1 July 2017). PFS was defined as the date of the pathological diagnosis until the date of radiological disease progression. Alive patients and patients without disease progression were censored on
1 July 2017. Response to treatment was defined accord-ing to the revised response criteria for malignant lymph-oma [15]. The study was approved by the Ethics Committee of the Albert Schweitzer hospital and the Internal Review Board of the NCR.
Muscle measurements
Muscle mass was measured by CT-imaging (slice thick-ness 3 mm, Brilliance 64 CT or Brilliance 40 CT, Philips, Best, the Netherlands), acquired during routine patient care. All measurements were performed using a single transversal CT-image at the L3 level using validated seg-mentation software (sliceOmatic, TomoVision, Montreal, Canada) (tomovision.com/products/sliceomatic.html). Skeletal muscle at this level is representative of the whole body [16]. Total abdominal muscle cross-sectional area was measured in cm2 and corrected for height, resulting in a lumbar skeletal muscle index in cm2/m2, which is used as marker of muscle mass. Mean muscle density of all abdominal muscles at L3 was measured in Hounsfield units (HU). The HU-threshold for muscle tis-sue varied from29 toþ150 HU [17]. Recently, sex-spe-cific percentiles for muscle mass and muscle density were determined in more than one thousand healthy individuals of a predominantly Caucasian population [18]. Z-scores for muscle mass and muscle density were used from this population, with Z-scores of 0 indicating the mean muscle mass and muscle density in the healthy population. These Z-scores were adjusted for gender, age, and body mass index (BMI). LMM and LMD were defined as aZ-score equal to or below1, which corresponds with one standard deviation below the mean of the healthy population. Both populations (DLBCL and healthy) were from the Netherlands and mainly Caucasian.
All muscle measurements were performed by one trained investigator (HK). The inter-observer reliability with two other trained investigators (HR, MK) was high, as assessed with an intraclass correlation coeffi-cient using a two-way random effects model and an absolute agreement definition of 0.993.
Statistical analyses
Continuous variables were described as mean and standard deviation or as median and interquartile range (IQR). Categorical variables were described using percentages. Comparisons between patients with and without LMM or LMD were performed using Mann–Whitney tests for continuous variables, Fisher’s exact tests for dichotomous variables and chi-square
tests for categorical variables with more than two cat-egories. Mean muscle mass and mean muscle density between the patients with DLBCL and healthy individ-uals were compared using t-tests. Z-scores for muscle mass were derived from the healthy population [18] according to the following formulas using the inter-cept regression coefficients:
Muscle mass in males
¼ ðmuscle skeletal index in cm2=m232:32þ0:14 age1:13BMIÞ=7:02
Muscle mass in females
¼ ðmuscle skeletal index in cm2=m219:890:19 age1:07BMIþ0:01ageBMIÞ=5:16 Muscle density in males
¼ ðmuscle density in HU77:33þ0:29age þ0:69BMIÞ=7:12
Muscle density in females
¼ ðmuscle density in HU83:63þ0:38age þ0:83BMIÞ=8:36
The relation between muscle parameters and comorbidity and premature termination of R-CHOP treatment was determined using multivariable logistic regression models. In separate models, premature ter-mination of R-CHOP and the presence of LMM or LMD were used as dependent variables. Age, BMI, IPI score, gender, and comorbidity were the independent varia-bles. The association of LMM, LMD with OS and PFS were determined using Kaplan–Meier curves and Cox proportional hazard models. The dependent variables in the multivariable Cox proportional hazard models were OS and PFS. The independent variables were: age, gender, IPI score (0–5 on a continuous scale) and BMI. TheZ-scores of skeletal muscle index and muscle density and the presence of LMM, LMD, and both LMM and LMD were added to the multivariable Cox proportional hazard models in separate analyses (i.e. one variable was added at a time).
Variance inflation factors were calculated to assess the degree of multicollinearity among the independ-ent variables in the Cox proportional hazard models. The proportional hazards assumption was assessed by testing the interaction effects between independent variables and follow-up time in a Cox proportion haz-ards model with time-dependent covariates. All analy-ses were performed using SPSS version 24.0 (SPSS Inc., Chicago, IL, USA) with a two-sided significance level of 0.05.
Results
Patient characteristics
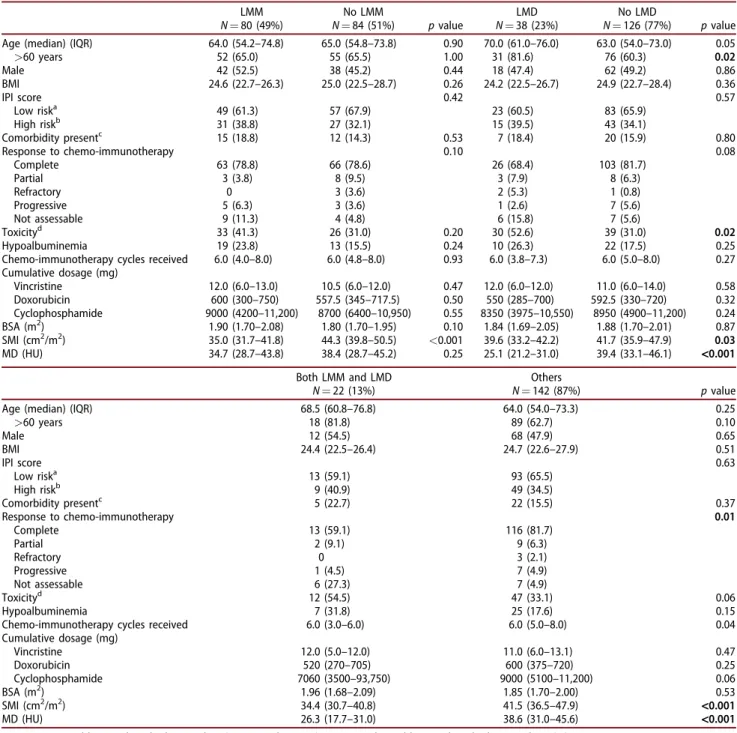
Between 2006 and 2015, 252 patients with DLBCL were identified. Of these patients, 55 patients did not receive R-CHOP, 13 patients were referred to another hospital, 7 passed away before treatment, 4 patients were excluded because no CT-scan prior to treatment was available, 3 had a second malignancy, 2 had a his-tory of prior lymphoma, for 1 patient no data were available about weight and length before start of chemotherapy and 3 patients were excluded because CT-based muscle measurement was not possible due to technical problems. In total, 164 patients were included in the analysis. The median age was 64.5 years (IQR: 54.3–74.0 years). Two-thirds of the patients were above 60 years of age. The median IPI score was 2 (IQR: 1–3) and complete response after therapy was reached in 129 patients (79%). The median duration of follow-up was 57 months (IQR: 27.3–85.8 months). No patients were lost to follow-up (Table 1).
Prevalence of LMM and LMD and comparison with a healthy reference population
Median muscle mass in the entire group with DLBCL was 40.5 cm2/m2 (IQR: 35.3–46.6 cm2/m2). Median muscle mass in the healthy population was 47.4 cm2/m2 [18]. The median Z-score was 1.04 (IQR: 1.69 to 0.58) in males and 0.78 (IQR: 1.62 to 0.29) in females with DLBCL. The median muscle mass in both males and females with DLBCL was sig-nificantly lower compared to their healthy counter-parts (p<0.001). In the healthy population, a Z-score of 1 corresponded with the worst 16% of the healthy population, whereas 49% of the patients with DLBCL had a Z-score of 1 and were accordingly considered having LMM. The incidence of dose-limit-ing or dose-interruptdose-limit-ing toxicity, premature termin-ation of treatment and chemotherapy dose did not significantly differ between patients with LMM and without LMM. Other patient characteristics were also not significantly different between patients with and without LMM (Table 1).
Similar to the findings on muscle mass, median muscle density was significantly lower in the patients with DLBCL compared to the healthy reference popu-lation (37.5 HU (IQR: 28.7–44.4 HU) vs. 44 HU [18],
p<0.001). 23% of the patients were considered hav-ing LMD and these patients were older (median age 70.0 vs. 63.0 years, p¼0.05) than patients without
LMD. Patients with LMD also more often experienced premature termination of chemotherapy (28.9% vs. 12.1%, p¼0.02), while the dosages of received cycles remained similar. The main reasons for premature treatment termination were treatment toxicity (27.3% in patients with LMD vs. 20.0% in patients without
LMD) and death (36.4% in patients with LMD vs. 13.3% in patients without LMD) (Table 1). Multivariable logistic regression models revealed that the presence of either LMM or LMD was not signifi-cantly associated with age, gender, IPI score or the presence of comorbidity.
Table 1. Patient characteristics.
LMM N¼80 (49%) No LMM N¼84 (51%) pvalue LMD N¼38 (23%) No LMD N¼126 (77%) pvalue
Age (median) (IQR) 64.0 (54.2–74.8) 65.0 (54.8–73.8) 0.90 70.0 (61.0–76.0) 63.0 (54.0–73.0) 0.05
>60 years 52 (65.0) 55 (65.5) 1.00 31 (81.6) 76 (60.3) 0.02 Male 42 (52.5) 38 (45.2) 0.44 18 (47.4) 62 (49.2) 0.86 BMI 24.6 (22.7–26.3) 25.0 (22.5–28.7) 0.26 24.2 (22.5–26.7) 24.9 (22.7–28.4) 0.36 IPI score 0.42 0.57 Low riska 49 (61.3) 57 (67.9) 23 (60.5) 83 (65.9) High riskb 31 (38.8) 27 (32.1) 15 (39.5) 43 (34.1) Comorbidity presentc 15 (18.8) 12 (14.3) 0.53 7 (18.4) 20 (15.9) 0.80 Response to chemo-immunotherapy 0.10 0.08 Complete 63 (78.8) 66 (78.6) 26 (68.4) 103 (81.7) Partial 3 (3.8) 8 (9.5) 3 (7.9) 8 (6.3) Refractory 0 3 (3.6) 2 (5.3) 1 (0.8) Progressive 5 (6.3) 3 (3.6) 1 (2.6) 7 (5.6) Not assessable 9 (11.3) 4 (4.8) 6 (15.8) 7 (5.6) Toxicityd 33 (41.3) 26 (31.0) 0.20 30 (52.6) 39 (31.0) 0.02 Hypoalbuminemia 19 (23.8) 13 (15.5) 0.24 10 (26.3) 22 (17.5) 0.25
Chemo-immunotherapy cycles received 6.0 (4.0–8.0) 6.0 (4.8–8.0) 0.93 6.0 (3.8–7.3) 6.0 (5.0–8.0) 0.27
Cumulative dosage (mg) Vincristine 12.0 (6.0–13.0) 10.5 (6.0–12.0) 0.47 12.0 (6.0–12.0) 11.0 (6.0–14.0) 0.58 Doxorubicin 600 (300–750) 557.5 (345–717.5) 0.50 550 (285–700) 592.5 (330–720) 0.32 Cyclophosphamide 9000 (4200–11,200) 8700 (6400–10,950) 0.55 8350 (3975–10,550) 8950 (4900–11,200) 0.24 BSA (m2) 1.90 (1.70–2.08) 1.80 (1.70–1.95) 0.10 1.84 (1.69–2.05) 1.88 (1.70–2.01) 0.87 SMI (cm2/m2) 35.0 (31.7–41.8) 44.3 (39.8–50.5) <0.001 39.6 (33.2–42.2) 41.7 (35.9–47.9) 0.03 MD (HU) 34.7 (28.7–43.8) 38.4 (28.7–45.2) 0.25 25.1 (21.2–31.0) 39.4 (33.1–46.1) <0.001 Both LMM and LMD N¼22 (13%) Others N¼142 (87%) pvalue
Age (median) (IQR) 68.5 (60.8–76.8) 64.0 (54.0–73.3) 0.25
>60 years 18 (81.8) 89 (62.7) 0.10 Male 12 (54.5) 68 (47.9) 0.65 BMI 24.4 (22.5–26.4) 24.7 (22.6–27.9) 0.51 IPI score 0.63 Low riska 13 (59.1) 93 (65.5) High riskb 9 (40.9) 49 (34.5) Comorbidity presentc 5 (22.7) 22 (15.5) 0.37 Response to chemo-immunotherapy 0.01 Complete 13 (59.1) 116 (81.7) Partial 2 (9.1) 9 (6.3) Refractory 0 3 (2.1) Progressive 1 (4.5) 7 (4.9) Not assessable 6 (27.3) 7 (4.9) Toxicityd 12 (54.5) 47 (33.1) 0.06 Hypoalbuminemia 7 (31.8) 25 (17.6) 0.15
Chemo-immunotherapy cycles received 6.0 (3.0–6.0) 6.0 (5.0–8.0) 0.04
Cumulative dosage (mg) Vincristine 12.0 (5.0–12.0) 11.0 (6.0–13.1) 0.47 Doxorubicin 520 (270–705) 600 (375–720) 0.25 Cyclophosphamide 7060 (3500–93,750) 9000 (5100–11,200) 0.06 BSA (m2) 1.96 (1.68–2.09) 1.85 (1.70–2.00) 0.53 SMI (cm2/m2) 34.4 (30.7–40.8) 41.5 (36.5–47.9) <0.001 MD (HU) 26.3 (17.7–31.0) 38.6 (31.0–45.6) <0.001
Continuous variables are described as median (interquartile range). Categorical variables are described as numbers (%).
BMI: body mass index; BSA: body surface area; IPI: international prognostic index; IQR: interquartile range; LMD: low muscle density; LMM: low muscle mass; LSMI: lumbar skeletal muscle index; MD: muscle density.
a
Low-risk DLBCL: IPI 0–2. bHigh-risk DLBCL: IPI 3–5. c
Comorbidity was considered to be present in case of the presence of either rheumatoid diseases, diabetes mellitus, chronic liver disease or cardiovascu-lar disease (cardiac events in the past, cardiac failure or known coronary arteriosclerosis).
d
The presence of dose-limiting or dose-interrupting toxicity or definitive termination of R-CHOP due to toxicity.
p-values are highlighted in bold. 4 H. N. RIER ET AL.
A minority of the patients (n¼22, 13%) had both LMM and LMD. These patients more frequently did not complete the planned treatment (31.8% vs. 13.6%) and as expected, were therefore less likely to achieve a complete response (59.1% vs. 81.7%, p¼0.01). After adjustment for age, gender, IPI score, BMI, and comor-bidity, the combination of LMM and LMD was still associated with premature termination of chemo-immunotherapy (multivariable OR 2.84, 95% CI: 1.00–1.81, p¼0.05). No significant differences in the prevalence of high-risk lymphoma (IPI score >2) or comorbidity were established between patients with and without LMM or LMD (Table 1).
Survival
The median OS in the entire cohort was not reached during follow-up. The 5-year OS was 75.6%. At the end of follow-up, a total of 50 patients (30.5%) had died. Both LMM and muscle mass on a continuous scale were not significantly associated with OS (multi-variable HR: 0.95, 95% CI: 0.74–1.23, p¼0.71 and HR: 1.16, 95% CI: 0.66–2.03, p¼0.61, respectively) (Table 2). Patients with LMD had a shorter OS than patients without LMD (median OS 118 months, 95% CI: 47.4–198.6 months vs. median OS not reached,
p¼0.02) (Figure 1(C)), but no significant difference in survival was observed after adjustment for age, gen-der, BMI and IPI score (Table 2). Only the combination of both LMM and LMD was significantly associated with shorter survival, also after adjustment for other clinical factors, including IPI score (multivariable HR: 2.42, 95% CI: 1.27–4.63, p¼0.01) (Table 2).
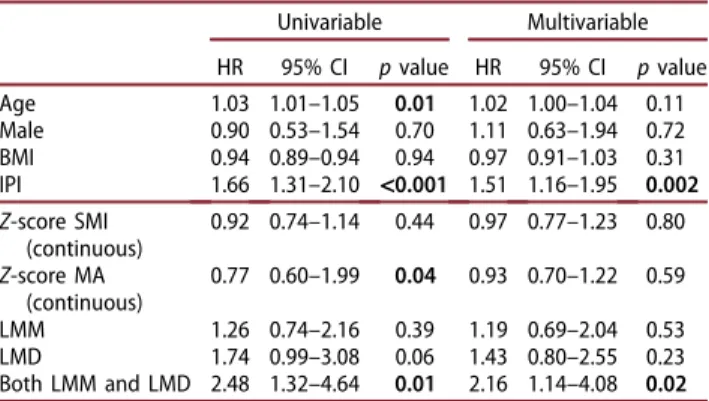
Similar results were observed for PFS. The 5-year PFS was 75.0% and only the combination of both LMM and LMD was independently associated with shorter PFS (multivariable HR: 2.16, 95% CI: 1.14–4.08,
p¼0.02) (Table 3). No significant violations of the pro-portional hazards assumption were detected.
Discussion
This study showed that the combination of LMM and LMD was an independent risk factor for shorter OS and PFS. Furthermore, these patients frequently dis-continued R-CHOP and were subsequently less likely to achieve a CR. In a study involving 187 DLBCL patients, CR-rate did not differ between patients with LMM and patients with normal muscle mass if it was possible to administer all planned treatment cycles [10]. Therefore it is possible that premature termin-ation of treatment is the cause of the diminished CR-rate, highlighting the possibility that targeting LMM/ LMD might result in a higher CR-rate, thereby improv-ing survival. This is supported by the fact that OS and PFS in our study were highly comparable, indicating that the cause of death is mainly because of progres-sive disease.
In a study involving elderly DLBCL patients
>70 years of age, LMM was an independent prognos-tic factor for OS (HR: 3.22, 95% CI: 1.73–5.98,
p¼0.0002) and PFS (HR: 2.24, 95% CI: 1.12–4.12,
p¼0.01) [8]. This effect was not clearly observed in younger patients, which is also in contrast with the prognostic impact of LMM in several solid malignan-cies. This implicates that firstly, prognostic impact of muscle parameters differs between specific tumor-and treatment settings tumor-and therefore, the most suit-able body composition parameter for clinical applic-ability differs accordingly. Secondly, the measurement of muscle mass might be especially clinically relevant in the older patient, where the presence of LMM might indicate undetected decreased physical reserve. This is supported by the fact that LMM was not associ-ated with impaired physical performance and high IPI score on multiple occasions [8,19]. Also, it has been reported that the non-cancer-related mortality because of treatment toxicity and adverse events is higher in patients with LMM compared to patients with normal muscle mass [20], indicating that these patients are frail. In younger patients with DLBCL, the prognostic impact of LMM should be interpreted with caution.
Overall, accumulating evidence shows that LMM and LMD in cancer patients result in more treatment toxicity [4,21], more postoperative complications [22],
Table 2. Cox proportional hazard models OS.
Univariable Multivariable HR 95% CI pvalue HR 95% CI pvalue Age 1.03 1.01–1.06 0.01 1.02 1.00–1.05 0.07 Male 0.88 0.51–1.55 0.67 1.14 0.63–2.05 0.66 BMI 0.92 0.86–0.98 0.01 0.94 0.88–1.01 0.10 IPI 1.34 1.34–2.20 <0.001 1.51 1.16–1.97 0.003 Z-score SMI (continuous) 0.90 0.71–1.13 0.35 0.95 0.74–1.23 0.71 Z-score MD (continuous) 0.73 0.56–1.94 0.02 0.88 0.66–1.17 0.38 LMMa 1.24 0.71–2.17 0.45 1.16 0.66–2.03 0.61 LMDb 2.05 1.14–3.65 0.02 1.68 0.94–3.03 0.08 Both LMM and LMD 2.74 1.45–5.18 0.002 2.42 1.27–4.63 0.01 A multivariable Cox proportional hazard model was performed with all basic patient characteristics (above the line), after which each muscle par-ameter (below the line) was added in a separate Cox proportional haz-ard model.
BMI: body mass index; IPI: international prognostic index; LMD: low muscle density; LMM: low muscle mass; MD: muscle density; OS: overall survival; SMI: skeletal muscle index.
a
LMM:Z-score<1. bLMD:Z-score<1.
shorter survival [5,17], and decreased quality of life [23]. One explanation may be that pharmacokinetic variations of cytotoxic drugs occur depending on body composition [24]. Muscle measurement may help to guide optimization of chemotherapy dosage in order to reduce toxicity, while still maintaining oncological efficacy. Therefore, it is important to iden-tify which muscle parameters (muscle mass, muscle density, fat tissue, muscle strength, physical
performance measures or combinations of all) have the best clinical prognostic value. In our study, LMD was a better prognostic marker for OS than LMM and the combination of LMM and LMD had more prognos-tic impact than solitary LMM or LMD. This is in line with studies in patients with DLBCL [11] and several other malignancies [12–14]. A study in metastatic breast cancer patients also revealed the superior prog-nostic relevance of LMMþLMD compared to solitary
Figure 1. Kaplan–Meier curves for OS (A, C, E) and PFS (B, D, F) for patients with LMM vs. no LMM, with LMD vs. no LMD and LMMþLMD vs. all others.
LMM or LMD [21]. The assumption that LMD has more prognostic impact than LMM is persuasive, considering the fact that LMD is especially observed with advanced age [25] and in the presence of comorbid-ities, mainly cardiovascular disease [26]. In these set-tings, LMD is a sign of a deregulated fat metabolism in muscle fibers, resulting in fatty infiltration of muscle and a higher production of pro-inflammatory cyto-kines. In addition to the prognostic significance of LMM and LMD at the start of the treatment, it is important to note that DLBCL patients also develop long-term body composition changes as a result of chemotherapeutic treatment. In a longitudinal retro-spective study of 342 DLBCL survivors, the prevalence of LMM after chemotherapy was 37.9%, whereas 20.7% of these patients did not have LMM at the start of treatment [27]. In another study with DLBCL patients undergoing allogeneic hematopoietic stem cell transplantation (HSCT), the prevalence of LMM was 55% at baseline and 75% 2.5 years after allogeneic HSCT [28]. In these studies, the development of LMM after chemotherapy was associated with higher age,
>5% weight loss during chemotherapy and having LMM at baseline, therefore possibly indicating vulner-able patients. The prognostic impact of muscle loss during chemotherapy is yet to be established.
Our study has several limitations. This was a retro-spective study, where selection bias might have occurred. Furthermore, because of the sample size, there may not have been enough power to truly estab-lish the lack of prognostic impact of solitary LMD. This needs to be confirmed in a larger patient cohort. Also, the number of younger patients (<70 years) was rela-tively small. More studies are needed to explore the
prognostic impact of muscle measures in younger patients with DLBCL. However, this study compared muscle measures in a cancer population with healthy reference subjects in a first attempt to standardize muscle measurements worldwide. The estimated for-mula to calculate a gender-, age- and BMI-specific Z -score has the potential to easily identify patients with LMM or LMD. It must be noted that the healthy popu-lation in this study is from the Netherlands and mainly Caucasian. Therefore, this formula might not be applic-able in all geographic regions. Other healthy reference populations need to be established according to ethni-city and geographic region.
In conclusion, the combination of LMM and LMD is independently associated with impaired PFS and OS in DLBCL patients. The presence of LMM and LMD was not related to preexisting comorbidities or unfavorable lymphoma characteristics, indicating that the combin-ation of LMM and LMD is a lymphoma-independent risk factor for shorter survival, possibly because it more often results in premature termination of chemotherapy and as a consequence, a lower CR-rate. Studies are needed to investigate the prognostic impact of LMM and LMD in DLBCL prospectively and to investigate if optimization of LMM and LMD during chemo-immunotherapy results in a higher CR-rate and prolonged survival. This might result in the identifica-tion of possible roles for muscle measurements in drug dosing and treatment decision-making. To achieve that, standardization of muscle measurement is needed. We recommend to measure both LMM and LMD or to measure sarcopenia, which is the combin-ation of LMM and impaired muscle strength or phys-ical performance. To define patients with LMM or LMD, the Z-scores in this study derived from the healthy reference population could be used after val-idation in an independent dataset.
Acknowledgements
The authors thank the registration team of the Netherlands Comprehensive Cancer Organization (IKNL) for the collection of data for the Netherlands Cancer Registry as well as IKNL staff for scientific advice. We especially thank Dr. A. Dinmohamed, for the dedicated data collection. We thank Suze Roodenburg for the identification of the L3-landmark on all CT images, in order to prepare them for CT-based muscle measurement.
Disclosure statement
No potential conflict of interest was reported by the author(s).
Table 3. Cox proportional hazard models PFS.
Univariable Multivariable HR 95% CI pvalue HR 95% CI pvalue Age 1.03 1.01–1.05 0.01 1.02 1.00–1.04 0.11 Male 0.90 0.53–1.54 0.70 1.11 0.63–1.94 0.72 BMI 0.94 0.89–0.94 0.94 0.97 0.91–1.03 0.31 IPI 1.66 1.31–2.10 <0.001 1.51 1.16–1.95 0.002 Z-score SMI (continuous) 0.92 0.74–1.14 0.44 0.97 0.77–1.23 0.80 Z-score MA (continuous) 0.77 0.60–1.99 0.04 0.93 0.70–1.22 0.59 LMM 1.26 0.74–2.16 0.39 1.19 0.69–2.04 0.53 LMD 1.74 0.99–3.08 0.06 1.43 0.80–2.55 0.23 Both LMM and LMD 2.48 1.32–4.64 0.01 2.16 1.14–4.08 0.02 A multivariable Cox proportional hazard model was performed with all basic patient characteristics (above the line), after which each muscle par-ameter (below the line) was added to this model in a separate Cox pro-portional hazard model.
BMI: body mass index; IPI: international prognostic index; LMD: low muscle density; LMM: low muscle mass; MD: muscle density; PFS: pro-gression free survival; SMI: skeletal muscle index.
ORCID
Peter E. Westerweel http://orcid.org/0000-0002-0746-7039
References
[1] Morton LM, Wang SS, Devesa SS, et al. Lymphoma incidence patterns by WHO subtype in the United States, 1992–2001. Blood. 2006;107:265–276.
[2] [Anonymous]. Available from: http://www.cijfersover-kanker.nl/nkr/index
[3] Juul MB, Jensen PH, Engberg H, et al. Treatment strat-egies and outcomes in diffuse large B-cell lymphoma among 1011 patients aged 75 years or older: a Danish population-based cohort study. Eur J Cancer. 2018;99:86–96.
[4] Rier HN, Jager A, Sleijfer S, et al. The prevalence and prognostic value of low muscle mass in cancer patients: a review of the literature. Oncologist. 2016; 21:1396–1409.
[5] Shachar SS, Williams GR, Muss HB, et al. Prognostic value of sarcopenia in adults with solid tumours: a meta-analysis and systematic review. Eur J Cancer. 2016; 57:58–67.
[6] Pamoukdjian F, Bouillet T, Levy V, et al. Prevalence and predictive value of pre-therapeutic sarcopenia in cancer patients: a systematic review. Clin Nutr. 2018; 37:1101–1113.
[7] Camus V, Lanic H, Kraut J, et al. Prognostic impact of fat tissue loss and cachexia assessed by computed tomography scan in elderly patients with diffuse large B-cell lymphoma treated with immunochemotherapy. Eur J Haematol. 2014;93:9–18.
[8] Lanic H, Kraut-Tauzia J, Modzelewski R, et al. Sarcopenia is an independent prognostic factor in elderly patients with diffuse large B-cell lymphoma treated with immunochemotherapy. Leuk Lymphoma. 2014;55:817–823.
[9] Nakamura N, Hara T, Shibata Y, et al. Sarcopenia is an independent prognostic factor in male patients with diffuse large B-cell lymphoma. Ann Hematol. 2015;94: 2043–2053.
[10] Go SI, Park MJ, Song HN, et al. Prognostic impact of sarcopenia in patients with diffuse large B-cell lymph-oma treated with rituximab plus cyclophosphamide, doxorubicin, vincristine, and prednisone. J Cachexia Sarcopenia Muscle. 2016;7:567–576.
[11] Chu MP, Lieffers J, Ghosh S, et al. Skeletal muscle density is an independent predictor of diffuse large B-cell lymphoma outcomes treated with rituximab-based chemoimmunotherapy. J Cachexia Sarcopenia Muscle. 2017;8:298–304.
[12] Rier HN, Jager A, Sleijfer S, et al. Low muscle attenu-ation is a prognostic factor for survival in metastatic breast cancer patients treated with first line palliative chemotherapy. Breast. 2017;31:9–15.
[13] Antoun S, Lanoy E, Iacovelli R, et al. Skeletal muscle density predicts prognosis in patients with metastatic renal cell carcinoma treated with targeted therapies. Cancer. 2013;119:3377–3384.
[14] Hayashi N, Ando Y, Gyawali B, et al. Low skeletal muscle density is associated with poor survival in
patients who receive chemotherapy for metastatic gastric cancer. Oncol Rep. 2016;35:1727–1731. [15] Cheson BD, Fisher RI, Barrington SF, et al.
Recommendations for initial evaluation, staging, and response assessment of Hodgkin and non-Hodgkin lymphoma: the Lugano classification. J Clin Oncol. 2014;32:3059–3068.
[16] Shen W, Punyanitya M, Wang Z, et al. Total body skel-etal muscle and adipose tissue volumes: estimation from a single abdominal cross-sectional image. J Appl Physiol. 2004;97:2333–2338.
[17] Prado CM, Lieffers JR, McCargar LJ, et al. Prevalence and clinical implications of sarcopenic obesity in patients with solid tumours of the respiratory and gastrointestinal tracts: a population-based study. Lancet Oncol. 2008;9:629–635.
[18] van Vugt JLA, van Putten Y, van der Kall IM, et al. Estimated skeletal muscle mass and density values measured on computed tomography examinations in over 1000 living kidney donors. Eur J Clin Nutr. 2019;73: 879–886.
[19] Rier HN, Jager A, Meinardi MC, et al. Severe sarcopenia might be associated with a decline of physical inde-pendence in older patients undergoing chemotherapeu-tic treatment. Support Care Cancer. 2018;26:1781–1789. [20] Kuwada K, Kuroda S, Kikuchi S, et al. Sarcopenia and
comorbidity in gastric cancer surgery as a useful com-bined factor to predict eventual death from other causes. Ann Surg Oncol. 2018;25:1160–1166.
[21] Prado CM, Baracos VE, McCargar LJ, et al. Sarcopenia as a determinant of chemotherapy toxicity and time to tumor progression in metastatic breast cancer patients receiving capecitabine treatment. Clin Cancer Res. 2009;15:2920–2926.
[22] Joglekar S, Nau PN, Mezhir JJ. The impact of sarcope-nia on survival and complications in surgical oncol-ogy: a review of the current literature. J Surg Oncol. 2015;112:503–509.
[23] Nipp RD, Fuchs G, El-Jawahri A, et al. Sarcopenia is associated with quality of life and depression in patients with advanced cancer. Oncologist. 2018;23: 97–104.
[24] Hopkins JJ, Sawyer MB. Interactions of lean soft-tissue and chemotherapy toxicities in patients receiving anti-cancer treatments. Cancer Chemother Pharmacol. 2018;82:1–29.
[25] Anderson DE, D’Agostino JM, Bruno AG, et al. Variations of CT-based trunk muscle attenuation by age, sex, and specific muscle. J Gerontol A Biol Sci Med Sci. 2013;68:317–323.
[26] Aubrey J, Esfandiari N, Baracos VE, et al. Measurement of skeletal muscle radiation attenuation and basis of its biological variation. Acta Physiol. 2014;210:489–497. [27] Xiao DY, Luo S, O’Brian K, et al. Longitudinal body
composition changes in diffuse large B-cell lymphoma survivors: a retrospective cohort study of United States veterans. J Natl Cancer Inst. 2016;108:djw145. [28] DeFilipp Z, Troschel FM, Qualls DA, et al. Evolution of
body composition following autologous and allogen-eic hematopoietic cell transplantation: incidence of sarcopenia and association with clinical outcomes. Biol Blood Marrow Transplant. 2018;24:1741–1747.