Exploring factors that affect performance on introductory
programming courses
Krista Longi
Master’s Thesis
UNIVERSITY OF HELSINKI Department of Computer Science
Faculty of Science Department of Computer Science Krista Longi
Exploring factors that affect performance on introductory programming courses Computer Science
Master’s Thesis September 26, 2016 70
Computer science education, CS1, Bayesian networks
Researchers have long tried to identify factors that could explain why programming is easier for some than the others or that can be used to predict programming performance. The motivation behind most studies has been identifying students who are at risk to fail and improving passing rates on introductory courses as these have a direct impact on retention rates. Various potential factors have been identified, and these include factors related to students’ background, programming behavior or psychological and cognitive characteristics. However, the results have been inconsistent.
This thesis replicates some of these previous studies in a new context, and pairwise analyses of various factors and performance are performed. We have data collected from 3 different cohorts of an introductory Java programming course that contains a large number of exercises and where personal assistance is available. In addition, this thesis contributes to the topic by modeling the dependencies between several of these factors. This is done by learning a Bayesian network from the data. We will then evaluate these networks by trying to predict whether students will pass or fail the course. The focus is on factors related to students’ background and psychological and cognitive characteristics.
No clear predictors were identified in this study. We were able to find weak correlations between some of the factors and programming performance. However, in general, the correlations we found were smaller than in previous studies or nonexistent. In addition, finding just one optimal network that describes the domain is not straight-forward, and the classification rates obtained were poor. Thus, the results suggest that factors related to students’ background and psychological and cognitive characteristics that were included in this study are not good predictors of programming performance in our context.
ACM Computing Classification System (CCS):
Social and professional topics∼Computer science education
Computing methodologies ∼Bayesian network models
Tiedekunta — Fakultet — Faculty Laitos — Institution — Department
Tekijä — Författare — Author
Työn nimi — Arbetets titel — Title
Oppiaine — Läroämne — Subject
Työn laji — Arbetets art — Level Aika — Datum — Month and year Sivumäärä — Sidoantal — Number of pages
Tiivistelmä — Referat — Abstract
Avainsanat — Nyckelord — Keywords
Contents
1 Introduction 1
2 Performance on introductory programming courses 4
2.1 Student’s background . . . 5
2.2 Psychological and cognitive factors . . . 7
2.3 Data-driven variables . . . 9
2.4 Methods used for modeling effect on performance . . . 12
3 Bayesian networks 13 3.1 Basics . . . 15
3.2 Learning Bayesian networks . . . 17
3.3 Inference in Bayesian networks . . . 20
3.4 Bayesian networks in modeling student performance . . . 21
4 Research design and methodology 24 4.1 Context . . . 26
4.2 Factors included in the study . . . 27
4.3 Data preprocessing . . . 33
4.4 Learning the network structure and parameters . . . 34
4.5 Inference algorithm and classification . . . 37
5 Experiments and results 40 5.1 Replication of previous studies . . . 41
5.2 Modeling relationships between factors that affect performance 45 5.3 Predicting performance on the course . . . 48
6 Discussion 51
7 Conclusions and suggestions for future work 54
1
Introduction
Researchers have long attempted to identify factors that could explain why learning to program is easier for some than the others. That is, the goal has been to determine what contributes to the ability to learn to program,
programming aptitude. Also, being able to predict students’ performance on programming courses provides an opportunity for early interventions. Several factors that potentially affect programming aptitude or performance have been identified in many previous studies. These include factors that are related to students’ background, programming behavior and psychological and cognitive characteristics. However, there is little consensus on these factors as the results have often been inconsistent, and many studies need further verification of the results in different contexts. This thesis focuses on both background and psychological and cognitive factors and takes steps towards understanding their relationship with programming aptitude and performance.
The research on predicting performance on introductory programming courses dates back over 40 years [21]. It initially started with the need to recognize good employees [14], but the focus has since shifted to predicting student’s performance when studying programming [2, 21, 112, 113, 115, 119]. Special interest has been put into studying the introductory programming course at universities, often referred to as CS1. This course is especially important as success in the beginning can determine whether the student continues with the major or not. Many Computer Science programs have reported poor retention rates [7], and it can be possible to improve these rates through the introductory courses.
Introductory programming courses have struggled with high failing rates with estimated one-third of the students failing on average worldwide [10,114]. Being able to recognize students who struggle with their studies allows us to offer additional help and support to these students. Introductory courses often have a lot of participants, and thus it is not always possible for the lecturer to know how the class is doing before the final exam. Early interventions can be beneficial for many students, so having a method to recognize the need for help early on is important. When recognizing the students at risk,
interventions can also be targeted only to this particular group.
Identifying the factors that contribute to programming aptitude can also help us to understand how students learn to program, which in turn can help to plan the needed intervention. This knowledge can also be used to improve teaching in general. Same teaching methods do not work for everyone and identifying students individual needs can be very beneficial. For example, the same teaching techniques that help inexperienced students might not work for experienced learners [55].
In addition, many countries have recently introduced or are planning to bring programming as a part of the curriculum in primary or secondary school [9, 39]. This creates additional challenges as the students are even younger, and on the other hand, the teachers might not have any previous experience in teaching programming. Thus, a better understanding of the learning process is especially important when planning these new curriculums.
However, in many countries programming is not a part of the curriculum even in secondary school yet [39]. This can be a problem when considering admissions to programming related degrees. As the students have no previous knowledge of the field, the admission criteria need to be based on success in other fields and other factors. Knowing what kind of background and characteristics help students to succeed in their programming courses helps to plan these admission criteria.
Previous studies have been able to identify numerous potential predictors of performance, including variables related to students’ background, psy-chological and cognitive characteristics and programming behavior. This thesis focuses on factors that do not change or change slowly; that is the demographic factors as well as different psychological and cognitive factors. Most previous studies have only focused on one or few factors, and thus many of them have only been studied in one or two contexts, and further replication of these results is needed. As variables related to programming behavior model students’ current knowledge and skills, these variables have been excluded. Factors related to programming behavior have already been found to be good predictors in different contexts [2, 22, 80, 113]. The results with other variables are less clear, but better knowledge could help to improve introductory programming courses.
Most of the studies to date have been studying simple correlations between different predictors and the performance measure [11–13, 18, 113, 118], but other methods such as t-test [11, 113] or linear regression [88] have also been used. However, the studies also have many limitations, and the results between different studies have been inconsistent and varied depending on the context. Thus replication of the previous studies in different contexts is needed, and computing the correlations for several different variables also in our context is one of the contributions of this thesis.
The method of using simple correlations has many limitations. For ex-ample, correlation does not always imply causality but the two correlating variables can be coincident effects of a common cause. Correlations can also only find linear relationships. In addition, these predictors are most likely not independent of each other, so understanding the relationships between the predictors can also bring valuable information. Modeling the domain as a whole allows us to flexibly solve different questions from classification to prediction. Speculating about causalities is also possible using the dependen-cies. Constructing a causal network that describes the domain can help in answering questions like what will happen, if we can, for example, improve the learning strategies of the students. Ideally, including more predictors can also improve the prediction accuracy. Thus, another contribution of this the-sis is to simultaneously study several different variables, their relationships, and effect on performance.
We have chosen to use Bayesian networks [78] to model the domain. Bayesian networks are graphical models that describe a joint probability distribution for the whole domain in an intuitive and compact way. They have been widely used in different fields such as medicine, finance, and industry [84]. They are a tempting tool for studying student performance, as they are able to model uncertainty, and the graphical model is intuitive to read. Also, as Bayesian networks have gained a lot of interest in recent years, several tools and tutorials for practical applications exist [4, 71, 98]. Bayesian networks have already been applied in the context of predicting educational performance [8, 48, 99], just not in the context of programming. This thesis is organized as follows. In Sec. 2 we explore the factors that have been used to predict success previously in the literature. Section 3
provides an introduction to the method used in this study, Bayesian networks. The methodology and research questions are presented in Sec. 4 and the results in Sec. 5. Finally, the results are discussed in Sec. 6, and Sec. 7 provides conclusions as well as some suggestions for future work.
2
Performance on introductory programming courses
Predicting performance on introductory programming courses is a widely studied problem, and the motivation behind these studies is usually the high failing rates [10, 114]. Ideally, we want to be able to recognize the students who are struggling early on during the course, so that those students can then be offered additional help and support. On the other hand, successful students could be offered additional challenges to also improve their learning experience. Understanding the reasons behind failing or succeeding can help to plan these interventions and teaching methods in general.
The work started with the need to recognize good employees and to predict their success in training [14]. Since then, the main focus of research has shifted towards studying programming courses, especially introductory programming courses. Programmer Aptitude tests (PAT) were a common tool at the beginning for companies to find employees, but often the test results did not strongly relate to performance on the job [70]. Later, studies have proposed various predictors. These include factors related to students’ background, such as previous academic success [11,93,113,119] and previous programming experience [11, 45, 49, 93, 107, 113, 117, 119] as well as psychological and cognitive factors, such as self-efficacy [85, 116, 119] and self-esteem [12, 113]. Some studies have also included demographics like gender, age and major [11, 93].
More recently, as it has become more and more common to collect log data on introductory programming courses [51, 89], newer studies have also included variables based on this data [22, 52, 112, 113]. These variables try to capture students’ behavior while they are solving exercises, for example by taking into account how much time they spend dealing with errors.
When predicting performance, and important thing to consider is of course how to measure it. As most studies have focused on predicting performance
on introductory programming courses, the final grade [12, 13, 85, 93, 116] or midterm grade [80, 118, 119] is a natural choice. Often this means a number between 0 and 100 [12, 13, 18, 119] or on a smaller scale such as 1 to 5 or similar [93, 117]. In most cases, the grade consists of performance in exercises and the final exam, though final exam usually makes up for most of the grade [12, 13, 116, 118]. Exam and lab performance have also been examined separately [107], and other more specific performance measures have also been used [2, 62].
This chapter introduces some of the most common predictors used in literature collecting results from several different studies. These can roughly be divided into three categories: student’s background, psychological and cognitive factors and data-driven factors. All these three categories are discussed below. Section 2.4 then describes the methods used in these studies. Most of the studies to date have examined correlations between these factors and a performance measure, but there are also some studies that have aimed to examine the dependencies between different predictors.
2.1 Student’s background
Different factors related to students’ backgrounds are attractive as predictors as they are usually easy to collect, or they might be already available. For example, grades from secondary school have often already been collected during the admission process. Also, variables related to students’ backgrounds are usually used as admission criteria to universities. If we can better understand which of these characteristics allow students to succeed in their studies in computer science, we can perhaps improve the admission processes. However, some information, like previous programming experience, can often be only obtained through questionnaires and therefore requires more effort to collect.
The effect of especially programming experience on programming per-formance has been studied by many researchers [45, 49, 113, 117–119]. Ac-cording to many studies, previous programming experience does seem to have an impact on the success of the students on introductory programming courses [45, 49, 113, 118, 119], but some studies did not find any significant
relationships between these two variables [11, 107]. Watson et al. discovered that while previous programming experience can predict the success of stu-dents, specific variables such as the number of languages known had only weak correlations with the performance [113]. In addition, while Holden and Weeden found a difference in the results of experienced and non-experienced students on the first introductory course, this difference disappeared in the later courses [49].
Some studies have found that also non-programming related computer experience can be related to programming performance [118, 119], but this has been studied much less than previous programming experience. For example, playing computer games has been shown to have a negative effect on the course grade [118, 119].
In addition to previous experience, researchers have studied the effect of previous academic success. Researchers have been especially interested in the influence of mathematics background on success in programming, and it has been found to be a significant predictor in many studies [11, 18, 118, 119]. Wilson et al. even found mathematics background to be a stronger predictor than previous programming experience [119]. However, as with previous programming experience, there are also studies that did not find any link between previous math background and success on the introductory programming course [107, 113].
Though mathematics background has been most extensively studied, some studies have included success in other subjects. Bergin and Reilly found that previous physics and biology grades have moderate but significant correlations with performance in the final exam, but surprisingly there was no relationship between chemistry grade and the final exam score [11]. Byrne and Lyons also explored the predictive power of grade achieved in the native language or second language, but they found no significant correlations [18]. Watson et al. found no significant correlations between college grade point average (GPA) and success on an introductory programming course, but high school GPA was a moderate predictor [113].
Many computer science programs also suffer from having only a small minority of women as students [32, 87]. This is perhaps one reason why many researchers have also been interested in the effect of gender in success in
introductory programming courses. Perhaps males have better programming aptitude or females are discouraged by the male-oriented study environment. However, most studies have found that gender has no effect on programming performance [18, 81, 107, 113, 115, 118], though different results also exist [63].
2.2 Psychological and cognitive factors
There has been a lot of interest in using different psychological and cognitive factors extracted from questionnaire data to predict students’ performance on a programming course. These are known to affect success, as good performance is not only dependent on skills, but also individuals ability to use those skills effectively. For example, self-efficacy affects many aspects of learning like persistence and use of cognitive strategies [5]. Weak self-efficacy can be improved with positive personal experiences [5], and this can, in turn, be a way to improve students’ performance.
Studying psychological factors as predictors can be helpful in under-standing the process that students go through when learning. Thus, the information can be useful when designing the teaching methods. However, the problem with psychological and cognitive factors is that they often require questionnaires or tests, that can sometimes be lengthy and require time to process. Therefore, these factors might not be helpful predictors if the goal is to intervene early on during the course. However, the variables can still bring valuable information about what kind of students are at risk to fail. This section presents the most common psychological and cognitive factors used in computer education studies. Most of these have been applied in other fields as well as in computer science.
Different students have different ways to approach new material and learning tasks as well as to process information, and these traits are called students’learning styles. Several theories of learning styles exist, but two of the most common ones areKolb’s Learning Style Inventory (LSI) [57] and
Gregorc style delineator (GSD) [44]. LSI has a standardized questionnaire, where individuals rank potential endings for 12 sentences on a scale of 1 to 4. The result is a score for the individual’s predisposition toward concrete experience, reflective observation, abstract conceptualization, and active
experimentation. However, the correlations between the four dimensions and performance in programming courses were found to be either not significant or weak [19, 23, 30, 113]. GSD uses four dimensions similarly to LSI: concrete random, concrete sequential, abstract random, and abstract sequential [44]. The dimensions have shown to have weak or moderate correlations with programming performance [62, 63, 113].
Motivated Strategies for Learning Questionnaire (MSLQ) [82, 83] is a questionnaire designed to assess students’ motivations and learning strategies. It consists of two parts, a motivation section, and a learning strategies sec-tion, that can be administered individually. The learning strategies section measures nine different scales regarding students’ cognitive, meta-cognitive, and resource management strategies [83]. The motivation section consists of six scales that can be divided into three categories: value, expectancy, and affect [83]. Not many studies have applied MSLQ in the context of programming yet. For the motivation section, two studies have found signifi-cant correlations between success and total score for MSLQ, intrinsic goal orientation, and self-efficacy for learning and performance. [12, 113]. One of these studies also found correlations with task value and control of learning beliefs [12]. The results with learning strategies have been more inconsistent. While Bergin et al. found significant, strong correlations for seven out of nine scales [13], Watson and Godwin found significant, moderate correlations only for critical thinking and effort regulation [113].
Self-efficacy is a person’s judgment of their ability perform tasks and reach goals [5]. Self-efficacy is related to certain domains, which means that person’s self-efficacy can vary depending on the task. Self-efficacy for learn-ing and performance is also one of the subcategories ins MSLQ motivation questionnaire. As mentioned above, it has been found to correlate with suc-cess [12,113]. Self-efficacy has also been studied with other questionnaires, for example by using the Computer Programming Self-Efficacy Scale developed by Ramalingam and Wiedenbeck [86]. It has been shown to correlate with success in introductory programming courses [107]. However, Wiedenbeck et al. found no significant correlations between pre-self-efficacy, that is the self-efficacy measured at the beginning of the course, and performance [117]. Self-efficacy measured at the end of the course, post-self-efficacy, correlated
with the performance also in their study [117]. On the other hand, pre-self-efficacy has been shown to even have a negative correlation with performance among non-majors [116].
Another factor that has been studied is the explanations that students give to their success, attribution of success. The students were asked to rank four reasons for their success: attribution to ability, attribution to task difficulty, attribution to luck, and attribution to effort. Again, the results have been somewhat inconsistent. Attribution of success to luck has been shown to correlate with performance on introductory programming courses by three studies [107,113,119], but only two studies found correlations with attribution to task difficulty and efforts [112, 119] and one study with attribution to ability [119].
Self-esteem is a person’s evaluation of their worth. Rosenberg’s self-esteem scale (RSE) [92] has been widely used as a measure for self-self-esteem. It contains ten statements that the students evaluate on a four-point scale. Though several studies have linked self-esteem to achievement at school [50] and RSE is a widely used measure in general, only two studies have measured RSE in the context of programming. These studies had questions that were modified to relate them to programming, and while Bergin et al. found a moderate correlation between the score and performance [11], Watson et al. found no significant correlation [113].
The variables mentioned above are perhaps the most studied ones, but researchers have also been interested in predictors like mental models [85,117], comfort level [118] and achievement goals [124]. For example, Wilson found that comfort level was the strongest predictor out of 12 variables in their context [118].
2.3 Data-driven variables
As the amount of data collected on introductory programming courses constantly increases, there has been more and more interest in using this data to predict success in introductory programming courses. Several systems that collect data while students solve their exercises have been developed [17, 109]. These systems collect data with different granularities: on submission level,
snapshot level or keystroke level [110].
Data-driven variables can offer information fast without requiring any extra effort from the students. Many traditional predictors presented in Sec. 2.1 and Sec. 2.2 require the students to complete questionnaires or tests that can sometimes be lengthy. Also, processing these tests may require a lot of time and make early interventions difficult. With data-driven variables, the collection of the data is continuous, and thus it can also reflect the progress that students make during the course. Tests taken once during the course do not offer this possibility.
Data-driven variables aim to model students’ programming behavior, and even variables that seem simple can predict student’s success. Watson and Godwin extracted ten measures that were based on analyzing event pair-ings [113]. As they had previously discovered, that just counts of events were not good predictors [112], they measured the percentage of analyzed pairings out of all pairings. Nine of the tested measures had significant and strong or moderate correlations with performance [113]. Good prediction accuracy was also achieved by using features based on total amount of time spent and the correctness of the solution achieved on specific exercises [2]. Piech et al. constructed a graphical model that describes students’ programming process, and this model was used to predict whether the student will struggle later on during the course [80].
There are also measures that have aimed to quantify students’ overall programming behavior. The Error Quotient (EQ) was first introduced by Jadud to quantify students’ struggle with syntax errors [52]. It examines consecutive pairs of compilation events, adds to the score if both compilation events in the pair end to an error, and adds extra points if the events end to the same type of error [52]. Jadud himself observed only weak correlations between the EQ and performance on the course, but his data only included programming data from times that students were working in computer labs, and therefore he was missing an unknown amount of data [52]. Other studies have found that EQ explains about 10 – 30% of the variance in students performance when using Java programming language [103, 112, 113] and about 3% when using C++ [22].
introduced their own measure, theWatwin score [112]. The Watwin score, like the EQ, is also formed by examining pairs of compilation events, but it introduces several new qualities. The method that Watson et al. use for pairing the events is different, and they also account the time that student’s take between these events into the scores [112]. The idea of the measure is to give a bigger score to students who spend more time to resolve a specific type of error than their peers. The results with Watwin score have in general been better than with EQ [22, 112, 113], but still inconsistent. Watson et al. themselves found that Watwin score accounts for about 36–42% [112, 113] of the variance in students performance when using Java as the programming language on the course. However, according to another study, Watwin score accounts only for 12% of the variance in final grades, though the language used in this study was C++ and the course studied CS2 instead of CS1 [22].
While EQ and Watwin score focus on the compilation behavior of the students, Carter et al. [22] wanted a measure that also considers other aspects of programming behavior, like debugging and eliminating semantic errors. They introduced a new measure, a Normalized Programming State Model
(NPSM), that aims to measure the syntactical and semantical correctness of students’ programs. The NPSM is based on the time that a student spends in each of 11 possible states while programming relative to the total time spent programming [22]. Carter et al. themselves found that NPSM accounted for 36% of the variance in students’ final grades [22]. The language that the students used in their study was C++ and the data was collected on a CS 2 course instead of a CS 1 course.
Also, different kinds of data-driven variables that are not based on programming data have been used. For example, students’ web usage and participation in online discussions on a Moodle course have been used to predict performance [90, 91].
Using data-driven variables in predicting students’ success in introductory programming courses is still relatively new, and fewer studies have focused on them than on background or psychological and cognitive factors. However, the results have been promising. Watson et al. found that data-driven variables, in general, are stronger predictors of performance than traditional variables [113]. They tested 50 different variables, and all the strongest
predictors were based on programming data, except for self-efficacy [113]. However, there are still issues. For example, these measures seem to yield somewhat inconsistent results depending on the context [79], for example when using different programming languages [22, 79, 112, 113].
2.4 Methods used for modeling effect on performance
Several studies have attempted to identify factors that affect success in intro-ductory programming courses. The methods in most studies are very similar focusing on pairwise analyses between the variables and the performance measure. However, some studies have also used multiple variables to predict performance.
Most studies that have tried to identify good predictors have focused on studying the relationships between one predictor and the and course or exam grade independently by using either correlations [11, 12, 18, 107, 113, 115, 119] or simple linear regression [22, 88]. For example, Watson and Godwin analyzed the correlations between 50 different variables and course performance [113]. However, computing this may correlations raises the risk of obtaining statistically significant results by chance. This is known as the multiple comparisons problem. Many researchers have also performed t-tests to compare the mean scores of students grouped by some of the variables [11, 18, 81, 107, 118].
In addition, some studies have also attempted to model several factors at the same time. Wilson et al. utilized a general linear model to examine the effect of multiple variables. Rountree at al. used decision trees in predicting whether a student will fail or pass a CS1 course [93]. The data was collected with a questionnaire including questions about the students’ background, working status and expectations. They were able to identify some features that put the students at risk of failing rather than explicitly identifying the students who will fail. Their results indicated that students who are likely to fail had similar answers to questions on academic background, math experience, year of study, age, and expectation of a grade [93].
Some studies have constructed a graphical model based on previous research and then used path analysis to test the model. For example, the
relationships between previous programming experience, pre self-efficacy, post self-efficacy, mental models and the final grade of the course have been studied this way [85, 117]. The unexpected finding here was that previous programming experience does not seem to have on effect on students’ mental models unlike the researchers expected [85, 117]
Lau and Yu used Partial Least Squares (PLS) modeling to study rela-tionships between six different variables: gender, learning styles, mental models, Band, MOI, and programming performance [63]. PLS modeling can be used to explore relationships between variables. It combines the previously mentioned multiple regression and path analysis among other similar methods, and again, in this case, the hypothesis of relationships was based on previous studies. All the studied variables were found to relate to performance except for gender, which only was related to mental models [63].
More recently, some studies have compared various machine learning methods in predicting performance [2, 80, 91]. For example, Ahadi et al. [2] tested the performance of different machine learning methods in predicting students’ performance. They aimed to recognize whether the student would be in the high- or low-performing half of the class, and the variables used in the study were based on students’ background and key log data. They achieved classifier accuracies as high as 93%, and the best results were obtained by using random forests [2]. Random forests learn multiple decisions trees and use averaging to get better results and to reduce over-fitting. Also Romero et al. experimented with different classification methods to predict performance based on participation in online discussions [91]. Piech et al. used Hidden Markov Models to learn a high-level representation of students’ progress when programming, and then k-means clustering to find patterns in these representations [80].
3
Bayesian networks
The method we have chosen here to model the relationships between fac-tors affecting programming performance is Bayesian networks. Bayesian networks [78] are probabilistic graphical models that can be used to represent uncertain domains. They can represent probabilistic dependencies in a set of
variables efficiently and naturally, and also help us to understand the domain as well as to predict future events based on collected data.
Bayesian networks have many features that make them useful for real-life situations such as student modeling. Because of the wide applicability, the interest in Bayesian networks has grown in different fields, and the methods have advanced rapidly. As a result, several commercial and open source packages are now available for researchers to use and apply in their context [4, 71, 98]. Fields, where Bayesian networks have been applied, are numerous, including finding relationships between genes, environment, and disease [102], analyzing gene expression data [43], environmental modeling [106] and much more [84]. Bayesian networks have also already been utilized in student modeling and cognitive assessment in general [8, 99].
One of the advantages of Bayesian networks is that they represent the joint distribution of all the variables, and thus allow modeling the domain as a whole instead of just focusing on one variable. Therefore Bayesian networks can flexibly be used for any inference task. Moreover, they represent the joint distribution in a compact and interpretable way. In addition, Bayesian networks can model uncertainty, which is inevitably present in student modeling. Bayesian networks can also be used to model relationships that are not linear. Many traditional models, such as regression, are not sufficient when the dependencies in the data are non-linear. Also, handling missing data can be naturally incorporated into the analysis, and when it comes to real-life data, especially data collected with questionnaires, missing values can be common. Bayesian networks can also make good predictions even when trained with a limited amount of data [58], and with student analysis the number of students can sometimes be small.
In addition, Bayesian networks can be learned just from the data without defining any initial structure. That means there is no need for initial model constructed by humans, which removes a certain risk to errors. Previous studies that have examined the relationships between variables that affect success on introductory programming courses have tested networks that have been solely defined by humans [85]. However, it is still possible to incorporate previous knowledge in the structure when it is available.
visualize cause-effect relationships in a natural way. As the networks are directed, the direction of the causation can be seen intuitively from the structure. However, the edges between variables do not always indicate causality, and certain assumptions need to be made before cause-effect relationships can be examined. Causalities can provide valuable information about the domain, but the directions of the arrows are not relevant when it comes to probabilistic inference. Even without assuming any causal relationships, it is still possible to get meaningful information from the structure.
This section introduces Bayesian networks and the notation used in this thesis. It starts with describing the needed background information and important definitions in Sec. 3.1. An important part is learning the model, which is presented in Sec. 3.2. Section 3.3 then describes how to extract information from the model. Finally, Sec. 3.4 presents some of the previous work that has used Bayesian networks to model student performance.
3.1 Basics
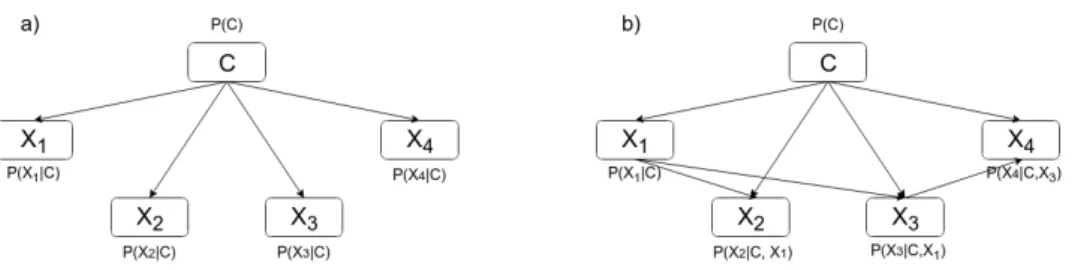
Bayesian networks define a joint distribution for a set of variables in an intuitive and compact way. They are graphical models and consist of two com-ponents: a directed acyclic graph (DAG) and a set of conditional probability distributions. In the DAG, the nodes represent a set of random variables, and the directed arcs represent the conditional dependencies between these vari-ables. Each variable also has a conditional probability distribution associated with it. An example of a Bayesian network can be seen in Figure 1.
More formally, a Bayesian network defines a joint distribution for a set of nrandom variablesX ={X1, ..., Xn}. As it contains two components, it is
formally defined as a pair (G, θG), whereG is the graphical representation,
a directed acyclic graph (DAG), andθG the parameters associated with it.
The DAG G is also defined as a pair (N, A), where N ={1, ..., n} is a set of nodes, where each nodev corresponds to one random variableXv in the
data, andAis a set of arcs between the nodesN. The arcs inGare directed, and by definition, the graph cannot contain any directed cycles. This means, that when starting from any node v there is no way to loop back to that
Figure 1: Example of a Bayesian network for variables X =
{X1, X2, X3, X4, X5} that each can take two possible values. The tables represent the conditional probability distributionsP(Xi|Gi, θ).
same node again by following the directed edges.
In the DAG, a node u is defined as theparent of a nodev if there is an arc fromu tov in the graph. Then, the node v is a child of the nodeu. For example, in Figure 1 node X1 is a parent of node X2. Bayesian network structure can be expressed as a vector G = {G1, ..., Gn}, where Gi is the
parents of variableXi. For example, the network structure in Figure 1 can
be represented asG= ({},{},{X1, X2},{X2},{X3}). Similarly,u is defined as anancestor of v if there is a directed path fromu to v, and v is then a
descendant of u.
Each variable Xi has also table of parametersθi associated with it. θi
de-fines the conditional probability distributionP(Xi|Gi, θ). The paths between
the nodes in the graph express the probabilistic dependencies between the variables. An important feature, the Markov condition, states that each ran-dom variable is conditionally independent of all of its non-descendants given its parents. Thus, as the topology of the graph already holds information about the dependencies, the Markov condition allows storing joint probability
distributions of even large amount of random variables efficiently if there are many independences. The joint probability distribution for the set of variables X= (X1, ..., Xn) represented by a Bayesian networkM = (G, θG)
is given by PM(X1, ..., Xn) = n Y i=1 P(Xi|Gi, θi) (1)
For example, by taking advantage of the conditional independence relation-ships seen in the network presented in Figure 1, the conditional probability of the five variables can be written according to Equation 1 as:
PM(X1, ..., X5) =P(X1)×P(X2)×P(X3|X1, X2)×P(X4|X2)×P(X5|X3)
3.2 Learning Bayesian networks
This section gives a short introduction to learning Bayesian networks. When constructing a Bayesian network, we need to determine its’ structure and the parameters. Out of these two, structure learning is often the harder case, and in this description, more emphasis is put on learning the structure.
Learning the structure can be done from prior knowledge, data, or from a combination of these two. One way to construct a network is to design it based on what we know about the domain. However, most of the time this is not possible as we might not have enough information about the domain, or the task would just be too time-consuming for a human. Therefore, several methods for learning the network from data exists. If available, prior knowledge can also be incorporated into this process. There are two main strategies for learning a network structure from data: constraint-based approachesandscore-based approaches. Some hybrid algorithms that combine
both of the approaches also exist.
The constraint-based approaches are based on conditional independence tests between the variables, and they aim to find a network structure that best explains the found dependencies [100, 108]. From the results of these independence tests, it is possible to, for example, decide the existence of an arc. Several different algorithms are based on this principle but use various methods, such as different kinds of tests and ways to interpret the
results. Examples of these algorithms are IC [108] and PC [100]. Even though constraint-based algorithms are generally fast and can be used even with larger networks [60], score-based approaches tend to produce better results with small data sets or when the independences are weak [122].
In score-based approaches, a set of potential DAGs is defined, and each of them is assigned a score that describes how well the graph represents the dataset. The best DAG is the one with the highest score, so, in the end, the goal is to solve an optimization problem. Most of the scoring criteria are based on either themaximum log-likelihood of the structure or on the posterior probability of the network. Bayesian Information Criterion (BIC) [95] and Akaike Information Criterion (AIC) [3] are both based on the maximum log-likelihood of the structure, to which they add a different penalty term to penalize models that are too complex to avoid over-fitting. Score functions that compute the posterior probability of the network are often referred to asBayesian scores, and they are defined using the Bayes rule. Examples of Bayesian scores are K2 [29] and BD [47].
There are a couple of important properties that a score should fulfill. Most efficient learning algorithms advantage ofdecomposablescores [47]. The score is said to be decomposable if it can be calculated as a sum of scores for individual variables, and the score for each variable is only dependent on the variable itself and its parents. Also, the score should be the same for all
equivalent networks. Two Bayesian networks are said to be equivalent if they define the same probability distribution.
However, the amount of different possible networks grows quickly when the number of variables grows, and finding an optimal network is an NP-hard problem [24, 26]. For moderate-sized data, it is still possible to use exact algorithms. Exact algorithms, unlike heuristic algorithms, always find the optimal solution. As using exact algorithms removes certain uncertainty from the results, there has been interest in developing exact algorithms, even though they run in exponential time. Many of these algorithms are based on dynamic programming [56, 76, 104], but others also exist [20, 38, 95].
In practice, heuristic algorithms are often used for structure learning. Examples of such algorithms are greedy search based algorithms, best-first search [59] and Monte-Carlo methods [42, 68]. Many heuristic algorithms
use decomposable scores to reduce the number of needed computations. As most of the algorithms add, remove or reverse existing arcs in the network, having a decomposable score means that it is possible to just calculate the change in the score. For example, greedy search uses this principle, and in each iteration, it calculates the change in the score for each possible change in the arcs, and chooses the change that maximizes the score [25]. However, like other local search algorithms, it can get stuck on a local maximum, but for example simulated annealing [27] have been used in attempts to solve this problem.
Most practical data contain missing values, and many structure learning algorithms described above cannot handle these situations as described. One approach to addressing the problem is to preprocess the data by either removing all entries with missing data or by filling in the missing values. Removing all observations with missing data can be used if only a relatively small portion of the observations include missing values. However, this is not always the case, and then it is better to impute the missing data. For filling in, some good guesses can be used, and the simplest solution is to us the mean or median of the observations. Better results can often be obtained by estimating a predictive model based on the other variables. For categorical variables, it is possible just to handle the missing values as legitimate by adding an additional category for them.
Some structure learning algorithms also work with missing values. One of the best-known ones is theStructural Expectation Maximization (SEM) algorithm [40]. It is based on the EM principle [34], and many different algorithms based on this principle have since been developed [16,66]. However, in many cases, these algorithms can get stuck on a local maximum. One solution to this is to use random restarts. Another popular group of methods that can handle missing values is based on the Monte Carlo techniques [31, 72, 77].
There are also other challenges to consider. The data might contain additional factors that are just not recorded in the data. This can be seen as a problem of missing data, where all the observations for one variable are missing. Thus, most approaches that are listed above to handle missing values can also be applied in this case. In addition, when the number of
variables grows, the number of possible data vectors increases exponentially with it. This means that we have usually only observed a small fraction of all the data vectors that could be possible to be observed. Also, it might be that the data cannot be naturally described with just one Bayesian network.
3.3 Inference in Bayesian networks
Once the Bayesian network model has been constructed, there is usually interest in extracting information from that model. This is called probabilistic inference or reasoning in the network. Typically, we are given the values for some subset of the variables, and we then want to determine the probability of some other variables being in a certain state. More formally, the aim is to determine a probability P(S1|S2, G, θ), where S1 is the subset of the variables for which we want to determine the probability distribution when we are given the values of the variables in subsetS2 as well as the network Gand its’ parameters θ. For example, we could be interested in finding the probability that a patient has a certain disease given his symptoms.
As Bayesian networks define a joint probability distribution over all the variables, any inference problem can be solved with marginalization. Marginalization refers to summing out over all the irrelevant variables. How-ever, this takes exponential time with respect to the number of nodes in the graph. Like structure learning, probabilistic inference in multi-connected networks has been shown to be NP-hard [28], and the inference algorithms can be divided to exact and approximate algorithms. Sometimes, especially in cases with discrete variables, using exact algorithms is possible, but often computing an exact solution takes too long and different heuristic approaches need to be used.
Exact inference means analytically calculating the conditional probability distribution over the variable or variables of interest. A common method for this is the variable elimination algorithm [33, 123], which is based on doing the marginalization more efficiently by utilizing a factored representation of the joint probability distribution. The idea behind it is to exploit the chain-rule decomposition of the joint distribution and to avoid repeating calculations by storing the already calculated results. However, the query
variables need to be specified in advance, and thus the algorithms needs to be rerun for every new query. The junction tree algorithms [6, 78] avoid this problem by generalizing the variable elimination algorithm. The network is transformed into a tree structure called a junction tree, where a message passing algorithm [54, 64] is then applied. The message passing algorithms are based on nodes passing messages to their neighbors and updating their conditional probability distributions based on the message.
Using exact algorithms is not always possible, and thus several approxi-mate algorithms for inference in Bayesian networks have also been developed. There are many algorithms based on sampling or Monte Carlo methods, and for example Gibbs sampling and the Metropolis-Hasting algorithm can be utilized for approximate inferences [31, 72, 77]. Another group of algorithms is based on variational inference, for example, the mean field methods [74] and loopy belief propagation [121].
3.4 Bayesian networks in modeling student performance
Using Bayesian networks in educational data mining and especially in predict-ing students’ performance has been studied in different contexts. Bayesian networks have been used for predicting performance also in the context of programming, but mainly with variables based on programming behavior and students’ background [2, 91, 109]. Mostly these studies have experimented with several different classifiers, and Bayesian networks have just been one of the classifiers. The results below are reported as in the studies and can not be directly compared. The amount of classes in the tasks varies, and in imbalanced datasets, accuracy can be misleading.
Ahadi et al. used several different classifiers and variables based on students’ background as well as key log data to predict whether the student would be in the high or low performing half of the class [2]. They achieved classification accuracies of 72%–86% depending on the performance measure when using Bayesian networks, but for example, random forests performed better in general. Similarly, Vihavainen used Bayesian networks and key log data to classify students into three groups: fail, pass and excellent [109]. After two weeks of collecting data, he was able to classify 64% of the students
correctly, and at the end of the course 78% of the students.
Romero at al. [91] also used Bayesian networks to predict performance on an introductory computer science course. A Moodle discussion forum was used on the course, and the dataset was constructed from the messages posted on this forum. They compared several different classification and clustering methods, including Bayesian networks, in predicting whether the student will pass or fail. They were able to achieve accuracies as high as 90%.
More examples of using Bayesian networks to predict success in edu-cational contexts can be found in other fields. Bekele and Menzel applied Bayesian networks in predicting students performance on a mathematics course in a senior high school in Ethiopia [8]. Their study and the purpose of the study is very similar to the one presented in this thesis. However, the context and used variables are different. The model included eight variables including math performance, gender, group work attitude, interest for math, achievement motivation, self-confidence, shyness and English performance. They were able to predict correctly in about 64% of the cases whether the student would have below satisfactory, satisfactory or above satisfactory performance [8]. They had 514 samples after removing samples that had positive answers for included lie detector questions, and the most relevant attributes were previous English and math performance.
Also Sharabiani et al. [99] used Bayesian networks when aiming to predict the grade (A, B, C or D/F) of students’ on three core course of an engineering program. They used different demographic and academic factors including gender, age, race, citizenship status and grades achieved on some prerequisite courses. In addition, their proposed model included variables that described the student’s capacity each semester and the level of difficulty of each course for each student. They had included 300 students in the analysis, and their model achieved an accuracy of only 36% on the CS course but 70% and 73% on the physics and mathematics course [99]. They also compared the proposed model with other traditional machine learning methods, and in general produced the best results. Only in the CS course random forests method achieved a better accuracy with 46% [99].
university in general, not just on one course. Hien and Haddaway [48] aimed to predict students’ graduating cumulative Grade Point Average based on applicant background at the time of admission using a Naïve Bayes model, as that yielded best results out of all tested network structures. The motivation behind the study was to find a better way to recognize good applicants. The data set consisted of 1386 master’s students and 212 doctoral students. The prediction accuracy of the master student model was 60% and the doctoral student model 88% when having five categories for the grade. The most important predictors were previous institution and previous cumulative grade point average. The biggest problem they faced with the study was that the model tended to overestimate the performance of students with lower grades due to the imbalance of data: most students accepted to the university have good grades, and thus they have very little data on students with low grade point averages (GPA) [48].
Thai-Nghe et al. [105] performed a similar study where they compared the performance of decision trees and Bayesian networks when trying to predict academic performance. The study was conducted at two different institutions in Asia and included 20492 and 936 students. The attributes in both studies were slightly different but included factors related to previous academic performance and demographics. Attributes such as previous GPA or entry GPA, English performance, institution rank and home country were the most informative ones. They achieved a success rate of 61% when trying to classify the students in one of four classes and a success rate of 66% and 79% when trying to classify the students in one of two classes when using Bayesian Networks [105]. Decision trees performed slightly better.
Misiunas et al. had collected records from 1024 students including vari-ables related to demographics, high school performance, college performance, financial situation and working status. They used pre-college information to predict college performance and achieved an accuracy of 47% with GPA and 55% with degree completion. Using ongoing college attributes yielded in a 75% accuracy in predicting degree completion and 76% accuracy in predicting high school GPA.
Nokelainen et al. [73] studied the relationship of self-attribution theory and mathematical giftedness. The data included 86 students participating
in Mathematics Olympians, 52 students participating in secondary school national mathematics competition and 74 students taking an advanced math-ematics course in a polytechnic that all completed a given Self-Confidence Attitude Attribute Scales (SaaS) questionnaire. Using the 18 variables they were able to reach a classification accuracy of 65% when classifying the students into Olympians, national competition participants, and polytech-nics [73].
Bayesian networks have been used in student modeling in general. In addition to predicting success, they have been applied for modeling item-item relationships [35], students’ behavior within a tutoring system [75] and future group performance in face-to-face collaborative learning [101].
4
Research design and methodology
The aim of this study is to explore variables that affect performance on introductory programming courses. The motivation behind it is to understand reasons or risk factors behind failing a programming course, and at the same time, to understand reasons why some students perform better than others. On the other hand, one goal is to be able to recognize students who are at risk to fail in order to provide assistance and/or individually designed study material for them. The research question can be divided into two parts:
1. Do factors relating to students background and psychological and cogni-tive characteristics affect how well students perform in an introductory programming course, and how do these features depend on each other?
2. Is it possible to predict students’ performance on an introductory programming course using these factors?
The first question aims to study different factors that affect how students learn to program, and how these factors depend on each other. Most studies to date that have studied traditional, questionnaire-based factors have focused on only one or few of them at a time. Here, we are interested in finding a bigger picture of the domain and not to just study individual predictors, but to also see how the predictors relate to each other. Different psychological and cognitive variables can be expected to be dependent on each other,
and understanding these relationships can help to understand how or why certain variables seem to be related to performance. Modeling the domain as a whole allows us to answer flexibly different kinds of questions, such as predicting how different interventions would affect the performance or how a student would perform on the course. As correlations do not imply causation, studying simple correlations does not yet allow us to make conclusions about for example how improving or changing the learning strategies would change the performance.
The data-driven variables described in Sec. 2.3 measure more the current knowledge and skills of the students rather than characteristics that lead to or relate to these skills, and these variables have been excluded. Data-driven variables have already been studied and found to be good predictors in many contexts [2, 22, 80, 113], though there is still a lot to be improved even with these variables. The effect of psychological and cognitive variables as well as students’ background on programming performance have also been studied, but the results have been inconsistent, and only very few studies have included several variables. Thus, there is still perhaps more to achieve in understanding how these factors relate to the learning process and the performance or whether they relate to it at all. Therefore, the focus of this thesis is on psychological and cognitive factors as well as student’s background information. These factors can also be used to predict students’ success before the course has even started, and the information can be used to for example plan admission criteria, or to plan the course structure according to the participants’ needs.
The features included in this study are presented in Sec. 4.2. As most previous studies that have aimed to find factors that affect success on introductory programming courses have calculated correlations between these variables and a selected performance measure, We will also present the correlations measured in this context. The goal, however, is to use Bayesian networks to visualize how these variables depend on each other and on the performance on an introductory course. The methods used for learning the network are explained in Sec. 4.4.
With the second question, we intend to study if it is possible to predict whether a student will fail or pass an introductory programming course.
This is done by using the models constructed in answering the first research question, as well as by experimenting with simpler classifiers. Classification is a common way to evaluate the performance of a model. The two simple classifiers have been added here to see whether the more complicated model can perform any better than these two. The classification methods used in this thesis are described in Sec. 4.5.
4.1 Context
The data for the study comes from three different cohorts of an introductory programming course organized in spring and fall semester in 2015 and in spring semester 2016 at University of Helsinki. The course lasts for seven weeks, and it covers the basics of object oriented programming. The programming language on the course is Java. All course material is available online, and the material for each week includes a comprehensive introduction to the topic or topics of the week, as well as the exercises that are incorporated in the material.
The course focuses more on actual programming than traditional lectures, and thus includes a large amount of practical exercises. A new exercise set is introduced every week, and it typically consists of many small problems that combine into larger programs. The students can work on the exercises either in the computer labs, where they may ask for help from teaching assistants, or they can work on the exercises independently at home. Teaching assistants are available in compute classrooms several hours a week, and they are mostly students that have recently completed the course themselves. A more detailed description of the course organization is found for example in [61, 111].
The course grade consists of three parts: programming exercises (70%), computer exam (15%) and a traditional pen and paper exam (15%). Thus, the course includes a lot of exercises, and each week a new exercise set, that is worth ten points, is published. Unlike the normal paper and pen exam, the computer exam can be done on students’ own time wherever they choose at the end of the course. The students can use the internet and all material during this exam, but asking for help is not allowed. The grade is given on a scale pass/fail, where to pass the course the students needed to collect 70%
(spring 2015) or 75% (fall 2015, spring 2016) of the total course points and to achieve at least half of the points in both of the exams. Spring 2016 also introduced the possibility to achieve a grade 5, which is the best possible grade. To reach this grade instead of just passing, you had to obtain at least 90% of the exercise points and 90% of the exam points.
During the course, there are one or two short questionnaires each week that measure for example students’ learning strategies, motivation, and self-esteem. Answering these questionnaires is voluntary, but students can earn a small amount of extra course points if they decided to fill the forms. The questionnaires are part of the online material, and are always included in the beginning of the topic of the week. This data has not been collected specifically for this study, and the included questionnaires have not been planned specifically for this purpose.
The participants include both computer science majors and other majors. Especially the courses organized during spring semester have a lot of minor students, but the information of students’ majors was not available at this time. There are generally more male students than female students, and the students come from very varying age groups. Table 1 introduces more statistics about the participants and their backgrounds.
4.2 Factors included in the study
The aim of this study is to model factors that affect success in introduc-tory programming courses. The focus is specifically on students attitudes, motivations, learning strategies and background rather than their current skills. Thus, the variables included here are mostly either based on students’ background like presented in Sec. 2.1 or psychological and cognitive variables like presented in Sec. 2.2. All background variables are listed in Table 1 and other variables including the abbreviations used in this thesis as well as some descriptive statistics are listed in Table 2. The variables were chosen from existing data collected previously. More detailed descriptions of these factors are given below.
The most important decision to make is the performance measure. The most common measure used in previous studies is the midterm or final grade
Variable and abbreviation Possible values # of students
Grade (grade) pass 213
fail 87
Gender (gen) female 94
male 155
unknown 51
Age 22 or younger 132
23 or older 123
unknown 45
Programming experience (PE) no experience 195 experience 105 Working status (WS) not working 184
working 69
unknown 47
Table 1: Course participants’ background information for discretized variables
that is as a continuous variable representing a number between 0 and 100 (e.g. [11, 113, 117, 119]). A similar measure in this context is the course points, and that is used as the performance measure when computing correlations. This is a value between 0 and 110, where 100 points are considered to be full points, but as some extra points can be collected by answering the questionnaire or completing additional exercises, some students have collected more than 100 points. As discrete variables are needed for learning a structure for Bayesian network, the grade is used as the performance measure there. However, the course points, and thus also the grade, is heavily affected by the practical exercises, whereas in many other contexts the grade is mostly affected by the exam or exams [11, 113]. Therefore, we have chosen to use the points achieved in the pen and paper exam as another performance measure. This was chosen instead of the computer exam to have more comparable results with previous studies. Also, most students who took the computer exam got full points the mean being 14.04/15 and median 15. Most likely due to the large amount of exercises, the students who make it to the final
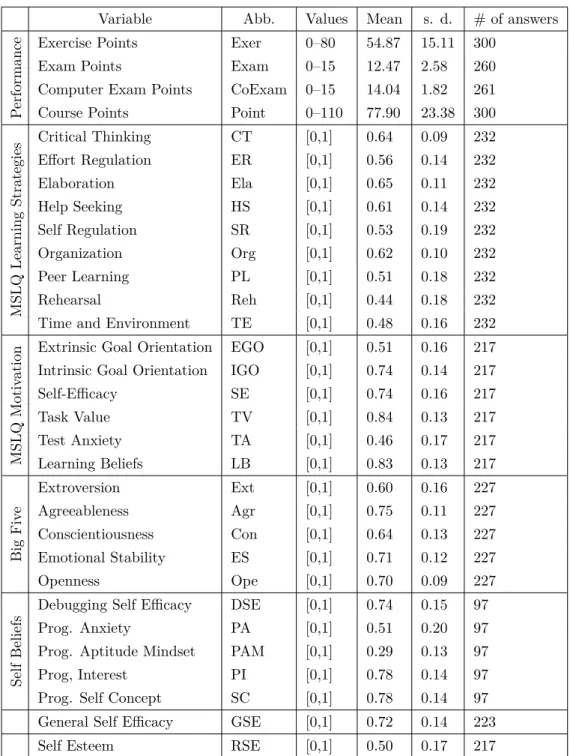
Variable Abb. Values Mean s. d. # of answers
P
erformance
Exercise Points Exer 0–80 54.87 15.11 300
Exam Points Exam 0–15 12.47 2.58 260
Computer Exam Points CoExam 0–15 14.04 1.82 261
Course Points Point 0–110 77.90 23.38 300
MSLQ Learning Strategies Critical Thinking CT [0,1] 0.64 0.09 232 Effort Regulation ER [0,1] 0.56 0.14 232 Elaboration Ela [0,1] 0.65 0.11 232 Help Seeking HS [0,1] 0.61 0.14 232 Self Regulation SR [0,1] 0.53 0.19 232 Organization Org [0,1] 0.62 0.10 232 Peer Learning PL [0,1] 0.51 0.18 232 Rehearsal Reh [0,1] 0.44 0.18 232
Time and Environment TE [0,1] 0.48 0.16 232
MSLQ
Motiv
ation
Extrinsic Goal Orientation EGO [0,1] 0.51 0.16 217 Intrinsic Goal Orientation IGO [0,1] 0.74 0.14 217
Self-Efficacy SE [0,1] 0.74 0.16 217 Task Value TV [0,1] 0.84 0.13 217 Test Anxiety TA [0,1] 0.46 0.17 217 Learning Beliefs LB [0,1] 0.83 0.13 217 Big Fiv e Extroversion Ext [0,1] 0.60 0.16 227 Agreeableness Agr [0,1] 0.75 0.11 227 Conscientiousness Con [0,1] 0.64 0.13 227 Emotional Stability ES [0,1] 0.71 0.12 227 Openness Ope [0,1] 0.70 0.09 227 Self Beliefs
Debugging Self Efficacy DSE [0,1] 0.74 0.15 97
Prog. Anxiety PA [0,1] 0.51 0.20 97
Prog. Aptitude Mindset PAM [0,1] 0.29 0.13 97
Prog, Interest PI [0,1] 0.78 0.14 97
Prog. Self Concept SC [0,1] 0.78 0.14 97
General Self Efficacy GSE [0,1] 0.72 0.14 223
Self Esteem RSE [0,1] 0.50 0.17 217
Table 2: Psychological and cognitive variables and the performance measures included in this study. The table also lists the abbreviations used throughout the figures in this thesis as well as the range of possible values, means, standard deviations and the number of answers for each variable.
weeks also do well on the computer exam. As all students did not participate in the exam, the amount of students included in the analysis in this case is smaller.
As described in Sec. 2, there are several different variables that have been associated with students’ performance in introductory programming courses. However, the results with all of these variables have been incon-sistent. This is understandable, as with student modeling and educational questionnaires there is always a lot of uncertainty present. The courses in different universities vary, including the context, teaching, exercises, pro-gramming languages, etc. Also students’ attitudes towards studying and the course can vary depending on for example the culture or the university. Therefore, it is not easy to pick only some variables that clearly relate to performance on programming courses, but the aim is to examine a wide range of different kind of features. The variables were chosen based on previous studies in predicting success on introductory programming courses and the data available in our context. Most variables chosen have been shown to correlate with programming performance by at least one study.
During the first week of the course, the student’s are asked to answer a questionnaire about their background. The variables extracted from that questionnaire are presented in Table 1. Especially previous programming experience has been extensively studied as a predictor, and many studies have found correlations between it and success on introductory programming courses [45, 49, 113, 118, 119]. Gender, on the other hand, has not been shown to correlate with programming performance [18, 81, 107, 113, 118], but it can have an effect on other variables used here. Age has been studied less in this context, and where it has been included, the population did not include many older students [11]. In this case, as shown in Table 1, we have students from different age groups. Working status of the students can reflect for example on the time and effort they are able to put on the course.
To asses the learning strategies and motivational orientations of the students, we used the Motivated Strategies for Learning Questionnaire (MSLQ) [83]. The instrument was developed to assess these two aspects of college students and is always related to a certain situation. Thus, the results can vary depending on the class or subject. The questionnaire is divided
into two parts. The learning strategies questionnaire is incorporated in the material for week 1, and the section measures nine different variables [83]:
• Critical Thinking: Describes the degree in which the students apply previous knowledge in new situations.
• Metacognitive Self Regulation: Describes the use of these strategies that involve techniques like planning, monitoring and regulating.
• Organization: Describes the use of organization strategies. They involve techniques like outlining and finding main ideas, and they help in constructing connections and in selecting appropriate information.
• Elaboration: Describes the use of elaboration strategies that involve techniques like summarizing, paraphrasing and creating analogies, and thus these strategies help with storing information into long-term memory.
• Rehearsal: Describes the students use of rehearsal strategies. The strategies do not generally help in acquisition of new information, and involve techniques like reciting items that need to be learned from a list.
• Time and Study Environment: Describes students’ ability to manage their time and study environments.
• Effort Regulation: Describes how well the students can control their effort and attention with uninteresting tasks or with distractions.
• Peer learning: Describes the level of collaboration with peers.
• Help Seeking: Describes the ability of the students’ to recognize when they need assistance, and to identify where they can get the needed help.
The motivation section questionnaire is incorporated in the material for Week 2, and it measures six different variables [83]:
• Control Of Learning Beliefs: Describes whether the student believes that his efforts on the task will lead to a positive result.