SoFoCles: Feature filtering for microarray classification based on Gene Ontology
Georgios Papachristoudis
a, Sotiris Diplaris
b,*, Pericles A. Mitkas
ba
MIT Computer Science and Artificial Intelligence Laboratory, Cambridge, MA, USA b
Department of Electrical and Computer Engineering, Aristotle University of Thessaloniki, Greece
a r t i c l e
i n f o
Article history: Received 25 June 2008 Available online 1 July 2009 Keywords: Data mining Semantic similarity Ontologies Bioinformatics Feature filtering Microarray classification
a b s t r a c t
Marker gene selection has been an important research topic in the classification analysis of gene expres-sion data. Current methods try to reduce the ‘‘curse of dimenexpres-sionality” by using statistical intra-feature set calculations, or classifiers that are based on the given dataset. In this paper, we present SoFoCles, an interactive tool that enables semantic feature filtering in microarray classification problems with the use of external, well-defined knowledge retrieved from the Gene Ontology. The notion of semantic similarity is used to derive genes that are involved in the same biological path during the microarray experiment, by enriching a feature set that has been initially produced with legacy methods. Among its other function-alities, SoFoCles offers a large repository of semantic similarity methods that are used in order to derive feature sets and marker genes. The structure and functionality of the tool are discussed in detail, as well as its ability to improve classification accuracy. Through experimental evaluation, SoFoCles is shown to outperform other classification schemes in terms of classification accuracy in two real datasets using dif-ferent semantic similarity computation approaches.
Ó2009 Elsevier Inc. All rights reserved.
1. Introduction
A challenging problem in bioinformatics is the analysis of microarray experiments. Microarrays can monitor the expression of thousands of genes or gene products simultaneously, under varying conditions. Different types of analysis can be applied to the datasets produced, including clustering, classification or den-sity estimation, among others. Recent studies have widely used classification techniques in problems related to cancer-gene expression studies, where a typical problem is the differentiation between tumors based on a set of tissue-specific gene expression
profiles [1–3], or between patients and normal controls [4].
Despite the advantages of such techniques, the sheer data volume coupled with the great asymmetry between the number of genes monitored and the number of different conditions renders the extraction of useful information a formidable task. To tackle this problem, several methods have been exploited, most of them stemming from the field of statistical analysis. The isolation of the most informative genes is achieved by detecting statistical similarities among the features/genes based on their values across the whole dataset. The application of feature filtering methods in microarray classification aims at improving classification accuracy [5], mainly through dimensionality reduction achieved by keeping
the most informative features while rejecting irrelevant and noisy ones[6]. The ‘‘curse of dimensionality”, which can lead to overfit-ting problems, can be minimized by feature filtering. On the other hand, the presence of features that are irrelevant to the problem may affect the discrimination ability of models induced from the data, as well as the extraction of correlations among
them[7].
In microarray analysis problems, the selected features that rep-resent genes are known as marker genes. By selecting groups of features, instead of single features, the dataset is enriched with information regarding the interaction between genes, since the regulation of genes in the same biological path is correlated[8]. Thus, feature filtering can possibly provide a better understanding of the process that has produced the data. Finally, the functionality of new genes can be defined through the study of structural and functional behavior of known marker genes. The information gain [9], the chi-square approach[10], and the relief method[11]are among the legacy methods that have been used in feature selection for microarray analysis so far[12].
Classic feature filtering algorithms have proved quite useful in microarray classification. However, they also exhibit some draw-backs that can be overcome by semantic feature filtering. One drawback is the risk to select features/genes that are highly corre-lated[7]. This usually happens because genes that belong to com-mon biological paths exhibit similar regulation, thus having similar expression profiles. The result is that when using classic feature fil-tering methods, statistically correlated genes receive the highest scores[13]. However, the use of many highly correlated genes does 1532-0464/$ - see front matterÓ2009 Elsevier Inc. All rights reserved.
doi:10.1016/j.jbi.2009.06.002
* Corresponding author. Address: Department of Electrical and Computer Engi-neering, Aristotle University of Thessaloniki, 54124 Thessaloniki, Greece. Fax: +30 2310 996398.
E-mail address:[email protected](S. Diplaris).
Contents lists available atScienceDirect
Journal of Biomedical Informatics
j o u r n a l h o m e p a g e : w w w . e l s e v i e r . c o m / l o c a t e / y j b i nnot guarantee better classification accuracy, since such a selection may lead to information redundancy.
Moreover, if a certain threshold is set in the gene selection pro-cess, there is a high probability of selecting genes that belong only to the biological path with the main influence. As a result, comple-mentary genes that reveal other class labels may not be included in the feature set, since they would receive lower scores. Finally, the number of selected genes always requires human intuition, thus making it difficult to select an optimal feature set. In this way, it is possible to exclude genes that participate in biological paths that might equally contribute in a robust data representation of the problem. Our approach aims to overcome this problem, by using existing biological knowledge in order to allow the reselection of genes that participate in crucial biological paths, ultimately aiming at the improvement of classification accuracy.
Statistical methods cannot incorporate the a priori semantic
knowledge that lies behind the feature set and has been produced by other bioinformatics tools. The need to standardize the func-tions and activity regions of gene products has led to the Gene
Ontology Annotation (GOA) project[14], which is supported by
all major Sequence/Genome Databases, such as SwissProt [15],
InterPro [16], Gramene [17], MGI [18], FlyBase [19], DictyBase
[20], and TAIR[21]. So far, Gene Ontology analysis tools for micro-array data have been developed in order to look up for existing annotations, cluster genes into categories and perform a signifi-cance analysis over them. There is a plethora of such tools, all implementing the same idea. The interested reader can refer to a relative review by Khatri and Draghici[22]for a performance com-parison. However, the gene product characterization in conjunc-tion withsemantic similaritydiscovery in a structured vocabulary of genetic concepts can also provide quantitative knowledge that can be exploited in order to produce better datasets suitable for microarray classification. Semantic similarity has been longtime used in the Information Retrieval and Natural Language Processing fields in order to measure the likeness of the semantic content of
documents or terms [23–27]. The same principle has also been
used in order to derive geospatial content maps[28].
However, in microarray supervised data mining the existing semantic approaches, which have been recently reviewed by Bellazi and Zupan[29], utilize semantic knowledge either for defining class labels[30], or for statistically defininga priorisets of gene groups (e.g. genes found in the same metabolic pathways, located in the same cytogenetic band, or sharing the same Gene Ontology cate-gory) that are used for the classification task instead of selecting individual problem-specific genes[31]. In another study by Qi and Tang[32], gene expression data were classified with a methodology, which for the feature selection task used statistical methods and the Gene Ontology in order to remove redundant features from an al-ready arbitrarily reduced initial feature set. In that study similarity tests involved the computation of a metric calledconjunctive similar-ity, which was used in order to measure gene similarities within their feature set. The metric they introduced combines statistical correlation with semantic similarity using weights. In this sense, and given that the weight they usually assigned for the semantic similarity result was small, the use of semantic similarity aimed rather at verifying the results of the statistical feature selection methods or in the best case just to support them. Their aim to use semantic similarity only as a means of verification of the statistical methods results, and not as a self-contained means of feature set enrichment, is further cleared in their follow-up paper[33], where the authors explicitly claim that they use the discriminative values of GO terms to verify the statistical discriminative values of genes. Moreover, in these studies the feature set consisted of a small frac-tion of the whole set of genes (it typically comprised about 100 genes), while the rest of them were ignored and not used at all, claiming that the remaining genes were traditionally enough to
de-scribe the classification problem, and that there were even more redundant genes in this feature set that needed to be removed.
In this paper a novel approach for microarray classification is presented that integrates semantic knowledge with legacy statisti-cal methods with the help of semantic similarity, aiming to rein-force the feature set used for classification by enriching it with new marker genes. Our approach has been implemented as a soft-ware platform called SoFoCles. The quality of microarray classifica-tion can be enhanced by exploiting the knowledge available in a structured hierarchy of genetic concepts, the Gene Ontology (GO), instead of merely applying feature selection methods. In this way, scientifically proven information with biological meaning is incorporated into the feature filtering procedure, in order to im-prove the classification accuracy. To achieve this, a repository of semantic similarity methods has been built into SoFoCles. The user may choose one or more of these methods to better identify feature similarities based on the terms of the Gene Ontology that each gene or gene product is tied to. The initial whole feature set (W -set) is first filtered using legacy statistical methods producing a re-fined small feature set (R-set). Then, the GO-based similarities are used to enrich theR-set using the SoFoCles algorithm. Information concerning genes or gene products of the refined dataset is prepro-cessed in order to identify the related GO terms and infer semanti-cally similar genes that are involved in the same biological process. These genes enrich theR-set, yielding the semantically awareS-set, which describes better the biological paths regulated in the condi-tions tested, thus improving classification accuracy.
Compared to the approach in[31]that also utilizes the Gene
Ontology, SoFoCles is able of selecting features that are problem-specific, constructing feature sets on demand and nota priori.With respect to the feature selection approaches in[32,33], SoFoCles is substantially different and innovative in terms of aim, methodol-ogy and metrics, firstly since it aims atenrichinga small initial
fea-ture set (R-set), while the other approaches aim at removing
redundant features from a larger initial feature set. In this context, SoFoCles involves the calculation ofsemanticsimilarities between two feature sets (R-set and the rest of the genes) in order to derive an enriched, semantically-aware final feature set (S-set), and not the calculation of conjunctive similarities in one single feature set. Within SoFoCles, semantic similarity is used solely as the gene discriminative method between the two feature sets for discover-ing new marker genes, instead of only verifydiscover-ing the statistical cor-relations between genes as in the other two approaches. Most importantly, a major innovation of SoFoCles is that it uses and semantically comparesallgenes of the initial feature set (W-set) and not only a small fraction of them (as in[32,33]), implying that prior knowledge (in the form of semantic similarities in the Gene Ontology) can be used in order to enrich theR-set with features that would not be normally included in the feature set if the tradi-tional statistical techniques were used. Thus, using SoFoCles, the discovered genes could be found anywhere in the initial feature space, even between the large multitude of genes that are arbi-trarily discarded by the other two methodologies.
The rest of the paper is organized as follows. In Section2the Gene Ontology aspects are presented and reliability issues in GO
annotations are discussed. Section 3 covers the discovery of
semantic similarity in the Gene Ontology using the different meth-ods implemented within SoFoCles. Section4describes our method-ology for semantic feature selection, while Section5presents the structure and functionality of the SoFoCles platform. Several exper-iments in microarray classification have been conducted with
SoF-oCles. Some of them are described in Section 6 together with
representative results indicating the improvement in terms of clas-sification accuracy, along with the relevant discussion regarding the added value of SoFoCles. Finally, Section7concludes and pre-sents the future outlooks of SoFoCles.
2. GO aspects and annotation evidence codes
Gene Ontology constitutes a controlled and structured vocabu-lary, which supports querying in different layers. Curators, who annotate its terms to genes or gene products, are allowed to select the term of a layer that corresponds to the existing knowledge for a gene or a gene product. GO has three different aspects/ontologies that contain information regarding all species: (a) biological pro-cess, (b) molecular function, and (c) cellular component. The main characteristic of these ontologies is that they are orthogonal to each other; each term exists only within one of the three aspects, thus guaranteeing the uniqueness of a feature annotated to a gene. The biological process (BP) aspect comprises one or more function stages; nevertheless it cannot describe full biological paths. The molecular function (MF) aspect describes the biochemical activity of a gene product without defining the location or the timing of the activity, thus describing activities rather than gene products. The cellular component (CC) aspect describes locations within the cell, where gene products are active. Therefore, MF and CC as-pects answer the question ‘‘what a gene product does and where it is active inside a cell”, while the BP aspect explains the biological effect of a gene product[34].Fig. 1depicts an instance of the bio-logical process aspect.
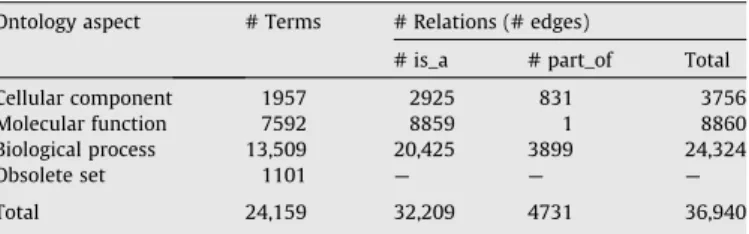
GO supports two types of relations, the ‘‘is_a” and the ‘‘part_of” relation. In general ‘‘is_a” relations are not interconnected with ‘‘part_of” relations in order to avoid abstractness[35].Table 1 de-picts the terms and relations distributions in Gene Ontology.
GO terms are annotated to gene products through the GOA pro-ject. Gene annotation follows two principles: (a) the source of the annotation should be mentioned, and (b) the type of evidence that supports the annotation must be provided. In general, annotations apply to gene products and not to genes themselves, since a gene may encode the formation of many different products with distinct properties.
The reliability of a GO annotation is directly dependent on the type of evidence that supports it. In general, electronic and manual evidence is available within the Gene Ontology terms and gene products. Manual evidence is based on published information, either in scientific bibliography, experiments, or biological knowl-edge, always with respect to the trustworthiness level of the GO curator. Therefore, a certain level of subjectivity cannot be avoided. Automated processes, on the other hand, exploit corresponding
corrin catabolic process GO:0046141 is _ a is_a is _ a is _ a is_a
cofactor catabolic process
GO:0051187 corrin metabolic processGO:0015009
tetrapyrrole catabolic process GO:0033015
cofactor metabolic process GO:0051186
tetrapyrrole metabolic process GO:0033013
is_a is_
a
cellular catabolic process
GO:0044248 heterocycle metabolic processGO:0046483
catabolic process GO:0009056
cellular metabolic process GO:0044237 metabolic process GO:0008152 cellular process GO:0009987 biological process GO:0008150 is_a is _ a is _ a is _ a is_a is_a is _ a is_a is _ a is_a is_a
Fig. 1.An instance of the biological process aspect of Gene Ontology in the form of a Directed Acyclic Graph. It can be observed that there are nodes having more than one parent. The root of the ontology aspect is the term: GO:0008150, biological_process.
Table 1
Distribution of GO terms and relations in the ontology (The Gene Ontology, May 2007 release).
Ontology aspect # Terms # Relations (# edges)
# is_a # part_of Total
Cellular component 1957 2925 831 3756
Molecular function 7592 8859 1 8860
Biological process 13,509 20,425 3899 24,324
Obsolete set 1101 — — —
data and cross-references from other databases. These annotations are usually products of bioinformatics methods, like sequence alignments or scientific text mining. Such methods prove much faster and consistent, compared to supervised methods, since they rely on solid rules; nevertheless, they lack credibility compared to manual annotations, since automated methods tend to reproduce human errors that occur during the recording procedure in biolog-ical databases[36], and also because they tend to transfer annota-tion that is correct for one gene onto a gene where it is inappropriate.
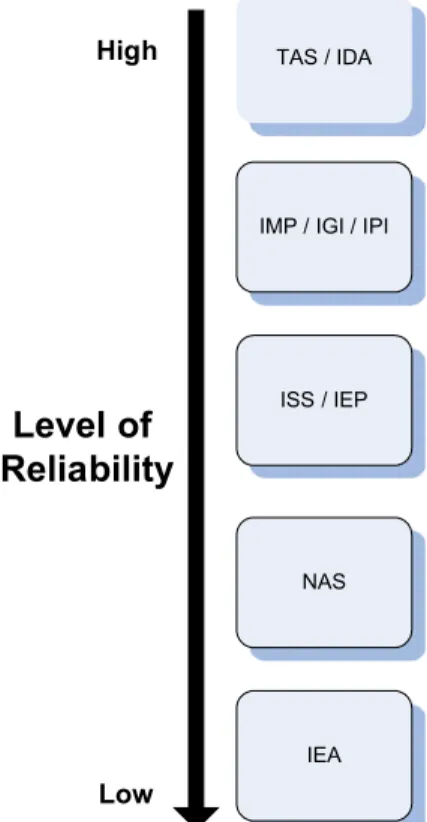
In Gene Ontology there exist 14 different evidence codes that represent different types of evidence, though only one of them is a completely automatic approach (IEA: Inferred from Electronic Annotation). The rest of them, including some electronic methods, require the results to be reviewed manually by a curator. Specifi-cally, these methods are: IC (Inferred by Curator), IDA (Inferred from Direct Assay), IEP (Inferred from Expression Pattern), IGC (In-ferred from Genomic Context), IGI (In(In-ferred from Genetic Interac-tion), IMP (Inferred from Mutant Phenotype), IPI (Inferred from Physical Interaction), ISS (Inferred from Sequence or Structural Similarity), NAS (Non-traceable Author Statement), ND (No biolog-ical Data available), RCA (inferred from Reviewed Computational Analysis), TAS (Traceable Author Statement) and NR (Not Re-corded).Fig. 2depicts a ranking of the evidence codes with respect to their reliability.
3. Semantic similarity in Gene Ontology
A major innovation of SoFoCles is the exploitation of existing biological knowledge for the microarray classification task. This can be realized by drawing knowledge from the Gene Ontology. It is of great importance, though, to employ a mechanism for
knowledge quantification in order to allow the application of con-cepts such as correlation and similarity between GO terms.
Quantifying such information is enabled via the concept of semantic similarity, by which the integration of ontology’s struc-tured information becomes plausible. By definition, semantic sim-ilarity is a concept whereby a set of documents or terms within term lists are assigned a metric based on the likeness of their meaning/semantic content. In general, the terms that are labeled as ontology nodes are placed farther apart in the ontology graph, as their semantic similarity decreases.
Apart from the obvious metric of the distance between two ontology nodes, i.e. the number of edges of the minimum path that connects the nodes, there are also other quantification metrics. A well-established metric that is hereby used in semantic similarity techniques is the concept of information content of an ontology node.
The concept of information content in biological terms depicts an index of generality of a biological term. Specifically, the Gene Ontology comprises a structured vocabulary with hierarchical rela-tions among its terms. Some are more generic, whereas others are more specific. Intuitively, the deepest layers of the ontology con-tain the more specific terms. An obvious metric to measure the relation between two nodes or a node’s generality is the measure-ment of the distance among the nodes or between a node and the graph’s root. Although the conceptual approach of such a method-ology is quite simple, it features the important disadvantage of ignoring the local density in each node, thus failing in non-uniform density graphs or trees. Moreover, the fact that some ontology branches are longer than others is not taken into account, thus nor-malization is needed. For example, the GO terms GO:0008218 ‘‘ bio-luminescence” (depth 3) and GO:0045994 ‘‘positive regulation of translational initiation by iron” (depth 8) are both ontology leafs. Leafs in this example describe a certain whole biological process in the specific time. Thus, these two terms should include the same information content[37].
The information contentICof a termtis defined by Eq.(1):
ICðtÞ ¼ logðpðtÞÞ ¼ log nt
nr
ð1Þ where:
pðtÞ: probability oft,
nt: the frequency of the term or any of its descendants, nr: the frequency of the root or any of its descendants.
Normalizing the quantity in Eq.(1), it is possible to acquire the information gain of a leaf. Ontology leaves are considered to de-scribe in full a certain process, by also incorporating the maximum information content. The probability of such a leaf, would be: pðleafÞ ¼1
nr
ð2Þ while its information content would be:
ICðleafÞ ¼ logðpðleafÞÞ ¼ log 1
nr
ð3Þ Thus, the information content of a termtcould be normalized by dividing with the information content of an ontology leaf:
ICnormalðtÞ ¼ logðpðtÞÞ logðpðleafÞÞ¼ log nt nr log 1 nr ¼1logðntÞ logðnrÞ ð4Þ
The above quantity takes values in [0, 1] and it is minimized when the term is the ontology root, whereas it takes its maximum value of 1 when the term is a leaf.
TAS / IDA
IMP / IGI / IPI
ISS / IEP NAS IEA
High
Low
Level of
Reliability
Fig. 2.Reliability index of GO evidence codes. In general, TAS and IDA evidence codes are considered more reliable, since they are inferred from publications. IEA is the least reliable code, being inferred by automatic sequence alignments that are not validated by curators.
A term in higher levels of the ontology is considered to refer to a gene product, even if any descendant of the specific term is as-signed to this gene product. Given the above, the position of a term within the ontology is directly related to the number of annota-tions of this term to gene products. In general, more generic terms occur in higher layers of the ontology. However, this in not always the case; inTable 2it can be observed that, for some terms that lie deeper in the ontology, there may be others above them that are more generic having lower information content. Normalization at-tempts to override these disadvantages, however the disambigua-tion of the ontology leafs sense is the key to improve the descriptive capability of the ontology.
The convention to equally assign a gene product to the ascen-dants of a term is based on thetrue path rule, which is valid in Gene Ontology, and stipulates that if the child term describes the gene product then all its parent terms must also apply to that gene prod-uct. For example, the term ‘‘alkali metal ion binding” can be consid-ered as ‘‘metal ion binding” (one of its direct parents) or also as ‘‘ion binding” (one of its ancestors). Thus, a term reserves all of its ances-tors’ features and it can be regarded as any one of them.
In this context, the employed semantic similarity methods are able to compute pairwise similarities between GO terms. The var-ious approaches involve either the use of edges or the use of nodes of the ontology, or even a combination of both. In general, a node-based approach takes into account the information lying inside ontology nodes, by measuring how common the information that lies inside an ontology node is with that of another node.
The edge-based methods rely on the measurement of distance (edge length) between the nodes considered. Both approaches aim at computing semantic similarity, but from different aspects. The edge-based approach lies closer to human intuition, while the node-based approach is theoretically more robust[38].
In terms of SoFoCles, the following semantic similarity methods were employed:
(a) Resnik[39]:
This is the simplest node-based technique. It utilizes the mini-mal subsumer of two terms, defined as the common ancestor
con-cept between t1 and t2 that has the minimal number of
descendants, in order to derive the similarity measure between termst1andt2:
R-simnormðt1;t2Þ ¼
maxt2Sðt1;t2Þ½ICðtÞ
ICðleafÞ ð5Þ
whereSðt1;t2Þis the set of common ancestors oft1andt2.
(b) Lin[40]:
Lin’s method is another node-based technique that also consid-ers the information content of the terms in order to derive their similarity:
L-simnormðt1;t2Þ ¼
2maxt2Sðt1;t2Þ½ICðtÞ ICðt1Þ þICðt2Þ
ð6Þ
(c) Jiang and Conrath[38]:
A method that combines node-based and edge-based ap-proaches, by also considering network densities, node depth and types of connection along with the information content of the termst1andt2and their minimal subsumer. The similarity
mea-sure is given by: JC-simnormðt1;t2Þ
¼1ICðt1Þ þICðt2Þ 2ICðmin subsumerðt1;t2ÞÞ
2logðnrÞ
ð7Þ
(d) Cao[41]:
A node-based method by which the similarity between two termst1andt2is computed as the sum of the information content
of all their common ancestors versus the sum of the information content for all the ancestors of each node:
C-simnormðt1;t2Þ ¼ P t2Sðt1;t2ÞICðtÞ P t2Sðt1;t2ÞICðtÞ þ P t0RSðt1;t2ÞICðtÞ ð8Þ where tRSðt1;t2Þ is considered equivalent to t2 ððSðt1Þ [Sðt2ÞÞ
Sðt1;t2ÞÞ.
(e) OldZZL[42]:
An edge-based method that computes the maximum common path among the longest paths from each termt1,t2to the root:
OZZL-simnormðt1;t2Þ ¼1 1 2lcommon 1 2l1þ1 1 2l2þ1 ð9Þ where:
l1¼max½lengthðpathsðt1ÞÞ; l2¼max½lengthðpathsðt2ÞÞ;
lcommon¼max½lengthðT1\T2Þ; T12maxpathsðt1Þ
andT22maxpathsðt2Þ;
pathsðt1Þ: the set of paths fromt1to the root, pathsðt2Þ: the set of paths fromt2to the root,
maxpathsðt1Þ#pathsðt1Þandlengthðmaxpathsðt1ÞÞ ¼l1,
maxpathsðt2Þ#pathsðt2Þandlengthðmaxpathsðt2ÞÞ ¼l2,
lcommon: the maximum sub-path that is common between some
path of t1 maximum paths (maxpathsðt1Þ) and some path of t2
maximum paths (maxpathsðt2Þ).
(f) ZZL[43]:
An improvement of the oldZZL method by which the similarity between two termst1andt2takes into consideration the common
path from the terms’ minimal subsumermsto the root:
ZZL-simnormðt1;t2Þ ¼1 1 2lms 1 2l1þ1 1 2l2þ1 ð10Þ Table 2
Some GO terms of the Biological Process Ontology in increasing order of their information content. It can be observed that the information content of a term is mostly dependent on its density rather than its depth in the ontology (The Gene Ontology, May 2007 release).
Term Information
content
Depth
id Name
GO:0008150 Biological_process 0.000 0
GO:0009987 Cellular process 0.042 1
GO:0008152 Metabolic process 0.099 1
GO:0044237 Cellular metabolic process 0.105 2 GO:0044238 Primary metabolic process 0.128 2 GO:0032502 Developmental process 0.143 1 GO:0007275 Multicellular organismal development 0.177 2 GO:0044248 Cellular catabolic process 0.285 3
GO:0015979 Photosynthesis 0.623 2
GO:0040011 Locomotion 0.700 1
where in this case:
l1¼max½lengthðpaths0ðt1ÞÞ; l2¼max½lengthðpaths
0 ðt2ÞÞ; lms¼lengthðpathðmsÞÞ;
paths0ðt1Þ ¼pathsðt1;msÞ [pathðmsÞ; paths0ðt2Þ ¼pathsðt2;msÞ [pathðmsÞ; lengthðpathðmsÞÞ ¼max½lengthðpaths0ðt1ÞÞ
max½lengthðpathsðt1;msÞÞ
¼max½lengthðpaths0ðt2ÞÞ
max½lengthðpathsðt2;msÞÞ:
(g) Leacock and Chodorow[44]:
An edge-based method that considers the length of the mini-mum path between two terms and the maximini-mum depth of the ontology. The similarity measure is:
LC-simnormðt1;t2Þ
¼
1; lengthðminpathðt1;t2ÞÞ ¼0 loglengthðminpathðt1;t2ÞÞþ0:1
2D
log1 2D
; lengthðminpathðt1;t2ÞÞ–0 8
<
: ð11Þ
where
minpathðt1;t2Þ: the minimum path betweent1andt2,
D: the maximum depth of the ontology, i.e. the length from the far-thest leaf to the root.
(h) Wu and Palmer[45]:
Semantic similarity is computed as follows: WP-simðt1;t2Þ ¼
2N3 N1þN2þ2N3
ð12Þ where:
N1¼lengthðminpathðt1;msÞÞ; N2¼lengthðminpathðt2;msÞÞ; N3¼lengthðmaxpathðms;rootÞÞ;
andmsis the minimal subsumer.
Finally, SoFoCles also implements the GraSM [46]versions of
Resnik, Lin and Jiang–Conrath techniques, using the common dis-junctive ancestors instead of the minimal subsumer.
4. Feature filtering using GO semantic similarities 4.1. The SoFoCles algorithm
Using the semantic similarity measure it is now possible to de-fine an algorithm that can combine classic feature selecting tech-niques and the biological knowledge from the Gene Ontology in order to derive new feature sets that can better describe the micro-array dataset. A flowchart of the SoFoCles algorithm, which com-prises five steps, is depicted inFig. 3.
InStep 1genes are ranked with respect to their discriminative ability, by the use of legacy feature selection algorithms, such as chi-square, information gain, or relief-F. In this stage, genes with the most informative values with respect to the specified classifica-tion problem qualify. Specifically, when applying the informaclassifica-tion gain method, the measured metric by which the genes are ranked
Training Data (W-set) Mappings of genes to gene symbols, IDs, synonyms
Step 2: Finding gene symbols Step 1: Ranking Genes
gene symbols of R-set and W-set Top-ranked genes (R-set)
Step 3: Evaluating semantic similarity between R-set and
W-set –R-set
semantic similarity
matrix
Conclusions Step 4: Adding the top
semantically similar
features to R-set S-set
Step 5: Comparison of the classification results
between the three datasets GO file
GOA files
is a correlation metric, whereas in the cases of relief-F and chi-square techniques the genes are ranked according to a distance metric. Correlation metrics in feature filtering measure an attri-bute’s ability to correctly predict the value of a class. In particular, the information gain method tries to measure the reduction achieved in the entropy value of a class given that the value of one feature is known. Respectively, distance metrics measure an attribute’s ability to discriminate among different classes. To this end, the chi-square method uses recursively the chi-square statis-tic, while relief-F tries to find a good estimate of the probability RF(t)to assign as the measure for each featuret. In the interest of brevity,Table 3presents the metrics used for ranking a geneti
given the problem classesciwhen using each one of these
com-monly known methods, without their mathematical justification. In this step of the SoFoCles algorithm, values are calculated across all instances of the dataset in order to produce a ranking. The output is a new feature subset (R-set) that contains the most informative genes, which are also known asmarker genes.
InStep 2of the algorithm, the gene symbols, identities, names or synonyms of the feature set genes are identified through map-pings that transform the feature set genes to either of the above mentioned categories. In most microarray datasets, features are named after an inner microarray nomenclature system (e.g. the Affymetrix nomenclature). Thus, a preprocessing stage is required in order to translate the features to name categories that are recog-nizable forms by the Gene Ontology Annotation databases.
Step 3of the algorithm covers the tasks of relating GO terms to genes and selecting the participating evidence codes as well as the aspects of the Gene Ontology that are to be used. The previously mentioned GOA system is used in order to discover the GO terms that are related to the feature set genes, by also setting the ac-cepted evidence codes that must support the terms, as well as the desirable aspects.
After mapping each gene of theW-set to related GO terms, the algorithm computes semantic similarities in Gene Ontology be-tween every pair of the two induced feature groups; (a) the refined group (R-set), that comprises the highly ranked genes, and (b) the rest of the genes (W-set –R-set) that have been temporarily dis-carded in Step 1 of the algorithm. Since a single gene may be rep-resented by several GO terms in Gene Ontology, the semantic similarity between two genes that are represented by a series of GO terms has to be defined. This algorithm is described in Section 4.2.
Step 4involves the semantic similarity based feature selection procedure. The temporarily discarded genes (W-set –R-set) are compared against each gene of theR-set. The genes that exhibit the highest similarity are selected to enrich theR-set, thus creating
the semantically aware S-set. Eventually, S-set contains both
genes/features filtered with classic feature selection methods as well as others that are semantically related to the former. The selection procedure is based on a two-level thresholding phase. In the first level, the top semantically relevant genes for each gene of theR-set qualify, creating a subset of candidate genes. In the sec-ond level, this subset is ranked and the top genes are finally se-lected to enrich theR-set. In this way, knowledge emerging from both the statistical similarity inside the dataset, and the semantic
similarity from Gene Ontology is combined in order to produce the problem-specific, semantically aware dataset (S-set).
As a final step (Step 5), classification techniques are applied on the dataset, in order to validate the methodology. Various classifier models are trained and their parameters are estimated using the different feature sets induced in the previous steps. Different mod-els are built using theW-set, theR-set and theS-set. The classifica-tion accuracy is then measured using the leave-one-out cross-validation technique in order to compare the models.
4.2. Semantic similarity at gene level
As mentioned above, in Step 3 of the SoFoCles algorithm we need to calculate the semantic similarity between two genes or gene products that may be represented by a series of GO terms.
Suppose that geneAis related withNAGO terms and geneBis
related withNBGO terms. First, semantic similarities between all
possible pairs of GO terms that are related with genes A and B
are computed (sum ofNANBcombinations). Then a semantic
sim-ilarity matrix (SSM) with dimensionsNANBis created, whose
ele-mentsssi,jare the computed pairwise semantic similarities:
SSM¼ ss1;1 ss1;2 ss1;3 . . . ss1;NB .. . .. . .. . . . . .. . ssNA;1 ssNA;2 ssNA;3 . . . ssNA;NB 2 6 6 4 3 7 7 5 9 > > = > > ; |fflfflfflfflfflfflfflfflfflfflfflfflfflfflfflfflfflfflfflfflfflfflfflfflfflfflfflfflfflfflfflfflfflfflfflfflffl{zfflfflfflfflfflfflfflfflfflfflfflfflfflfflfflfflfflfflfflfflfflfflfflfflfflfflfflfflfflfflfflfflfflfflfflfflffl} gene B gene A ð13Þ
The semantic similarity between the two genes can then be com-puted in three different ways.
MAX:The MAX approach involves the computation of the
max-imum similarity between any GO terms that are related to the genes. Formally, the semantic similarity between two genes using the MAX approach can be calculated as:
SSGMAX¼max
i;j fssi;jg; ði;jÞ 2 fNANBg ð14Þ
Though, since a gene product usually encompasses all roles that its annotated GO terms describe, semantic similarity can be computed with respect to all annotated GO terms using the AVG process.
AVG:By this approach, semantic similarity is computed by find-ing the average similarity between any GO terms that refer to
the genes [35]. Formally, semantic similarity between two
genes with the AVG approach can be calculated as: SSGAVG¼ PNA i¼1 PNB j¼1ssi;j NANB ð15Þ
AVG_MAX:Finally, another way of computing semantic similar-ity between two genes that combines the MAX and AVG approaches is AVG_MAX. For each GO term that relates to a gene, its maximum similarity with respect to all terms of the other gene is calculated, a process that is repeated for both genes. As a result, two matrices 1NAand 1NBare formed,
containing the similarities of gene A with respect to gene B, and the similarities of geneBwith respect to geneA, respec-tively [46]. We denote as simðA;BÞthe matrix that contains the similarities of gene A with respect to gene B, while the matrix containing the similarities of geneBwith respect to gene Ais denoted assimðB;AÞ.
The two matrices can be rewritten as: simðA;BÞ ¼ j2f1max;2;...;NBg fss1;jg max j2f1;2;...;NBg fss2;jg max j2f1;2;...;NBg fssNA;jg h i ð16Þ Table 3
Legacy feature filtering measures.
Description Formula Information gain IGðtk;ciÞ ¼Pc2fci;cig P t2ftk;tkgPðt;cÞlog2 Pðt;cÞ PðtÞPðcÞ Chi-square CHIðt k;ciÞ ¼N½Pðtk;ciÞPð tk;ciÞPðtk;ciÞPðtk;ciÞ2 PðtkÞPðtkÞPðciÞPðciÞ
Relief-F RFðtÞ ¼Pðdifferent value oftjdifferent classÞ Pðdifferent value oftjsame classÞ
simðB;AÞ ¼ i2f1max;2;...;NAg fssi;1g max i2f1;2;...;NAg fssi;2g max i2f1;2;...;NAg fssi;NBg h i ð17Þ Finally, average similarities of geneAwith respect to geneBand
geneBwith respect to geneAare computed:
simðA;BÞ ¼ PNA i¼1maxj2f1;2;:::;NBgfssi;jg NA ð18Þ simðB;AÞ ¼ PNB j¼1maxi2f1;2;:::;NAgfssi;jg NB ð19Þ The semantic similarity between the two genes according to the AVG_MAX approach can now be computed as the mean of the above average similarities:
SSGAVG MAX¼
simðA;BÞ þsimðB;AÞ
2 ð20Þ
5. The SoFoCles platform
SoFoCles has been implemented as a Java platform that com-prises four modules: (a) the user interface, (b) the data preprocess-ing module, (c) the semantic similarity unit and (d) the new feature set derivation subsystem.Fig. 4depicts the general architecture of the platform and its environment.
The software uses and produces datafiles that are compatible
with the WEKA data mining suite[47]. WEKA was selected as a
data mining tool, because it provides a large variety of feature fil-tering and data mining algorithms, and its open source code facil-itates its interconnection with SoFoCles.
Implementing Step 1 of the algorithm, WEKA is used to derive an initially filtered dataset (R-set) from the original dataset (W -set). Then, through the user interface a researcher can upload the two datasets to SoFoCles, as well as any version of the Gene Ontology.
The same module is also used for setting the initial parameters for the two processes of data preprocessing (Step 2) and the dis-covery of semantic similarities (Step 3).
Microarray attribute names are transformed to gene symbols using the proper datafiles provided by the microarray manufac-turer (e.g. Affymetrix). With respect to semantic similarity mea-surement, SoFoCles supports the setup of different experiments by exploiting the Gene Ontology in different ways. To this end, one or more aspects of the Gene Ontology and any subset of the evidence codes for GO annotations can be included for the seman-tic similarity computation task. Finally, a semanseman-tic similarity method can be selected from the SoFoCles repository along with its parameters (thresholds and gene-level semantic similarity method).
In the data preprocessing unit, gene symbols that corre-spond to the datasets are identified using the mapping files. The semantic similarity module then assumes the task of find-ing semantic similarities between all pairs of genes from the R-set and the (W-set –R-set) (Step 4). To accomplish this, a repository of semantic similarity methods has been developed, which contains the online collection of algorithms described in Section 3.
The outcome is the similarity matrix, as defined in Eq. (13),
which is used by the feature set derivation module to detect the most semantically similar genes, and then construct theS-sets. The classification experiments are then performed in Step 5.
From a functional point of view, SoFoCles offers various ser-vices, which are briefly described below:
– Data entry. SoFoCles can receive input from multiple data sources, such as microarray datafiles in WEKA format, gene
mapping files from the R package[48], Gene Ontology
Annota-tion Files and the Gene Ontology itself. Furthermore, data can also be entered in a simple text format, thus avoiding the use of external packages.
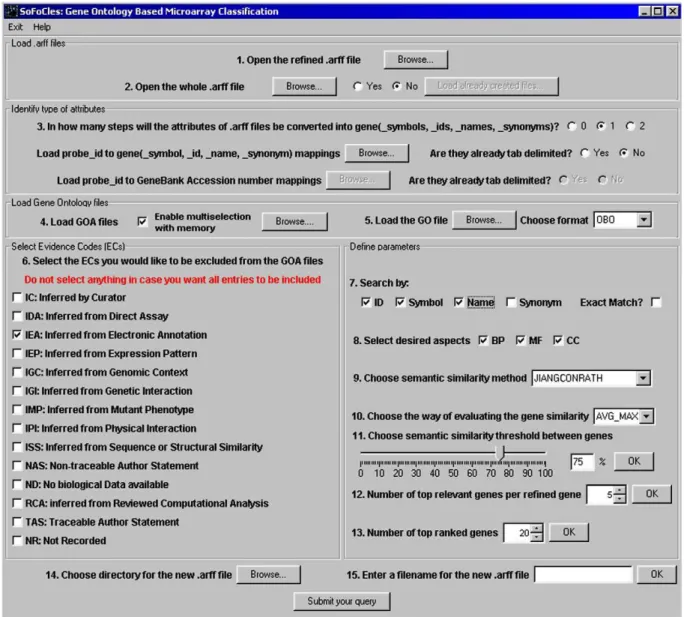
– Parameter setting environment. SoFoCles enables experimenting with different scenarios by providing a flexible parameter set-ting environment. The user can select the evidence codes that will participate in the process of GO term identification for each gene and narrow the search within specific Gene Ontology terms, by selecting the search fields to be used. Such fields can be a gene’s identity, symbol, name or synonym. Furthermore,
Data Preprocessing Semantic Similarity
Feature Set Derivation
User Interface
Semantic Similarity Methods
Repository
SoFoCles
Parameter Setting Environment Similarity Matrix Mapping of Attributes to Genes Evaluation of Semantic Similarity
WEKA The Gene Ontology
Evidence Code / Aspect Filtering Construction of New Dataset
R-Set W-Set GOA
Files S-Set
GO File
the user can choose between an exact or partial match and exclude ontology aspects that are not considered important for the classification problem. A similarity threshold can be set, above which the semantically similar to theR-set genes qualify. Finally, the number of the derived genes can also be set manu-ally.Fig. 5depicts the data entry and parameter setting interface of SoFoCles.
– Dataflow information. While experimenting with SoFoCles, the user is directed with proper messages in order to form complete and sound queries.
– Dataset production. SoFoCles is able to output datasets suitable for processing with the WEKA environment that contain both statistically and semantically derived features. These datasets can be validated using various classification techniques.
6. Experiments 6.1. Experimental process
The SoFoCles platform was evaluated using two cases of micro-array data. In both cases the general notion of the conducted
experiments was to compare classification accuracy in each of the three resulting datasets: (a) the whole datasetW-set, (b) the refined datasetR-set (obtained by legacy feature selection tech-niques) and (c) the enriched datasetS-set generated by SoFoCles.
The main goal was the increase of classification accuracy. Apart from that, the improvement of other measures for the evaluation of the results such as TP rate, FP rate, precision and F-Measure, which refer more to each class label separately, were also considered.
The Support Vector Machines (SVM) algorithm[47]was used
for classification in the last step of the process. SVM is computa-tionally efficient, robust in high dimensions, which is the case in microarray problems, and it is based on sound theoretical founda-tions. Furthermore, no strong hypothesis is needed on the data generation process and the objects are classified with large confi-dence thus avoiding overfitting. In order to empower this decision, preliminary tests were conducted using the legacy feature selec-tion algorithms, in which SVM outperformed other classificaselec-tion algorithms such as decision tables, rule learning algorithms (JRip and PART), decision trees (J48), instance based methods (IBk, K*), neural networks (Perceptron), Bayesian and radial basis function networks. The datasets were evaluated using leave-one-out cross-validation.
The two gene expression datasets that were used in our evalu-ation experiments are described in Section6.2. The first dataset,DS,
contains information on the effects of cigarette smoke on the hu-man epithelial cell transcriptome and the other,DCNV, examines
the central nervous system embryonal tumor outcome based on gene expression.
The GO release of May 2007 was used and searching was lim-ited to the criteria of ID, symbol and synonym partial matching. Only GO terms from the BP aspect were taken into consideration excluding those supported by the IEA evidence code as this type of annotation is not validated by a curator.
For annotation purposes, three GOA files were used: (a) Human (gene_association.goa_human),
(b) Rat (gene_association.rat) and (c) Mouse (gene_association.mgi).
The decision to use the last two files was taken because these two organisms are highly similar to Human.
In addition, the minimum semantic similarity threshold was set to 50%, while five was selected as the maximum number of top semantically similar genes for each gene of theR-set and the max-imum number of finally chosen genes among the top semantically similar ones was set to 50% of the number of features of theR-set, i.e. 20 genes for theDSdataset and 10 genes for theDCNVdataset.
Lastly, five semantic similarity methods (Resnik, Lin, Jiang&Con-rath, Cao, oldZZL) and three ways of evaluating the semantic sim-ilarity between genes (AVG, MAX, AVG_MAX) were used for the experimentation, thus leading to the creation of 53 = 15 sets of results.
After presenting the parameters used, a short discussion on the nature of the tested data is essential. First, the classification accu-racy of the whole dataset (W-set) was estimated as a reference va-lue for the comparison of the other datasets’ performance.
Furthermore, a refined set (R-set) was created fromW-set after the application of a legacy feature selection method. In order to
achieve fair comparison, when creating the R-set preliminary
experiments were conducted and the threshold for which the leg-acy methods yielded the optimal results was selected. Based on thisR-set, 15 newS-sets were produced by SoFoCles using different semantic similarity techniques. TheS-sets were enriched with a number of genes with respect to theR-set. Thus, for a more com-plete attempt of evaluating the strength of SoFoCles, a newR-set, comprised of as much features as theS-sets had in average, was created using the legacy feature selection algorithm. For complete-ness purposes, two additionalR-sets were also created; one con-taining only randomly extracted features out of the initialW-set and another containing the features of the initialR-set plus some
randomly extracted features from theW-set. The number of the
randomly extracted features was selected so that theseR-sets have the same number of features as the average number of features of theS-sets.
6.2. Experimental data
6.2.1. DSdataset
This dataset was a collection of 74 samples profiling the gene expression of the human airway epithelial cells across a broad spectrum of individuals in order to discover the reversible and irre-versible effects of cigarette smoking[49]. These profiles were ob-tained by hybridization on the Affymetrix HG-U133A Genechip containing probes for 22,215 genes. Thus, the dataset comprises 22,215 features plus one class divided into three labels: current-smoker, never-smoked and former-smoker. Out of the 74 samples 33 belong to the ‘‘current-smoker” label, 23 to the ‘‘never-smoked” label and the remaining to the ‘‘former-smoker” label.
The features which represent GenBank accession numbers were transformed into gene symbols by appropriate mappings in order to be processed by the GOA files.
Relief-F was used as the feature selection method for the cre-ation of theR-set from theW-set. In more detail, the top 40 fea-tures, as selected by the relief-F algorithm, were isolated and produced theR-set. Based on these 40 features their top seman-tically similar genes were mined according to one of the semantic
similarity methods implemented in SoFoCles and theS-sets were
produced. 6.2.2. DCNVdataset
The second group of data was a set of 60 samples examining the mechanism of central nervous system embryonal tumor based on
gene expression[50]. The RNA amounts were hybridized to
HuGe-neFL arrays which, in turn, were scanned on Affymetrix scanners. Finally, the expression values for each gene were calculated using Genechip software. The dataset comprises 7129 genes plus one binary class. Out of the 60 samples 39 belong to ‘‘medulloblastoma survivors” and 21 to ‘‘treatment failures”.
The features which represent probe IDs were transformed into gene symbols by appropriate mappings in order to be processed by the GOA files. The feature selection method that was used was the Information Gain. More specifically, the top 20 features coming out of the Information Gain algorithm constituted theR -set.
6.3. Results
6.3.1. DSdataset
Accuracies for the performed classification experiments are de-picted inFig. 6. The bar chart is based onTable I (Supplementary information).
As it can be observed in the chart the twoR-sets (those with 40 and 74 features) outperform theW-set roughly by 14%. This can be justified by the fact that many of the genes, which are described in [49]as cancer-related, are found in theR-sets. More explicitly, the R-sets include genes that code for xenobiotic functions, such as the anti-oxidants GPX2 and ALDH3A1, several putative tumor suppres-sor genes, such as SLIT1, SLIT2 and TU3A, the oncogene pirin (PIR), a transcription factor involved in the induction of oxygen regulated genes (EPAS), as well as the genes CLDN10, MMP10, LOC92689, ME1 and MT1F, which were also considered in the analysis in[49]. As expected, the sets with randomly selected genes yielded poorer results than the ones refined with legacy feature selection methods.
Fig. 7 depicts the percentile accuracy improvement of each
method and gene semantic similarity approach with respect to theR-set for theDSdataset. Out of the 15 sets produced by
SoFo-Cles, all five that used the AVG metric for evaluating semantic sim-ilarity exhibited invariably worse performance. Thus, it can be inferred that this method produced no new knowledge and it was not suitable for the specific dataset.
Of the remaining 10S-sets, six outperformed theR-set (of 40 attributes). In short, the combinations of Jiang&Conrath and Old-ZZL with MAX or AVG_MAX and the pairs Resnik/MAX and Cao/ AVG_MAX produced better results.
Thus, Jiang&Conrath and oldZZL semantic methods seem to per-form adequately for this specific dataset and derive the necessary information, particularly when MAX is chosen as the method for evaluating semantic similarity.
It must be noted that among the genes of the aboveS-sets that have semantically enriched theR-sets, there can be found genes that are believed to contribute to cancer development according to[49]. For instance, CX3CL1, a potential tumor suppressor gene, which is absent in theR-sets, is found in the Cao.AVG_MAX,
Jiang-Conrath.AVG_MAX and oldZZL.AVG_MAX sets. Moreover, the pres-ence of tumor suppressor SLIT1 gene is reinforced in the Res-nik.MAX set. Thus, if the legacy feature selection algorithms were solely used, the inclusion of the above genes into the feature set would also require the inclusion of more irrelevant genes, thus decreasing the classification accuracy. Specifically, the inclusion of the above genes using the legacy method would require the use of 13,547 attributes in total, resulting to a classification accu-racy of 77.027%, a very low rate compared to the 85.14% of SoFo-Cles. The SoFoCles methodology can override this drawback using the semantic similarity notion.
6.3.2. DCNVdataset
Classification accuracy measurements for the experiments with the DCNVdataset are given inFig. 8. The bar chart is based on the
Table II (Supplementary information).
In this dataset, theR-sets (except the totally random one) ex-ceed the classification accuracy of theW-set by as much as 13%. One profound reason is that discriminatory genes, as described in [50], are included in theR-sets. More specifically, the aforemen-tioned sets contain features that, according to the analysis in [50], are responsible for either the expression of Class1 (tumors with high ribosomal content), Class0 (tumors with low ribosomal
D
S 0 5 10 15 20 25 30 35 40 45 50 55 60 65 70 75 80 85 90 95 100 whol e refined (40 feat ures) refined (74 features) refin ed (4 0 feature s + 34 rand om ) refin ed (74 rando m) Res nik. AVG Lin.AVG JiangConr ath. AVG Cao.AV G oldZ ZL. AVG Res nik.M AX Lin. MAX Jiang Con rath.MAXCao.MAX oldZ ZL. MA X Resnik.A VG_MAX Lin. AV G_M AX JiangConrat h.AVG_MAX Cao. AVG _MAX oldZ ZL.AVG _M AX Overall AccuracySoFoCles datasets
W -set
R -sets
Fig. 6.Classification accuracy for theDSdataset. Accuracies were measured for the whole dataset (W-set), four different datasets refined with legacy statistical methods (R
-sets), and the SoFoCles datasets (S-sets) that are semantically enhanced using five semantic similarity methods and three different approaches for computing semantic similarity between genes.
-8 -6 -4 -2 0 2 4 6 8 10
Resnik Lin JiangConrath Cao oldZZL
AVG MAX AVG_MAX
content) or both. Such genes are the markers of survival in the study GPS2, AMT, ACADVL, AP3B2 (Beta-NAP), KIAA0220, NHLH1, and C5orf18 (human polyposis locus).
Besides, theR-set with mixed filtered and random features per-forms similarly with the other twoR-sets, although the one with all of its features being random normally gave bad results.
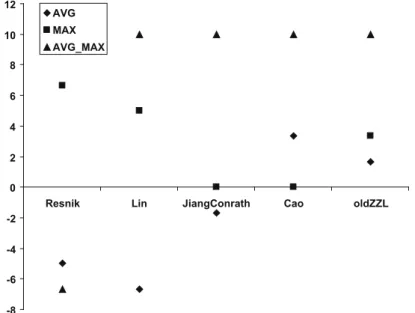
Fig. 9 depicts the percentile accuracy improvement of each
method and gene semantic similarity approach with respect to theR-set for theDCNVdataset. For this experiment nine out of the
15S-sets outperformed theR-sets and two others showed similar results. It seems that the biological knowledge entered by the tool really helps in deciphering useful information fromW-set. Indeed, when the AVG_MAX metric was used, the classification accuracy increased by almost 10% compared to that of theR-sets. Therefore, the AVG_MAX parameter appears to have a critical role in the enrichment of biological pathways related to the problem.
As in the previous case, the Jiang&Conrath and oldZZL semantic methods appear to apply effectively on this dataset as well, espe-cially in combination with AVG_MAX value.
However, three out of five S-sets with theway of evaluating
semantic similarityparameter set to AVG rendered worse results
as it happens in the set having the parameterssemantic method
and way of evaluating gene semantic similarityset to Resnik and
AVG_MAX respectively. Again, when the way of evaluating gene
semantic similarityequals AVG no improvement as far as the accu-racy is concerned is achieved.
Last but not least, the fourS-sets reaching levels of accuracy near 90% (Cao.AVG_MAX, JiangConrath.AVG_MAX, Lin.AVG_MAX and oldZZL.AVG_MAX) contain genes which are highly semantically similar to problem related ones such as DSCR1L1, FMR1 showing high similarity with NHLH1 and ACTR1A being similar to AP3B2. Specifically, DSCR1L1, a gene considered as critical for the Down syndrome (Ca interaction proteins), and FMR1, which may play a role in the development of synaptic connections between nerve cells in the brain (also known as ‘‘fragile X mental retardation pro-tein”) are found to be semantically, and also functionally, similar with NHLH1, which may serve as DNA-binding protein and may
be involved in the control of cell-type determination, possibly with-in the developwith-ing nervous system. Likewise, the finalS-set contains the gene ACTR1A, which is involved in a diverse array of cellular functions, including ER-to-Golgi transport, the centripetal move-ment of lysosomes and endosomes, spindle formation, chromo-some movement, nuclear positioning, and axonogenesis, due to its semantic similarity with AP3B2, a gene that is thought to serve neuron-specific functions such as neurotransmitter release. As in the previous case, in order to achieve the presence of these specific genes using the legacy statistical feature selection methods, the inclusion of more irrelevant to the problem genes would be re-quired, thus decreasing the classification efficiency. Specifically, using the legacy method, the inclusion of the above genes would re-quire the use of 3996 attributes in total, resulting to a classification accuracy of 75%, much poorer than the 91.67% that SoFoCles yields. 6.4. Discussion
We have measured the effect of semantically enhancing gene expression feature sets in order to improve microarray classifica-tion accuracy. To this end, we have used several semantic similar-ity methods and three approaches for computing semantic similarity between genes.
To summarize, better results are obtained when only the terms with the maximum similarity are taken into consideration at a time (MAX approach). More specifically, in the DSdataset, three
out of fiveS-sets with the MAX parameter perform more efficiently than theR-sets, as is the case in theDCNVdataset, as well. Even
more satisfactory results were produced when the AVG_MAX value was used for evaluating gene semantic similarity, especially in the DCNVset. This can be attributed to the fact that genes (or gene
prod-ucts) have multiple biological roles. Thus, for each term annotated to a gene, only its similarity to the most similar one of the other genes is taken into account. Consequently, all the characteristics of the genes are considered during the evaluation of their semantic similarity. The AVGway of evaluating gene semantic similaritywas found to be inadequate. DCNV 0 5 10 15 20 25 30 35 40 45 50 55 60 65 70 75 80 85 90 95 100 whole
refined (20 features)refined (34 features)
refined (20 features + 14 random) refined (34 features) Resnik.AVG Lin.AVG JiangConrath.AVG Cao.AVG oldZZL.AVG Resnik.MAX Lin.MAX JiangConrath.MAX Cao.MAX oldZZL.MAX Resnik.AVG_MAX Lin.AVG_MAX JiangConrath.AVG_MAX Cao.AVG_MAX oldZZL.AVG_MAX Overall Accuracy
SoFoCles datasets
W
-set
R
-sets
Fig. 8.Classification accuracy for theDCNVdataset. Accuracies were measured for the whole dataset (W-set), four different datasets refined with legacy statistical methods (R
-sets), and the SoFoCles datasets (S-sets) that are semantically enhanced using five semantic similarity methods and three different approaches for computing semantic similarity between genes.
Focusing on the semantic methods used, the Jiang&Conrath and the oldZZL seem more appropriate at least for the two datasets used (DSandDCNV). In particular, these methods achieved optimum
performance in both datasets when combined with MAX and AVG_MAX values of theway of evaluating gene semantic similarity parameter.
SoFoCles can be a valuable tool in microarray data analysis by contributing to the process of improving classification results in microarray data, as well as in providing them with more biological insight. SoFoCles is achieving that by reinforcing the discriminative power of marker genes not only by just adding highly semantically similar genes which are likely to participate in common biological pathways, but also by exploiting knowledge from one of the most respected biological ontologies, the Gene Ontology.
7. Conclusions and future work
SoFoCles is a methodology for marker gene selection in micro-array experiments that combines semantic and statistical knowl-edge in a unified environment. The methodology has been implemented as a software platform which provides the user with an experimenting suite comprising a series of semantic similarity algorithms and an easy way of handling and parameterizing the Gene Ontology. SoFoCles reinforces already spotted biological pro-cess pathways by finding the most semantically similar genes of the R-sets. The user of the suite can experiment with different semantic similarity algorithms and fine-tuning parameters in or-der to achieve optimal performance. It is also worth noting that the interface environment of the tool is user-friendly, guiding the user step by step and presenting information messages, where nec-essary, in order to ensure its proper functionality.
Microarray classification experiments have demonstrated the ability of the proposed technique to improve classification accu-racy, by enhancing the dataset with strong marker genes that might otherwise have been omitted. The performance of SoFoCles proved better not only compared to theW-set but to theR-sets, as well.
The ability of SoFoCles to reveal semantically similar marker genes is directly dependent on the quality of the Gene Ontology it-self. Thus, further improvement or enrichment of the Gene Ontol-ogy may yield even better results with SoFoCles. At present, only a small fraction of the existing genes is annotated to GO terms. From
this percentage, the majority of the annotations is based on elec-tronic techniques, which contain high levels of unreliability espe-cially when not supported by a GO curator. Although SoFoCles is able to exclude such annotations, an improvement in GO annota-tions quality will automatically enhance the quality of SoFoCles results.
Future work on SoFoCles aims at uncovering more of the ‘‘shad-owy” pathways that are not revealed after the application of legacy feature selection methods. Such pathways may hide important information and have considerable discriminative power of uncov-ering the separate labels of the problem. One possible solution is the clustering of genes of the R-set. Clustering these genes into groups that are likely to participate in common pathways might take more paths into consideration and prevent excessive rein-forcement of main paths as well. Moreover, statistical measures can be applied to the semantically similar genes retrieved in order to isolate representative genes of a group rather than all genes. In that way, genes having same functionalities with a referenced one and do not serve further in the amplification of a pathway will be ignored.
In conclusion, the first version of SoFoCles seems to reinforce the synergy between statistical and semantic methods for the improvement of classification results and the attribution of more biological insight on them.
Appendix A. Supplementary data
Supplementary data associated with this article can be found, in the online version, atdoi:10.1016/j.jbi.2009.06.002.
References
[1] Khan J, Wei JS, Ringner M, Saal LH, Ladanyi M, Westermann F. Classification and diagnostic prediction of cancers using gene expression profiling and artificial neural networks. Nat Med 2001;7:673–9.
[2] Alon U, Barkai N, Notterman DA, Gish K, Ybarra S, Mack D, et al. Broad patterns of gene expression revealed by clustering analysis of tumor and normal colon tissues probed by oligonucleotide arrays. Proc Natl Acad Sci USA 1999;96:6745–50.
[3] Golub TR, Slonim DK, Tamayo P, Huard C, Gaasenbeek M, Mesirov JP, et al. Molecular classification of cancer: class discovery and class prediction by gene expression monitoring. Science 1999;286:531–7.
[4] Bomprezzi R, Ringner M, Kim S, Bittner ML, Khan J, Chen Y, et al. Gene expression profile in multiple sclerosis patients and healthy controls: identifying pathways relevant to disease. Hum Mol Genet 2003;12:2191–9. -8 -6 -4 -2 0 2 4 6 8 10 12
Resnik Lin JiangConrath Cao oldZZL
AVG MAX AVG_MAX
[5] Wang Y, Makedon F, Ford J, Pearlman J. HykGene: a hybrid approach for selecting marker genes for phenotype classification using microarray gene expression data. Bioinformatics 2005;21(8):1530–7.
[6] Xiong F, Huang H, Ford J, Makedon F, Pearlman J. A new test system for stability measurement of marker gene selection in DNA microarray data analysis. In: Proceedings of the 10th Panhellenic conference on informatics; 2005. p. 43747.
[7] Li J, Su H, Chen H. Identification of marker genes from high-dimensional microarray data for cancer classification. Knowledge discovery in bioinformatics. New York: Wiley; 2007.
[8] Lu Y, Han J. Cancer classification using gene expression data. Data Manag Bioinform 2003;28(4):243–78 [special issue].
[9] Breiman L, Friedman J, Olshen R, Stone C. Classification and regression trees. Belmont, CA: Wadsworth International Group; 1984.
[10] Liu H, Setiono R. Chi2: feature selection and discretization of numeric attributes. In: Proceedings of the 7th international conference on tools with artificial intelligence; 1995. p. 388–91.
[11] Kononenko I. Estimating attributes: analysis and extensions of relief. In: Proceedings of the European conference on machine learning; 1994. p. 171– 82.
[12] Saeys Y, Inza I, Larranaga P. A review of feature selection techniques in bioinformatics. Bioinformatics 2007;23(19):D2507–17.
[13] Jaeger J, Sengupta R, Ruzzo WL. Improved gene selection for classification of microarrays. Proc Pacific Symp Biocomput 2003;8:53–64.
[14] Camon E, Magrane M, Barrel D, Lee V, Dimmer E, Maslen J, et al. The Gene Ontology Annotation (GOA) database: sharing knowledge in UniProt with Gene Ontology. Nucl Acids Res 2004;32(1):D262–6.
[15] The UniProt Consortium. The universal protein resource (UniProt). Nucl Acids Res (Database issue) 2007;35:D193–7.
[16] Mulder NJ, Apweiler R, Attwood TK, Bairoch A, Bateman A, Binns D, et al. New developments in the InterPro database. Nucl Acids Res 2007;35:D224–8. [17] Jaiswal P, Ni J, Yap I, Ware D, Spooner W, Youens-Clark K, et al. Gramene: a
bird’s eye view of cereal genomes. Nucl Acids Res 2006;34:D717–23. [18] Eppig JT, Bult CJ, Kadin JA, Richardson JE, Blake JA, the members of the Mouse
Genome Database Group. The mouse genome database (MGD): from genes to mice—a community resource for mouse biology. Nucl Acids Res 2005;33:D471–5.
[19] Crosby MA, Goodman JL, Strelets VB, Zhang P, Gelbart WM, the FlyBase Consortium. FlyBase: genomes by the dozen. Nucl Acids Res 2007;35:D486–91.
[20] Chisholm RL, Gaudet P, Just EM, Pilcher KE, Fey P, Merchant SN, et al. DictyBase, the model organism database forDictyostelium discoideum. Nucl Acids Res (Database issue) 2006;34:D423–7.
[21] Rhee SY, Beavis W, Berardini TZ, Chen G, Dixon D, Doyle A, et al. The Arabidopsis Information Resource (TAIR): a model organism database providing a centralized, curated gateway to Arabidopsis biology, research materials and community. Nucl Acids Res 2003;31(1):224–8.
[22] Khatri P, Draghici S. Ontological analysis of gene expression data: current tools, limitations, and open problems. Bioinformatics 2005;21(18):3587–95. [23] Goldstone RL, Son J. Similarity. In: Holyoak K, Morrison R, editors. Cambridge
handbook of thinking and reasoning. Cambridge: Cambridge University Press; 2005. p. 13–36.
[24] Larkey LB, Markman AB. Processes of similarity judgment. Cogn Sci 2005;29(6):1061–76.
[25] Tversky A. Features of similarity. Psychol Rev 1977;84(4):327–52.
[26] Goldstone RL. The role of similarity in categorization: providing a groundwork. Cognition 1994;52:125–57.
[27] Rips LJ, Shoben EJ, Smith EE. Semantic distance and the verification of semantic relations. J Verbal Learn Verbal Behav 1973;12:1–20.
[28] Schwering A, Raubal M. Measuring semantic similarity between geospatial conceptual regions. In: Rodriguez A, Cruz I, Egenhofer M, Levashkin S, editors. GeoSpatial Semantics—1st international conference. Lecture notes in computer science 3799; 2005. p. 90–106.
[29] Bellazi R, Zupan B. Towards knowledge-based gene expression data mining. J Biomed Inform 2007;40(6):787–802.
[30] Ashburner M, Ball CA, Blake JA, Botstein D, Butler H, Cherry JM. Gene ontology: tool for the unification of biology. The gene ontology consortium. Nat Genet 2000;25:25–9.
[31] Subramanian A, Tamayo P, Mootha VK, Mukherjee S, Ebert BL, Gillette MA, et al. Gene set enrichment analysis: a knowledge-based approach for interpreting genome-wide expression profiles. Proc Natl Acad Sci USA 2005;102:15545–50.
[32] Qi J, Tang J. Gene Ontology driven feature selection from microarray gene expression data. In: Proceedings IEEE symposium on computational intelligence and bioinformatics and computational biology (CIBCB); 2006. p. 1–7.
[33] Qi J, Tang J. Integrating gene ontology into discriminative powers of genes for feature selection in microarray data. In: Proceedings ACM symposium on applied computing; 2007. p. 430–4.
[34] The Gene Ontology Consortium. Creating the Gene Ontology resource. design and implementation. Genome Res 2001;11:1425–33.
[35] Lord P, Stevens R, Brass A, Goble C. Investigating semantic similarity measures across the Gene Ontology: the relationship between sequence and annotation. Bioinformatics 2003;19(10):1275–83.
[36] Schlicker A. A global approach to comparative genomics: comparison of functional annotation over the taxonomic tree. Master thesis. Saarbrücken, Germany: Center for Bioinformatics of Saarland University; 2005. p. 1–82. [37] Bérard S, Tichit L, Herrmann C. ClusterInspector: a tool to visualize
ontology-based relationships between biological entities. In: Proceedings Journees Ouvertes Biologie Informatique Mathematiques (JOBIM); 2005. p. 1–12. [38] Jiang J, Conrath D. Semantic similarity based on corpus statistics and lexical
taxonomy. In: Proceedings of international conference on research in computational linguistics; 1997. p. 115.
[39] Resnik P. Using information content to evaluate semantic similarity in a taxonomy. In: Proceedings of the 14th international joint conference on artificial intelligence; 1995. p. 44853.
[40] Lin D. An information—theoretic definition of similarity. In: Proceedings of 15th international conference on machine learning; 1998. p. 296304. [41] Cao S, Qin L, He W, Zhong Y, Zhu Y, Li Y. Semantic search among heterogeneous
biological databases based on Gene Ontology. Acta Biochim Biophys Sinica 2004;36(5):365–70.
[42] Zhu H, Zhong J, Li J, Yu Y. An approach for semantic search by matching RDF graphs. In: Proceedings of the 15th international Florida artificial intelligence research society conference; 2002. p. 450–4.
[43] Zhong J, Zhu H, Li J, Yu Y. Conceptual graph matching for semantic search. In: Proceedings of the 10th international conference on conceptual structures: integration and interfaces; 2002. p. 92106.
[44] Patwardhan S, Banerjee S, Pedersen T. Using measures of semantic relatedness for word sense disambiguation. In: Proceedings of the 4th international conference on intelligent text processing and computational linguistics; 2003. p. 1–17.
[45] Wu Z, Palmer M. Verb semantics and lexical selection. In: Proceedings of the 32nd annual meeting of the associations for computational linguistics; 1994. p. 133–8.
[46] Couto F, Silva M, Coutinho P. Measuring semantic similarity between Gene Ontology terms. Data Knowledge Eng 2007;61(1):137–52.
[47] Witten IH, Frank E. Data mining: practical machine learning tools and techniques. 2nd ed. San Francisco: Morgan Kaufman; 2005.
[48] Ihaka R, Gentleman R. R: a language for data analysis and graphics. J Comput Graph Stat 1996;5(3):299–314.
[49] Spira A, Beane J, Shah V, Liu G, Schembri F, Yang X, et al. Effects of cigarette smoke on the human airway epithelial cell transcriptome. Proc Natl Acad Sci USA 2004;101(27):10143–8.
[50] Pomeroy SL, Tamayo P, Gaasenbeek M, Sturla LM, Angelo M, McLaughlin ME, et al. Prediction of central nervous system embryonal tumour outcome based on gene expression. Nature 2002;415(6870):436–42.