e-ISSN: 2177-5133 www.comunicatascientiae.com
Correlations and path analysis for yield
components in irrigated rice
Eduardo Anibele Streck1*, Gabriel Almeida Aguiar1, Paulo Henrique Karling Facchinello1, Lais Perin1, Tuise Kuhn Krüger1, Ariano Martins de Magalhães Júnior2
1Federal University of Pelotas, Brazil
2Brazilian Agricultural Research Corporation, Pelotas, Brazil
*Corresponding author, e-mail: [email protected]
Abstract
Grain yield of irrigated rice is a complex character resulting from the expression and association of different components, which should be considered by the breeder for an efficient process of selection of new genotypes. In this sense, the objective is to highlight the phenotypic correlations and the direct and indirect associations of the main components related to crop yield via path analysis. The experiment was carried out in an experimental field of the Lowlands Station of Embrapa Clima Temperado using six genotypes of irrigated rice: the cultivars BRS Pampa, BRS IRGA 409, BRS 7 ‘Taim’, BRS Sinuelo CL, BRS Pampeira and AB 10101 CL. The agronomic characters evaluated were grain yield, days to flowering, panicle length, panicle mass, number of fertile spikelets, number of sterile spikelets, number of tillers per plant, number of panicles per square meter, and mass of one thousand grains. The number of fertile spikelets, number of panicles per square meter, panicle mass and mass of one thousand grains influenced grain yield, both through phenotypic correlation and direct effects. In addition, there was a high direct linear tendency of these variables towards yield. Panicle length and number of sterile spikelets showed a potential of use in the indirect selection for grain yield.
Keywords: agronomic characters, plant breeding, Oryza sativa, direct selection, indirect selection
Introduction
Rice (Oryza sativa L.) is a cereal that comprises the food base of the population worldwide. To meet the growing demand evidenced by the demographic increase, the performance of breeding programs is of fundamental importance in the selection of genotypes with genetic constitutions with a high productive potential and interesting agronomic characters.
However, grain yield of irrigated rice is a complex character resulting from the expression and association of different components, which should be considered by the breeder for an efficient process of selection of new genotypes.
For this, information about the nature and magnitude of phenotypic variations, as well as about the correlations of other agronomic characteristics with yield, is necessary. In addition, knowledge on the extent of environmental
influence on the expression of characteristics is of
fundamental importance (Gomes et al., 2007). In plant breeding programs, the correlation between characters is of extreme importance in order to carry out a simultaneous selection among them, or when the character of interest has a low heritability or is difficult to identify or measure. Thus, a mechanism used is the selection of plants based on characteristics correlated with the main variable. Therefore, by
knowing the magnitude of the correlation of an explanatory variable with the main variable,
one can evaluate the influence on it. However,
some misunderstandings may occur in selection strategies of characters evaluated by quantifying the magnitude of correlations among characters. The high correlation between two characters may be the result of the effect of a third party on them, or of a group of characters (Cruz et al., 2012). Thus, the breeder should verify which characters should act on the selection index, as well as associate the direct and indirect selection for the increase in genetic gains of the most interesting character (Teixeira et al., 2012).
To better understand associations between different characters, Wright (1921) proposed a method of unfolding the estimated correlations into direct and indirect effects of explanatory variables on a main variable, called path analysis. This method is based on the evaluation of the effects of an independent variable (x) on a dependent variable (y) after
excluding the influence of all other independent
variables (xi) included in the analysis (Kavalco et al. 2014). Path analysis has been used successfully for the genetic breeding of several cultures, aiding in the process of culture selection. These cultures are wheat (Gondim et al., 2008; Vesalaki
et al., 2011; Kavalco et al., 2004), sunflower
(Hladni et al., 2006; Amorim et al., 2008), soybean (Nogueira et al., 2012), beans (Cabral et al., 2011) and rice (Nandan et al., 2010; Ekka et al., 2011; Dalchiavonet al., 2012).
In this sense, in order to subsidize breeding programs regarding the selection processes of promising genotypes of irrigated rice, the objective is to determine phenotypic correlations and direct and indirect associations of the main components related to crop yield via path analysis.
Material and Methods
The experiment was conducted at an experimental field of the Lowlands Station of Embrapa Clima Temperado, in Capão do Leão, Rio Grande do Sul state, in the 2013/2014 season. The experiment comprised of completely randomized blocks with four replications. The plots comprised nine rows 5 m long with a spacing
of 0.17 m between lines. The useful plot area consisted of the 4 central meters of the seven internal rows in order to exclude undesirable effects of borders. The sowing density was 100 kg ha-1 using a mechanical seed plotter under a conventional planting system. The basic fertilization was 300 kg ha-1 of NPK (formula 5-20-20) and 90 kg ha-1 of nitrogen as urea, 50% of the dose applied at the stage V4 and the remainder at the stage R0 (differentiation of the
floral primordium). The permanent flood irrigation
system was used until the maturation stage of the genotypes.
For this study, six genotypes of irrigated rice were used: the cultivars BRS Pampa, BR IRGA 409, BRS 7 ‘Taim’, BRS Sinuelo CL, BRS Pampeira and an elite hybrid strain of Embrapa’s breeding program, AB 10101 CL.
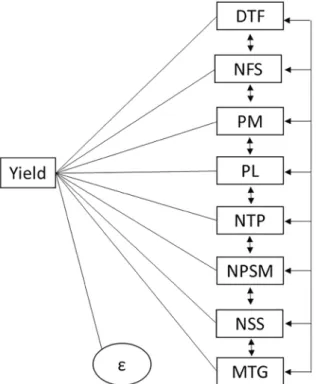
Agronomic characters were evaluated in 10 plants of each genotype in each block, according to the diagram of Figure 1. The characters evaluated were grain yield (kg ha-1) - yield per unit area adjusted to 13% moisture; days
to flowering (days) - number of days until the
emergence of up to 50% of exposed panicles; panicle length (cm) - dimension of the base at the first insertion of the panicle up to its upper tip; panicle mass (g) - mass of each panicle measured in an analytical balance; number of fertile spikelets - manual count of all spikelets that generated seeds in each panicle; number of sterile spikelets - manual count of all spikelets that did not generate seeds in each panicle; number of tillers per plant - manual count of all fertile tillers in each plant; number of panicles per square meter - count of the number of panicles emitted over an area of 1 meter x 1 meter; mass of one thousand grains (g) - count of 1,000 grains and later weighing in an analytical balance.
In order to determine the existence of a linear correlation between characters, the test of significance of “bootstrap” with 10,000 simulations was used. This is a procedure conducted for the analysis of phenotypic correlations by obtaining
a number n of estimates of correlations (ρ)
from the original dataset which is de-structured (permuted). The procedure consists of the following steps, considering two characteristics: for one of the characteristics analyzed (X or Y),
the information of each treatment is exchanged, generating a new data set (ni). The new data set is submitted to analysis of variance, according to the model. A new correlation estimate is obtained
(ρι). After obtaining the number n of correlation
estimates (n = 10,000), the correlation hypothesis test is performed considering all n estimates determined. The critical value of significance
is obtained in the correlation vector (ρι), i=1, 2,
n). Thus, we consider 1% probability , and 5% probability , where “r” is the correlation estimate.
After the existence of a significant correlation between pairs of characters is confirmed, obtained from averages of ten plants per plot, a path analysis and later a linear regression of yield characters of greatest effect on grain yield were performed.
The statistical procedures were processed by the quantitative genetics and experimental statistics software GENES (Cruz, 2013).
Results and Discussion
The univariate analysis of variance (Table 1) showed that there was a significant difference by F test for all ten quantitative
variables analyzed, which presented coefficients of variation between 1.8% for the variable of one thousand grains and 17.6% for the variable number of sterile spikelets. There was a high heritability of the evaluated characters (between 86 and 97%), thus providing a high precision in the selection process.
The phenotypic correlations (Table 2) between the analyzed pairs of characters presented correlations with different amplitudes, making it possible to identify pairs of characters with significant and non-significant correlations. In plant breeding, for reasons of selection of the most important characters, in order to facilitate and optimize the work, the signal (positive or negative) and the magnitude of the values are considered in the interpretation of correlations.
There were 24 significant phenotypic correlations. The highest magnitude of significant positive correlation (0.993) was observed between grain yield and number of fertile spikelets per panicle, corroborating with Guimarães et al. (2006), who found a significant positive correlation. Therefore, the greater number of fertile spikelets, either by the greater
Figure 1. Causal diagram showing the direct and indirect effects of
the explanatory variables days to flowering (DTF), number of fertile
spikelets (NFS), panicle mass (PM), panicle length (PL), number of tillers per plant (NTP), number of panicles per square meter (NPSM) number of sterile spikelets (NSS) and mass of one thousand grains (MTG) on the main variable grain yield per unit area (Yield), without
number of panicles per square meter or by the greater length of panicles, increases the harvest index. However, the only significant negative
Table 1. Analysis of variance and estimates of genetic and phenotypic parameters in irrigated rice regarding the
agronomic characters days to flowering (DTF), number of fertile spikelets (NFS), panicle mass (PM), panicle length
(PL), number of tillers per plant (NTP), number of panicles per square meter (NPSM), number of sterile spikelets (NSS), mass of one thousand grains (MTG) and yield of grains per unit area (Yield).
Effects DF Yield DTF NFS Mean SquarePM PL NTP NPSM NSS MTG
Block 3 157811.75 7.71 23.17 0.06 0.24 1.34 565.00 31.82 0.47 Genotypes 5 4089355.86** 114.07** 737.85** 0.56** 11.60** 7.63** 18746.47** 257.68** 3.04** Residual 15 290598.43 3.14 82.41 0.07 0.50 1.04 630.80 8.83 0.23 Average . 8899.54 90.88 116.58 3.54 23.10 7.55 384.17 16.89 26.45 CV(%) . 6.06 1.95 7.79 7.45 3.07 13.51 6.54 17.60 1.80 Minimum . 7162.36 84.00 93.90 2.91 19.05 5.00 290.00 3.70 24.75 Maximum . 10734.94 100.00 148.30 4.31 25.25 10.90 537.00 34.00 27.96 ơ² genetics . 949689.36 27.73 163.86 0.12 2.78 1.65 4528.92 62.21 0.70 ơ² environment . 290598.43 3.14 82.41 0.07 0.50 1.04 630.80 8.83 0.23 h2(%) . 92.89 97.25 88.83 87.48 95.67 86.39 96.64 96.57 92.56
** = Significant at 1% probability by F test. CV = coefficient of variation; h2 = heritability.
correlation with yield was found for number of sterile spikelets (-0.557).
Table 2. Phenotypic correlations among the agronomic characters days to flowering (DTF), number of fertile
spikelets (NFS), panicle mass (PM), panicle length (PL), number of tillers per plant (NTP), number of panicles per square meter (NPSM), number of sterile spikelets (NSS), mass of one thousand grains (MTG) and yield of grains per unit area (Yield) evaluated in irrigated rice genotypes.
DTF NFS PM PL NTP NPSM NSS MTG Yield DTF 1 0.176 0.441 0.318 0.651+ 0.035 -0.227 -0.121 0.170 NFS 1 0.913++ 0.693+ 0.515+ 0.975++ -0.641+ 0.827++ 0.993++ PM 1 0.768++ 0.578+ 0.809++ -0.551+ 0.622+ 0.917++ PL 1 0.385 0.550+ -0.043 0.405 0.725+ NTP 1 0.459+ -0.197 0.584+ 0.562+ NPSM 1 -0.693+ 0.882++ 0.960++ NSS 1 -0.398 -0.557+ MTG 1 0.856++ Yield 1
** = Significant at 1% probability by F test. CV = coefficient of variation; h2 = heritability.
The variable days to flowering was
the only one that did not present a significant correlation in relation to grain yield, as well as to its correlations with most variables analyzed. These results corroborate other studies with rice, which verified correlations of low magnitude not exceeding values equivalent to 0.32 (Nandan et al., 2010; Ekka et al., 2011; Aditya & Bhartiya, 2013).
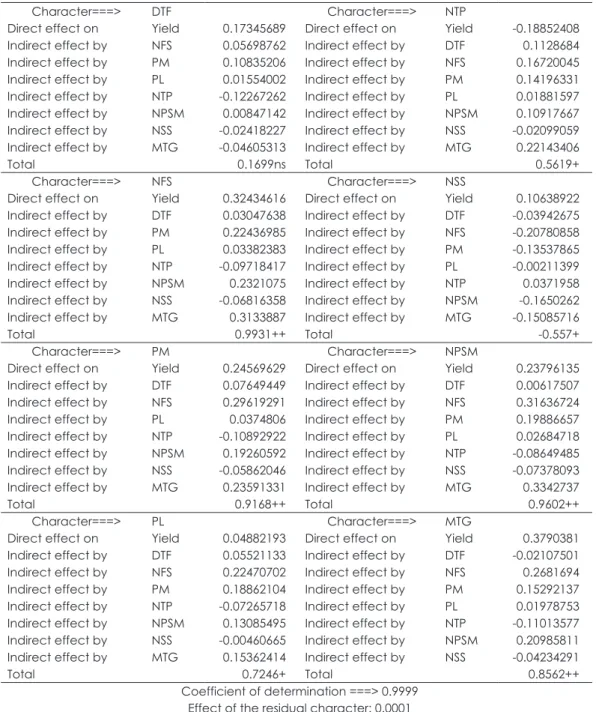
The estimates of direct and indirect effects of explanatory variables on the main response variable yield (Table 3) showed that the variables number of fertile spikelets, panicle mass, number of panicles per square meter and mass of one thousand grains obtained high positive magnitudes and a pronounced direct effect on yield; therefore, the existing phenotypic correlation explains much of the true association.
These effects corroborate with results found by Rani et al. (2014). They reported that the number of fertile panicles, number of spikelets per panicle and mass of one thousand grains were the
components that most influenced grain yield.
Marchezan et al. (2005) observed that the mass of one thousand grains was the component of the production with the greatest effect on the increase in rice yield.
The number of fertile spikelets, panicle mass, number of panicles per square meter and mass of one thousand grains presented a high indirect association. According to Akita (1995), the low participation of photoassimilates for the growth of vegetative organs in semi-dwarf cultivars resulted in a greater accumulation of non-structural carbohydrates in stems and sheaths
the panicles and used in the filling of grains. Panicle length, as well as number of sterile spikelets, showed a significant phenotypic correlation. However, it had an indirect effect on yield through panicle mass, mass of one thousand grains and number of panicles m-2. Guimarães et al. (2006) found that the number of sterile
spikelets per panicle significantly influenced,
in an inverse and quadratic manner, rice yield, while the number of fertile spikelets per panicle
directly and linearly influenced this agronomic
characteristic.
The variable days to flowering did not
present high direct and/or indirect associations with most of the variables analyzed, a fact explained by the use of agronomically superior genotypes that underwent a high breeding process. This reveals that early cultivars, such as BRS Pampa, can be as productive as medium-cycle cultivars.
Table 3. Estimates of direct and indirect effects of path coefficients estimated from the phenotypic correlation of the characters days to flowering (DTF), number of fertile spikelets (NFS), panicle mass (PM), panicle length (PL),
number of tillers per plant (NTP), number of panicles per square meter (NPSM), number of sterile spikelets (NSS) and mass of one thousand grains (MTG) on yield of grains per unit area evaluated in irrigated rice genotypes.
Character===> DTF Character===> NTP
Direct effect on Yield 0.17345689 Direct effect on Yield -0.18852408
Indirect effect by NFS 0.05698762 Indirect effect by DTF 0.1128684
Indirect effect by PM 0.10835206 Indirect effect by NFS 0.16720045
Indirect effect by PL 0.01554002 Indirect effect by PM 0.14196331
Indirect effect by NTP -0.12267262 Indirect effect by PL 0.01881597
Indirect effect by NPSM 0.00847142 Indirect effect by NPSM 0.10917667
Indirect effect by NSS -0.02418227 Indirect effect by NSS -0.02099059
Indirect effect by MTG -0.04605313 Indirect effect by MTG 0.22143406
Total 0.1699ns Total 0.5619+
Character===> NFS Character===> NSS
Direct effect on Yield 0.32434616 Direct effect on Yield 0.10638922
Indirect effect by DTF 0.03047638 Indirect effect by DTF -0.03942675
Indirect effect by PM 0.22436985 Indirect effect by NFS -0.20780858
Indirect effect by PL 0.03382383 Indirect effect by PM -0.13537865
Indirect effect by NTP -0.09718417 Indirect effect by PL -0.00211399
Indirect effect by NPSM 0.2321075 Indirect effect by NTP 0.0371958
Indirect effect by NSS -0.06816358 Indirect effect by NPSM -0.1650262
Indirect effect by MTG 0.3133887 Indirect effect by MTG -0.15085716
Total 0.9931++ Total -0.557+
Character===> PM Character===> NPSM
Direct effect on Yield 0.24569629 Direct effect on Yield 0.23796135
Indirect effect by DTF 0.07649449 Indirect effect by DTF 0.00617507
Indirect effect by NFS 0.29619291 Indirect effect by NFS 0.31636724
Indirect effect by PL 0.0374806 Indirect effect by PM 0.19886657
Indirect effect by NTP -0.10892922 Indirect effect by PL 0.02684718
Indirect effect by NPSM 0.19260592 Indirect effect by NTP -0.08649485
Indirect effect by NSS -0.05862046 Indirect effect by NSS -0.07378093
Indirect effect by MTG 0.23591331 Indirect effect by MTG 0.3342737
Total 0.9168++ Total 0.9602++
Character===> PL Character===> MTG
Direct effect on Yield 0.04882193 Direct effect on Yield 0.3790381
Indirect effect by DTF 0.05521133 Indirect effect by DTF -0.02107501
Indirect effect by NFS 0.22470702 Indirect effect by NFS 0.2681694
Indirect effect by PM 0.18862104 Indirect effect by PM 0.15292137
Indirect effect by NTP -0.07265718 Indirect effect by PL 0.01978753
Indirect effect by NPSM 0.13085495 Indirect effect by NTP -0.11013577
Indirect effect by NSS -0.00460665 Indirect effect by NPSM 0.20985811
Indirect effect by MTG 0.15362414 Indirect effect by NSS -0.04234291
Total 0.7246+ Total 0.8562++
Coefficient of determination ===> 0.9999 Effect of the residual character: 0.0001
ns = Not significant at 1% and 5%, respectively, by the bootstrap method with 10,000 simulations. ++; + = Significant at 1% and 5%, respectively, by the bootstrap method with 10,000 simulations
The total coefficient of determination (r2) equal to 0.9999, which is associated with the effects of the residual variable, allows concluding that variations in yield are fully explained by the causal diagram used in this study. Thus, the effects of these primary variables explain the variations in grain yield in a summarized way.
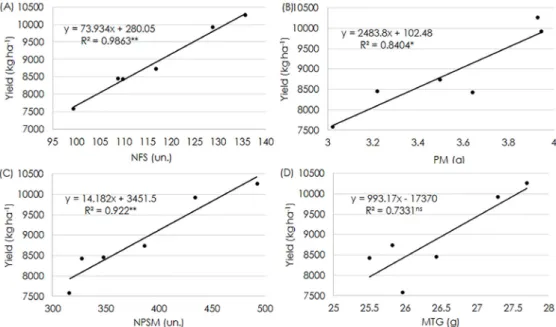
The linear regression analysis (Figure 2) of the direct effect variables on yield showed a significant linear effect for the variables number of fertile spikelets, panicle mass and number of panicles per square meter. However, the variable mass of one thousand grains showed a non-significant linear tendency. This is because all tested genotypes presented long and fine grains, with appropriate standards by the Brazilian industry and cuisine, according to which there is a 3:1 ratio between grain length and grain width (Figure 2D).
Figure 2A shows a linear increase tendency in yield as the number of fertile
spikelets per panicle increases, established by a coefficient of determination equivalent to 98%. Dalchiavon et al. (2012) verified that the number of fertile spikelets per panicle via simple linear regression was the variable that presented the best linear response with grain yield of rice under a no-tillage system. Guimarães et al. (2006) also verified a direct linear behavior, and the model explained about 68% of the yield variation in irrigated rice.
The panicle mass and number of panicles per square meter also presented increasing linear responses in relation to yield (Figure 2B and Figure 2C, respectively). By the generalized linear statistical fitting measure, it can be seen that the model explains 85% and 92%, respectively, of crop yield responses. This high linear response verified for the variable number of panicles per square meter contrasts with the results obtained by Dalchiavon et al. (2012), who found a low linear association (22%).
** Significant at 1% probability by F test
Figure 2. Linear regression analysis of direct effect variables on grain yield in irrigated rice genotypes. (A) yield of irrigated rice grains in function of the number of fertile spikelets (NFS), (B) yield of irrigated rice grains in function of panicle mass (PM), (C) yield of irrigated rice grains in function of the number of panicles m-2 (NPSM), (D) grain yield of irrigated rice in function of the mass of one thousand grains (MTG).
Thus, we can point out that rice breeders should use such direct and indirect selection techniques in breeding programs to assist with the selection process, thus increasing the chances of obtaining cultivars with a higher yield. According to Ribeiro et al. (2010), this indirect selection of components of grain yield provides the identification of superior genotypes.
In addition, knowledge on the interrelationship between characters is of great interest and importance because one can evaluate how much of a change in one character may affect other characters (Silva et al., 2009).
In this context, the models and parameters used in this study can perfectly be used to estimate the yield of grains of irrigated
rice when the conditions of cultivation are similar to those of this research. This finding can be evidenced by the greater ease and less time of performing indirect selections via characters
that most influenced yield. Thus, it is possible, at
a field level, to carry out the selection in a more efficient and fast way, obtaining high heritability evaluations.
Conclusions
The number of fertile spikelets, number of panicles per square meter, panicle mass and mass of one thousand grains were the factors
that influenced grain yield the most, both through
phenotypic correlation and direct effects. Panicle length and number of sterile spikelets showed a potential of use in the indirect selection for grain yield.
Acknowledgements
To EMBRAPA for the availability of the physical database, and to CAPES for the granting of financial support.
References
Aditya, J.P., Bhartiya, A. 2013. Genetic variability, Correlation and Path Analysis for Quantitative Characters in Rainfed Upland Rice of Uttarakhand Hills. Journal of Rice Research 62: 24-34.
Akita, S. 1995. Aspectos ecofisiológicos relacionados ao aumento do potencial de rendimento biológico e comercial da cultura do arroz (Oryza sativa L.). In: RENAPA. Arroz na América Latina: perspectivas para o incremento da produção e do potencial produtivo. Embrapa Arroz e Feijão, Goiânia, Brasil. p.57-76.
Amorim, E.P., Ramos, N.P., Ungaro M.R.G., Kiihl, T.A.M. 2008. Correlações e Análise de Trilha em Girassol. Bragantia 67: 307-316.
Cabral, P.D.S., Soares, T.C.B., Lima, A.B.P., Soares, Y.J.B., Silva, J.A. 2011. Análise de trilha do rendimento de grãos de feijoeiro (Phaseolus vulgaris L.) e seus componentes. Revista Ciência Agronômica 42:132-138.
Cruz, C.D., Regazzi, A.J., Carneiro, P.C.S. 2012. Métodos biométricos aplicados ao melhoramento genético. Editora UFV, Viçosa, Brasil. p. 392-451.
Cruz, C.D. 2013. GENES - a software package for analysis in experimental statistics and quantitative genetics. Acta Scientiarum 35: 271-276.
Dalchiavon, F.C., Carvalho, M.P., Coletti, A.J,
Caione, G., Silva, A.F., Andreotti, M. 2012. Correlação linear entre componentes da produção e produtividade do arroz de terras altas em sistema plantio direto. Semina: Ciências Agrárias 33:1629-1642.
Ekka, R.E., Sarawgi, A.K., Kanwar, R.R. 2011. Correlation and Path Analysis in Traditional Rice Accessions of Chhattisgarh. Journal of Rice Research 4:11-18.
Gomes, C.N., Carvalho, S.P., Jesus, A.M.S., Custódio, T.N. 2007. Caracterização morfo agronômica e coeficientes de trilha de caracteres componentes da produção em mandioca. Pesquisa Agropecuária Brasileira 42:1121-1130.
Gondim, T.C.O., Rocha, V.S., Sediyama, C.S., Miranda, G.V. 2008. Análise de trilha para componentes do rendimento e caracteres agronômicos de trigo sob desfolha. Pesquisa Agropecuária Brasileira 43:487-493.
Guimarães, C.M., Stone, L.F., Castro, E.M. 2006. Comportamento de cultivares de arroz de terras altas no sistema plantio direto em duas profundidades de adubação. Bioscience Journal 22: 53-59.
Hladni, N., Skoric, D., Kraljevic-Balalic, M., Sakac, Z., Jovanovic, D. 2006. Combining ability for oil content and its correlations with other yield
components in sunflower (Helianthus annuus L.). Helia 29:101-110.
Kavalco, S.A.F., Figueiredo, R., Groli, E.L., Zimmer, C.M., Baretta, D., Tessmann, E.W., Magalhães Júnior, A.M., Oliveira, A.C. 2014. Análise de trilha em genótipos de trigo submetidos ao estresse por encharcamento. Semmina: Ciências Agrárias 35:1683-1696.
Marchezan, E., Martin, T.N., Santos, F.M., Camargo, E.R. 2005. Análise de coeficiente de trilha para os componentes de produção em arroz. Ciência Rural 35:1027-1033.
Nandan, R., SwetaSingh, S.K. 2010.Character Association and Path Analysis in Rice (Oryza sativa L.) Genotypes. World Journal of Agricultural Sciences 6:201-206.
Nogueira, A.P.O., Sediyama, T., Sousa, L.B., Hamawaki, O.T., Cruz, C.D., Pereira, D.G., Matsuo, É. 2012. Análise de trilha e correlações entre caracteres em soja cultivada em duas épocas de semeadura. Bioscience Journal 28:877-888. Rani, C.S., Kumari, R.U., Ulaganathan, V., Vinoth, R., Subashini, G., Komala, M. 2015. Association studies between yield and yield components in rice (Oryza sativa L.). Biochemical and Cellular Archives 15:437-440.
Ribeiro, N.D., Cargnelutti Filho, A., Poersch, N.L., Rosa, D.P. 2010. Critério de seleção indireta para a produtividade de grãos em feijão. Ciência Rural 40:986-989.
Silva, M.A., Silva, D.S., Andrade, L.A., Lopes, W.B., Santos, G.R.A. 2009. Análise de trilha para caracteres morfológicos do feijão-bravo (Capparis flexuosa) no cariri paraibano. Archivos de Zootecnia 58:121-124.
Teixeira, D.H.L, Oliveira, M.S.P.de, Gonçalves, F.M.A., Nunes, J.A.R. 2012. Índices de seleção no aprimoramento simultâneo dos componentes da produção de frutos em açaizeiro. Pesquisa Agropecuária Brasileira 47:237-243.
Vesohoski, F., Marchioro, V. S., Franco, F. A. Cantelle, A. 2011. Componentes do rendimento de grãos em trigo e seus efeitos diretos e indiretos na produtividade. Revista Ceres 58:337-341. WRIGHT, S. 1921. Correlation and causation. Journal of Agricultural Research 20:557-585.