© 2019. Aiasha Siddika. This is a research/review paper, distributed under the terms of the Creative Commons Attribution-Noncommercial 3.0 Unported License http://creativecommons.org/licenses/by-nc/3.0/), permitting all non-commercial use, distribution, and reproduction inany medium, provided the original work is properly cited.
Global Journal of Computer Science and Technology
: CSoftware & Data Engineering
Volume 19 Issue 3 Version 1.0 Year 2019
Type: Double Blind Peer Reviewed International Research Journal Publisher: Global Journals
Online ISSN: 0975-4172 & Print ISSN: 0975-4350
Study and Performance Analysis of Different Techniques for
Computing Data Cubes
By Aiasha Siddika
Stamford University
Abstract-
Data is an integrated form of observable and recordable facts in operational or transactional
systems in the data warehouse. Usually, data warehouse stores aggregated and historical data in
multi-dimensional schemas. Data only have value to end-users when it is formulated and represented
as information. And Information is a composed collection of facts for decision making. Cube
computation is the most efficient way for answering this decision making queries and retrieve
information from data. Online Analytical Process (OLAP) used in this purpose of the cube
computation. There are two types of OLAP: Relational Online Analytical Processing (ROLAP) and
Multidimensional Online Analytical Processing (MOLAP). This research worked on ROLAP and
MOLAP and then compare both methods to find out the computation times by the data volume.
Generally, a large data warehouse produces an extensive output, and it takes a larger space with a
huge amount of empty data cells. To solve this problem, data compression is inevitable. Therefore,
Compressed Row Storage (CRS) is applied to reduce empty cell overhead.
Keywords:
data cube, compressed row storage, MOLAP, ROLAP.
GJCST-C Classification:
H.2.7
StudyandPerformanceAnalysisofDifferentTechniquesforComputingDataCubes
Study and Performance Analysis of Different
Techniques for Computing Data Cubes
Aiasha Siddika
Abstract- Data is an integrated form of observable and recordable facts in operational or transactional systems in the data warehouse. Usually, data warehouse stores aggregated and historical data in multi-dimensional schemas. Data only have value to end-users when it is formulated and represented as information. And Information is a composed collection of facts for decision making. Cube computation is the most efficient way for answering this decision making queries and retrieve information from data. Online Analytical Process (OLAP) used in this purpose of the cube computation. There are two types of OLAP: Relational Online Analytical Processing (ROLAP) and Multidimensional Online Analytical Processing (MOLAP). This research worked on ROLAP and MOLAP and then compare both methods to find out the computation times by the data volume. Generally, a large data warehouse produces an extensive output, and it takes a larger space with a huge amount of empty data cells. To solve this problem, data compression is inevitable. Therefore, Compressed Row Storage (CRS) is applied to reduce empty cell overhead.
Keywords:data cube, compressed row storage, MOLAP, ROLAP.
I.
Introduction
nline Analytical Processing (OLAP) is a database acceleration techniques used for deductive analysis. The main objective of OLAP is to have constant-time or near constant time answers for many typical queries. The widespread use of Online Analytical Processing (OLAP) is to resolve multi-dimensional analytical (MDA) queries expeditiously. Business intelligence, report writing, and data mining are also some immense categories of OLAP areas along with some applications like business reporting, marketing analogy, management reporting, business process management, budgeting and forecasting, and financial reporting with other similar areas. OLAP has been created with a slight alteration from the conventional
database term Online Transaction Processing
(OLTP) [1].
OLAP tools have been adopted extensively by users from various perspectives for the evaluation of multidimensional data. Consolidation (roll-up), drill-down, and slicing-dicing are three basic analytical operations of OLAP. Consolidation associates with data aggregation and stores it in one or more dimensions. In contradiction, the drill-down involves analyzing thorough details of data. Capturing a specific set of data from
Author: Department of Computer Science and Engineering, Stamford
University Bangladesh.e-mail: [email protected]
OLAP cube called Slicing and create different viewpoints labeled as Dicing. Usually, there are two primary variations of OLAP: Relational Online Analytical Processing (ROLAP) and Multidimensional Online Analytical Processing (MOLAP). ROLAP works straight with relational databases where the dimension tables stored as relational tables, and new tables are created to hold the aggregated information by the tools. Data manipulation on this method provides an aspect of slicing and dicing functionality of traditional OLAP’s. ROLAP tools feature the ability to answer all queries because the methodology does not limited to the contents of a cube. It can also drill down to the lowest dimension of the database. Differently, Multi-dimensional Online Analytical Processing (MOLAP) uses optimized multi-dimensional array storage to store data, in alternate of the relational database. It requires the pre-computation and storage information in the cube (the data cube) - the operation known as processing. And the data cube comprises all the possible answers to a given range of queries. MOLAP provides quick response time and the tools have a very fast capacity to write back data into the data set [2].
While designing an OLAP solution, the type of OLAP storage is one of the crucial decisions. Both ROLAP and MOLAP have their advantages and disadvantages. ROLAP can handle large amounts of data, and it can also leverage functionalities inherent in the relational database, but its performance can be slow or limited by SQL functionalities. On the contrary, in MOLAP, because of all calculations performed at the cube computation, it is not possible to include a large amount of data in the data cube itself, and it requires additional investment. Also, MOLAP cubes are created for fast data retrieval and optimal for slicing and dicing operations. It can perform complex calculations that have been pre-generated when the data cube created. Hence, complex calculations are not only doable, but they return quickly [3]. The implementation of both techniques may give a better competitive result. Data cube computation often produces excessive outputs with empty memory cells thus, make wastage of memory storage. To solve this problem, I will cover an efficient computation method called Compressed Row Storage (CRS).
In this paper, I have implemented ROLAP on manipulating the data stored in the relational database to give the appearance of traditional OLAP's slicing and
O
Global Journal of Computer Science and Technology Volume XIX Issue III Version I
33 Year 2 019 ( ) C
dicing functionality, MOLAP on a Multidimensional array and CRS on a multidimensional cube to eliminate unnecessary elements. And finally, Compare these three methods of data cube computation according to their execution time. The next portion of this work is the background study discussion; part 3 explains the methodology and implementation phase; part 4 shows result analysis.
II.
Literature Review
As described in [4], Cubes in a data warehouse stored in three different modes. Relational Online Analytical Processing mode or ROLAP is a relational storage model, while a Multidimensional Online Analytical processing mode is called MOLAP. There’s another OLAP named Hybrid Online Analytical Processing mode or HOLAP, where dimensions stored in a combination of the two approaches. One advantage of ROLAP over the other styles of OLAP tools is that it is considered more scalable in handling massive amounts
of data. It sits on top of relational databases, therefore, enabling it to leverage several functionalities that a relational database is capable of. Managing both numeric and textual data is another efficiency of it. Bassiouni M. A. [5] states that ROLAP applications display a slower performance as compared to another style of OLAP tools since, often, calculations performed inside the server. Another demerit of a ROLAP tool is that as it is dependent on the use of SQL for data manipulation, it may not be ideal for the performance of some calculations that are not easily translatable into an
SQL query. However, ROLAP technology tends to have
greater scalability than MOLAP technology. The DSS server of Micro strategy, for example, adopts the ROLAP approaches [6].
The implementation phase of ROLAP uses aggregate functions and GROUP BY operator to return a single value combined with the ROLL UP and get the total value which is similar to the CUBE operator. It is as akin to the following figure 2.1 [7].
Figure 2.1: Group By relational operator with aggregate function SUM () MOLAP is the traditional mode of OLAP analysis
that provides excellent query performance, and the cubes built for fast data retrieval. Since all calculations have been pre-built in data cube creation, the cube cannot be derived from a large volume of data, and it also requires excessive additional investment as cube technology is proprietary and the knowledge base may not exist in the organization as described in [8]. It supports the multidimensional views of data through array-based multidimensional storage engines. They map multidimensional views directly to the data cube
array structures. The advantage of using a data cube is that it allows fast indexing to precomputed summarized data. Notice that with multidimensional data stores, the storage utilization may be low if the data set is sparse. In such cases, exploring sparse matrix compression techniques are a must. Many MOLAP servers adopt a two-level storage representation to handle dense and sparse data sets: dense sub-cubes are identified and stored as array structures, whereas sparse sub-cubes employ compression technology for efficient storage utilization [9].
Global Journal of Computer Science and Technology Volume XIX Issue III Version I
34 Year 2 019 ( ) C
Figure 2.2: MOLAP architecture [10]
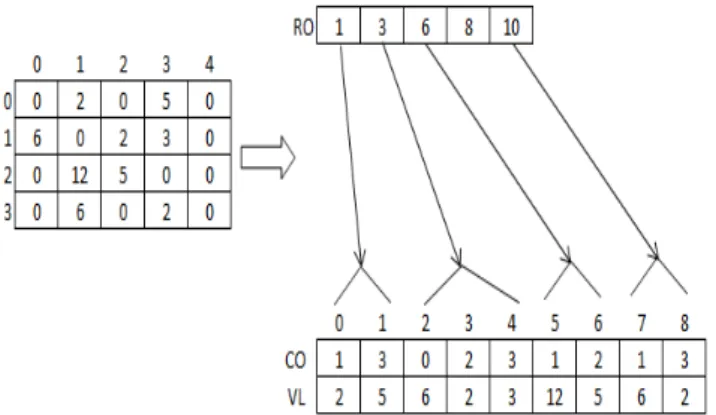
Compressed Row Storage (CRS) widely used due to simplicity and purity, with a weak dependency between array elements in a sparse array. In the proposed method of the CRS scheme in [11], it uses one one-dimensional floating-point array VL and two one-dimensional integer arrays RO and CO to compress all the nonzero elements along the rows of the multidimensional sparse array. The base of these arrays is 0. Array VL stores the values of nonzero array elements. Array RO stores information of nonzero array elements of each row. If the number of rows is k for the array, then RO contains the k+1 element. RO[0] contains 1; RO[1] holds the summation of the number of nonzero elements in row 0 of the array and R [0].In general, RO[i] holds the number of nonzero elements in
(i-1)th row of the array plus the contents of RO[i-1]. The
number of non-zero array elements in the ith row
obtained by subtracting the value of RO[i] from RO[i+1]. Array CO stores the column indices of nonzero array elements of each row. Here’s an example of the CRS scheme for a two-dimensional array.
Figure 2.3: The CRS compressing scheme for sparse
multidimensional array[11]
The Number of the nonzero elementsof row 1
can be found by RO[2]-RO[1] = 3. The column indices
of the nonzero array elements of row 1 stored in CO[RO[1]-1], CO[RO[1]], and CO[RO[1]+1] i.e. CO[2],
CO[3], and CO[4], since there are 3 nonzero array elements exist in row 1. Finally, the values of the nonzero array elements of row 1 can be found in VL[2], VL[3], and VL[4].
III.
Methodology and Implementation
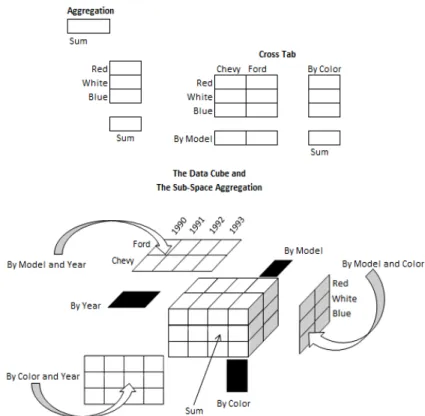
Decision support queries answered in the order of seconds on OLAP servers. So, it is pre-eminent to support highly efficient cube computation techniques, access methods, and query processing techniques for data warehouse systems [12]. In this paper, issues relating to the efficient computation of data cubes have explored. As the implemented static data warehouse has three dimensions (Model (), Year (), Color ()), and one fact table, this would like the following figure with their multidimensional views.Figure 3.1: Lattice of cuboids, making up a 3-D data cube. Each cuboid represents a different group by; base cuboid contains three dimensions Model, Year, and Color.
a) Computing data cube for ROLAP
ROLAP differs significantly from MOLAP in that
it does not require the pre-computation and storage of
information. Alternatively, ROLAP tools access the data
in a relational database throughout generating SQL
queries to calculate information at the appropriate level as an end-user request it. With ROLAP, it is possible to create additional database tables (summary tables or aggregations) that summarize the data at any desired combination of dimensions [13].
For ROLAP, the two sub-problems take on the following specialized forms:
Data cube computation is defined by the
scanning of the original data, employing the required aggregate function to all groupings, and generating relational views with the corresponding cube contents.
Data cube selection is the issue of creating the
subset of the stored data cube views. Selection approaches avoid storing some parts of data cube items in line with certain criteria to create the balance between query latency and cube resource specifications.
Both of these problems studied in the past only in a fragmented fashion [14]. Some works to fill this gap
Global Journal of Computer Science and Technology Volume XIX Issue III Version I
35 Year 2 019 ( ) C
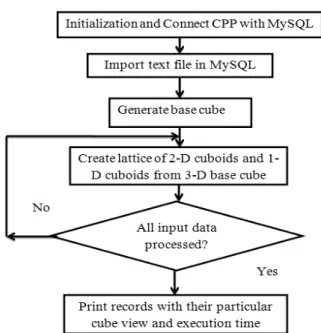
and presents the first systematic analysis of all relevant solutions. But that was only analysis base, here’s the flowchart of our methodology of implementing ROLAP:
Figure 3.2 Flowchart of ROLAP implementation steps The input table and generated cuboid are attached to appendix A.
b) Computing data cube for MOLAP
MOLAP supports the multidimensional view of data through array-based multidimensional storage engines. They map multidimensional views directly to the data cube array structures. Flowchart of the implementation phase of MOLAP is in figure 3.3.
Figure 3.3 Flowchart of MOLAP implementation steps
c) Computing data cube for CRS
The main disadvantage comes from the fact that, in practice, cubes are sparse, with a large number of empty cells, making ROLAP and MOLAP techniques inefficient in storage space. To eliminate those empty cells, CRS is applied here. This row compression changes the physical storage format of the data associated with a data type but not its syntax or semantics. The flowchart of the implementation stages gives the following presentation.
Figure 3.4: Flowchart of CRS implementation steps The implemented view of ROLAP, MOLAP for a sample data set attached in Appendix B. Also, its slice and dice view is created. A very tiny amount of data manipulation is shown only because of reducing lots of paper work. As it has used a very small size of data, the nature of execution time is a little bit biased. In the next chapter, I have presented the graphical representation of ROLAP, MOLAP, and CRS with huge amount of data.
IV.
Result Analysis
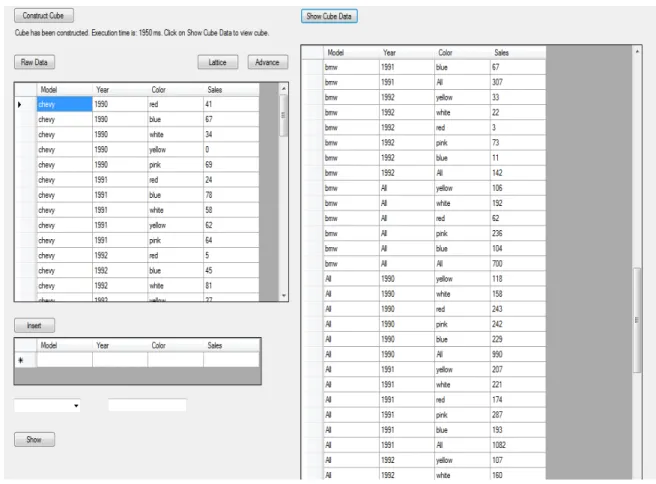
In this experiment, I have used visual C++ and MySQL DBMS platform. A sample input table with a limited size of data and its generated output may look like the following:
Global Journal of Computer Science and Technology Volume XIX Issue III Version I
36 Year 2 019 ( ) C : :
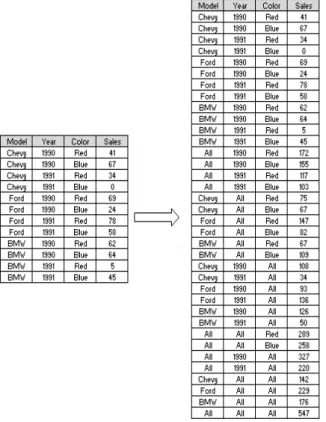
Figure 4.1: Input table and generated cube for ROLAP
a) Base cube comparison
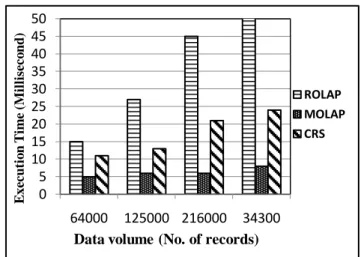
With data volume 64000 records (256KB), 125000 records (500KB), 216000 records (864KB), and 343000 records (1.3MB), a 3-D base cube has been created with their respective execution time according to three schemes, ROLAP, MOLAP, and CRS. These operations provide the following graphical views:
Figure 4.1: Comparison of the 3-D base cube of ROLAP, MOLAP, and CRS
From figure 4.1, the graphical plot of ROLAP gives the highest execution time, MOLAP gives better results compared to ROLAP, but with increasing density ROLAP getting worst, MOLAP takes a longer time where CRS provides a continuous compressed value with a short executing duration. This graphical representation
shows the underlying characteristics of these three methodologies.
b) Dice operation comparison
With the same data volume presented in the previous section, dice operations have been performed to create 2-D cuboids for ROLAP, MOLAP, and CRS. It creates three tables like ‘Model-Year’, ‘Model-Color’, and ‘Year-Color’ (as I use four columns named Model, Year, Color, and Sales showed on figure 4.1). In this section, all the 2-D cuboids of dice operations shown in the separate graphical plot. The following graphical representations give a clear view of the dice operation.
i. Model-Year view
Figure 4.2:Comparison of dice operation (Model-Year) of ROLAP, MOLAP, and CRS
ii. Model-Color view
Figure 4.3: Comparison of dice operation (Model-Color) of ROLAP, MOLAP, and CRS
0 1 2 3 4 5 6 7 8 9 10 64000 125000 216000 34300 ROLAP MOLAP CRS E x e c u ti o n T im e ( S e c o n d )
Data volume (No. of records)
0 10 20 30 40 50 60 70 80 64000 125000 216000 34300 ROLAP MOLAP CRS E x ecu tio n T im e ( Millis eco n d )
Data volume (No. of records)
0 10 20 30 40 50 60 70 80 90 100 64000 125000 216000 34300 ROLAP MOLAP CRS E x ecu tio n T im e ( Millis eco n d )
Data volume (No. of records) Global Journal of Computer Science and Technology Volume XIX Issue III Version I
37 Year 2 019 ( ) C
iii. Year-Color view
Figure 4.4: Comparison of dice operation (Year-Color) of ROLAP, MOLAP, and CRS
Dice operation gives nearly the same result as the base cube view. For a small amount of data, ROLAP gives roughly good outcomes than MOLAP, but with increasing density, it can cause the worst case. CRS always takes very little execution time in comparison with MOLAP and ROLAP.
c) Slice operation comparison
With the same data volume, slice operation has been performed to create 1-D cuboids and take execution time for both ROLAP and MOLAP. It creates three tables like all combinations of models ‘Model’, all combinations of years ‘Year’, and all combinations of colors ‘Color’. In this section, all the 1-D cuboids of slice operations are shown in the separate graphical plot. These operations give a graphical chart shown below:
i. Model view
Figure 4.5: Comparison of slice operation (Model) of ROLAP, MOLAP, and CRS
ii. Year view
Figure 4.6: Comparison of slice operation (Year) of ROLAP, MOLAP, and CRS
iii. Color view
From the graphical view of slice operation, we found that MOLAP gives better results than ROLAP and CRS. It is because of the characteristics of the data, less dimension and also for the nature of the ROLAP scheme as we have implemented CRS through ROLAP.
Figure 4.7: Comparison of slice operation (Color) of ROLAP, MOLAP, and CRS
In this chapter, ROLAP, MOLAP, and CRS implementation have been presented elaborately so that one can easily understand. Experimental results also discussed with the graphical figures. The performances of these three schemes have been measured concerning the execution time and data volume.
V.
Conclusion
The objectives of this work are to implement ROLAP on base data, MOLAP on the multidimensional array, and implement CRS to eliminate empty storage cell. ROLAP has been implemented using a relational database through basic SQL queries; the base data
0 20 40 60 80 100 120 64000 125000 216000 34300 ROLAP MOLAP CRS E x ecu tio n T im e ( Millis eco n d )
Data volume (No. of records)
0 5 10 15 20 25 30 35 40 45 50 64000 125000 216000 34300 ROLAP MOLAP CRS E xe cu ti o n T im e ( Millis eco n d )
Data volume (No. of records)
0 5 10 15 20 25 30 35 40 45 50 64000 125000 216000 34300 ROLAP MOLAP CRS E xe cu ti o n T im e (M il li se co n d )
Data volume (No. of records)
0 5 10 15 20 25 30 35 40 45 50 64000 125000 216000 34300 ROLAP MOLAP CRS E xe cu ti o n T im e (M il li se co n d )
Data volume (No. of records)
Global Journal of Computer Science and Technology Volume XIX Issue III Version I
38 Year 2 019 ( ) C
along with the dimensional table stored in the database and computes different cuboids with different memory allocation. MOLAP does not use the relational database rather than an optimized multidimensional array. CRS is implemented to remove zero values of storage to reduce memory wastage. Then the comparison of these three methods to find out that which gives better performance by the execution time and data density. Generally, MOLAP provides better performance with a small amount of data, if the data volume is high, the cube processing takes a longer time, whereas in ROLAP, data stored in the underlying relational database. ROLAP can handle a huge volume of data. Compressed Row Storage (CRS) on ROLAP to compress the aggregated data then applied. There are some scopes to extend this work in the future. Here, CRS is implemented through ROLAP only. However, in future, CRS can be integrated both with ROLAP and MOLAP, which can provide a more effective analysis of the advantages of applying CRS.
References Références Referencias
1. Online analytical processing (last modified on
9 September 2014) http://en.wikipedia.org/wiki/ Online_analytical_processing.
2. Antoshenkov G. & Ziauddin M. (1996), Query
processing and optimization in oracle RdB, VLDB Journal, 229–237.
3. Buccafurri F., Furfaro F., Sacca D. & Sirangelo C.
(2003), A quad tree based multirole solution approach for compressing data cube, SSDBM 2003, 127-140.
4. Barret R., Berry M., Chan T.F., &Dongara J.,
Eljkhhout V., Pozo R., Romine C. & Van H., (1994). Templates for the solution of linear systems: Building blocks for the iterative methods, second ed. SIAM.
5. Bassiouni M. A., (1985), Data Compression in
Scientific and Statistical Databases, IEEE Transaction on Software Engineering, 1047-1057.
6. Acharya S., Gibbons P. B., AND Poosala V. 2000.
Congressional samples for approximate answering
ofgroup-by queries. In Proceedings of ACM Special
Interest Group on Management of Data (SIGMOD). 487–498.
7. Agarwal, S., Agrawal, R., Deshpande, P., Gupta, A.,
Naughton, J. F., Ramakrishnan, R., And Sarawagi,
S. 1996. On the computation of multidimensional
aggregates. In Proceedings of Very Large Data
Bases (VLDB).506–521.
8. Acharya S., Gibbons P. B., and Poosala V. 2000.
Congressional samples for approximate answering of group-by queries. In Proceedings of ACM Special Interest Group on Management of Data (SIGMOD), 487–498.
9. Relational Online Analytical Processing (ROLAP)
(Copyright © 2010 - 2014 Janalta Interactive Inc) http://www.techopedia.com/definition/14719/relation al-online-analytical-processing-rolap.
10. Gray J., Bosworth A., Layman A., 1996. Data cube:
A relational aggregation operator generalizing group-by, cross-tab, and sub-total. In Proceedings of International Conference on Data Engineering (ICDE), 152–159.
11. K. M. Azharul Hasan, Tatsue Tsuji, Ken Higuchi,
2007. “An efficient implementation for MOLAP basic data structure and its evaluation”, DASFAA 2007, LNCS 4443, 288 – 299.
12. Han J., Pei J., 2001. Efficient computation of iceberg
cubes with complex measures. In Proceedings of ACM Special Interest Group on Management of Data (SIGMOD), 1–12.
13. Liang W., Wang H., & Orlowaska M. E. 2001.
Materialized view selection under the maintenance time constraint, 203–216.
14. Konstantinos Morfonios, University of Athens,
ROLAP Implementations of the Data Cube, ACM Computing Surveys, Vol. 39, No. 4, Article 12, October 2007.
Global Journal of Computer Science and Technology Volume XIX Issue III Version I
39 Year 2 019 ( ) C
A. Input table and generated ROLAP cube
Figure A.1: Input table and computed base 3-D data cuboid for ROLAP
B. A sample input table and comparison of slice-dice
execution time
Table B.1: Table for input data
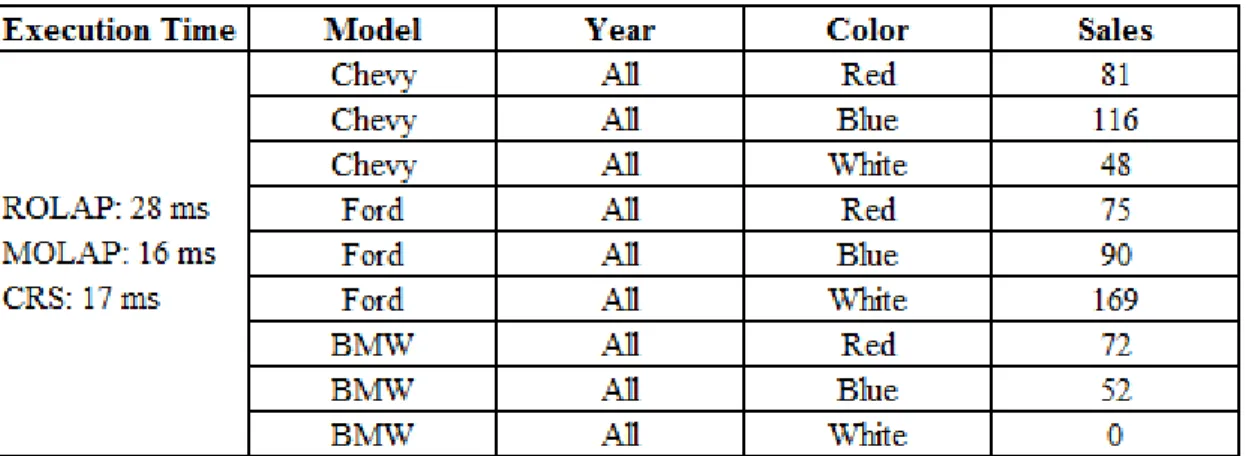
The dice operation produces a sub cube by allowing the analyst to pick specific values of multiple dimensions.
The implemented Dice view of ROLAP, MOLAP and CRS for three Models, two Years and three Colors gives the representation alike:
Global Journal of Computer Science and Technology Volume XIX Issue III Version I
40 Year 2 019 ( ) C
Appendix
Table B.2: Table for Dice operation with Year-Color
Table B.3: Table for Dice operation with Model-Color
Table B.4: Table for Dice operation with Model-Year
Slice is the act of picking a rectangular subset
of a cube by choosing a single value for one of its dimensions, creating a new cube with one fewer dimension.
The implemented Slice view of ROLAP, MOLAP and CRS for three Models, two Years and three Colors gives the representation alike:
Table B.5: Table for Slice operation with Model
Table B.6: Table for Slice operation with Year
Global Journal of Computer Science and Technology Volume XIX Issue III Version I
41 Year 2 019 ( ) C
Table B.7: Table for Slice operation with Color
Table B.8: Table for base cube generation time
Global Journal of Computer Science and Technology Volume XIX Issue III Version I
42 Year 2 019 ( ) C