Wayne State University Dissertations
1-1-2017
Probabilistic Personalized Recommendation
Models For Heterogeneous Social Data
Vineeth Rakesh Mohan
Wayne State University,
Follow this and additional works at:https://digitalcommons.wayne.edu/oa_dissertations Part of theComputer Sciences Commons
This Open Access Dissertation is brought to you for free and open access by DigitalCommons@WayneState. It has been accepted for inclusion in Wayne State University Dissertations by an authorized administrator of DigitalCommons@WayneState.
Recommended Citation
Mohan, Vineeth Rakesh, "Probabilistic Personalized Recommendation Models For Heterogeneous Social Data" (2017).Wayne State University Dissertations. 1847.
by
VINEETH RAKESH MOHAN
DISSERTATION
Submitted to the Graduate School
of Wayne State University,
Detroit, Michigan
in partial fulfillment of the requirements
for the degree of
DOCTOR OF PHILOSOPHY
2017
MAJOR: Computer Engineering
Approved By:
VINEETH RAKESH MOHAN 2017
This dissertation is dedicated to my grandmother Padmavathi Rajamiyer.
I would like to express my sincere gratitude to my advisor Dr. Chandan K. Reddy, a man with extensive knowledge and a remarkable dedication. Throughout my carrier as a Ph.D. student, he was a monumental source of inspiration. As the saying goes, “The only way to discover the limits of the possible is to go beyond them into the impossible”. I was able to challenge the impossible due to his constant guidance and motivations. I could not have imagined having a better advisor and mentor for my Ph.D. study. Besides my advisor, I also thank my co-advisor Dr. Harpreet Singh for his insightful comments, patience and encouragement.
This journey would not have been possible without the support of my parents and my sister. To me, my parents were more than a couple of people who provided moral support; they were tutors, guide, mentors and a beacon of optimism and hope. My father got his doctorate in Mathematics at the age of sixty and taught me the true meaning of perseverance, while my mother taught me the art of patience and humor.
I would like to thank my fellow doctoral students and colleagues Bhanukiran Vizhamuzhi, Ping Wang, Rajiur Rahman, Tian Shi and Yan Li for their feedback and cooperation. A special thanks goes to Bhanukiran Vizhamuzhi for providing several valuable suggestions and Rajiur Rahman for being a great friend and joining me in many photographic road trips. I am also indebted to my friends and students from other labs. I thank Andrey Kashlev, Chuan Li, Erfan Najmi, Khayyam Hashmi, Nariman Ammar, Safraz Rampersaud, Xiaohui Liu, and Yu Chen for sharing their knowledge and time. As my ex-colleague, I must say it was a lot of fun working alongside Xiaohui Liu during my days as a Masters student. I thank him for being an amazing person and a great friend.
Besides my family members, I am also grateful to have wonderful relatives who played a crucial role in my journey as a doctorate student. Especially, I thank my cousin Ramachandran Subramanyam for helping me understand several concepts on programming, my cousin Vidya Rajagopal for being a wonderful and helpful person, my aunt Saraswathi Rajagopal and uncle Dr. Rajagopal Ganapathy for setting an exemplary example. In fact, I lost count of the number of
love and unconditional support.
As rightly said by Amy Pholer, “Find a group of people who challenge and inspire you; spend a lot of time with them, and it will change your life”. I must say, I was extremely lucky to find such inspiring friends who created a positive impact on my life. For this, I thank Abhi Patel, Adeniyi Osisanya, Anusha Mannepalli, Andrew Jones, Jashwanth Reddy, Kadeem Sims, Avinash Phadatare, Nirav Patel, Rahul Gururaj, Ronald Wilson. Specifically, I thank Abhi Patel and Nirav Patel for creating a wonderful home were I was able to shrug-off the stress and work better. I also thank my brother Adeniyi Osisanya for showing the true meaning of dedication and sharing some great workout sessions at the gym. No matter how bad the situation was, I always found him working out at the gym without missing a single day. Thanks to such people, I was able to lead a healthy lifestyle amidst the pressure of research and publication.
Finally, I thank Dr. Abhilash Pandya, Dr. Feng Lin, and Dr. Kazhuhiko Shinki for serving on my committee and providing invaluable feedback.
DEDICATION . . . ii ACKNOWLEDGEMENTS . . . iv LIST OF TABLES . . . ix LIST OF FIGURES . . . x CHAPTER 1 INTRODUCTION . . . 1 1.1 Heterogeneity of Data . . . 2 1.2 Contributions . . . 4 1.3 Organization . . . 6
CHAPTER 2 BACKGROUND ON RECOMMENDATION MODELS . . . 7
2.1 Content Based Recommendation . . . 7
2.2 Recommendation using Collaborative Filtering . . . 9
2.2.1 Memory-Based Techniques . . . 9
2.2.2 Model-Based Techniques . . . 10
2.2.3 Probabilistic Latent Models . . . 14
2.3 Summary . . . 22
CHAPTER 3 LIST RECOMMENDATION IN TWITTER . . . 23
3.1 Introduction . . . 23
3.2 Related Work . . . 25
3.3 Recommending Twitter List using Regression . . . 26
3.4 Recommending Twitter List using PageRank . . . 30
3.5 Experimental Results . . . 33
3.5.1 Dataset Description . . . 33
3.5.2 Automatic Evaluation . . . 34
3.5.3 Empirical Evaluation . . . 38
3.6 Summary . . . 42
CHAPTER 4 RECOMMENDATION IN CROWDFUNDING . . . 44
4.2 Related Work . . . 46
4.3 Characteristics of Kickstarter Campaign . . . 46
4.4 Dataset Description . . . 48
4.5 Analyzing Kickstarter Traits . . . 49
4.5.1 Project based Traits . . . 49
4.5.2 Personal Traits . . . 50
4.5.3 Location based Traits . . . 52
4.5.4 Network based Traits . . . 52
4.6 Recommending Backers . . . 56
4.6.1 Experimental Setup . . . 57
4.6.2 Performance Evaluation . . . 59
4.6.3 Predictive Performance . . . 59
4.6.4 Ranking the Backers . . . 62
4.7 Summary . . . 63
CHAPTER 5 PROBABILISTIC GROUP RECOMMENDATION . . . 65
5.1 Introduction . . . 65
5.2 Related Work . . . 67
5.3 Groups in Crowdfunding . . . 69
5.4 The CROWDREC Model . . . 70
5.4.1 Generative Process . . . 72 5.4.2 Parameter Estimation . . . 74 5.5 Prior Information . . . 77 5.6 Experiments . . . 80 5.6.1 Dataset Description . . . 80 5.6.2 Performance Evaluation . . . 81 5.7 Summary . . . 88 vii
6.1 Introduction . . . 89
6.2 Related Work . . . 91
6.3 Learning Traveler Behavior . . . 93
6.4 The SSTREC Model . . . 95
6.4.1 Generative Process . . . 95
6.4.2 Parameter Estimation . . . 98
6.4.3 Incorporating Prior Information . . . 101
6.5 Creating POI Sequences . . . 101
6.6 Experimental Results . . . 102
6.6.1 Dataset Description . . . 102
6.6.2 Evaluation Metrics . . . 104
6.6.3 Recommending POI Sequences . . . 105
6.6.4 Visual Interface for Travelers . . . 107
6.7 Summary . . . 109
CHAPTER 7 CONCLUSIONS AND FUTURE WORK . . . 110
APPENDIX: LIST OF PUBLICATIONS . . . 113
REFERENCES . . . 114
ABSTRACT . . . 131
AUTOBIOGRAPHICAL STATEMENT . . . 132
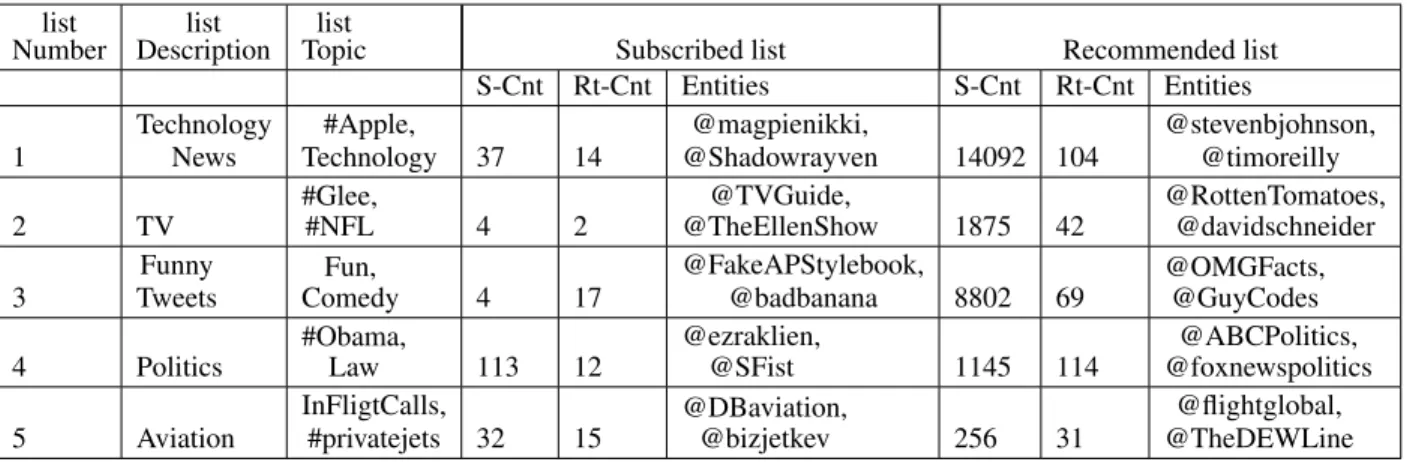
Table 3.1 Comparison of the past and current interest of users generated by dDTM, and the topics generated by LDA without taking the temporal shift of user interests 36 Table 3.2 Performance comparison between different methods using MRR and
Preci-sion metrics . . . 36 Table 3.3 Performance comparison between different methods using Success at k and
DCG metrics . . . 37 Table 3.4 Comparison of quality between subscribed and recommended lists for top topics 40 Table 4.1 Kickstarter data statistics for 18,143 projects collected from Dec 2013 - Jun
2014. . . 48 Table 4.2 Success rate of projects with promotional activities. w/o-promo:
without-promotional activity; w-promo: with without-promotional activity. . . 53 Table 4.3 Cumulative AUC values obtained in the plots shown in Fig. 4.7. . . 62 Table 4.4 Performance comparison between different sets of features using MRR and
Precision metrics. . . 63 Table 4.5 Performance comparison between different sets of features using Success at
kand DCG metrics. . . 63 Table 5.1 List of notations used in this chapter. . . 74 Table 5.2 Statistics of Kickstarter groups formed by frequent and occasional backers. . . 81 Table 5.3 The Average Performance over all datasets using Success @N. . . 84 Table 6.1 List of notations used in this chapter. . . 100 Table 6.2 Statistics of our Foursquare dataset. . . 104
Figure 1.1 Impact of project, personal and social network based features on Kickstarter
users . . . 3
Figure 2.1 Graphical Structure of the Probabilistic Matrix Factorization . . . 14
Figure 2.2 Graphical Model of PLSA: Variant1 . . . 15
Figure 2.3 Graphical Model of PLSA: Variant2 . . . 15
Figure 2.4 Plate notation of the LDA based recommender model . . . 18
Figure 2.5 Plate notation of LDA based recommender model . . . 19
Figure 3.1 Representation of list-network using a subscriber-member relationship . . . . 31
Figure 3.2 Influence oftwitterers’membership count over their list subscription count . . 32
Figure 3.3 Tweeting frequency of frequent and infrequenttwitterersfrom our streaming database . . . 34
Figure 3.4 Number of followees peractive consumer . . . 35
Figure 3.5 Average discounted cumulative gain of related lists for top 20 ranks for dif-ferent algorithms . . . 38
Figure 3.6 Characteristic score of ranked lists for different features . . . 40
Figure 4.1 Characteristics of Kickstarter campaign in terms of goal amount, project cat-egories and backing frequency . . . 47
Figure 4.2 Analysis of features from Kickstarter domain . . . 49
Figure 4.3 Impact of Twitter network on the backers of Kickstarter projects . . . 53
Figure 4.4 Twitter-based community formed by the backers of Kickstarter . . . 55
Figure 4.5 Influence of Twitter-based Kickstarter communities over the backing habits of users. . . 56
Figure 4.6 Influence of Twitter-based Kickstarter communities over the backing habits of users. . . 57
Figure 4.7 The ROC curve results for different backing frequency (BF) values. . . 60
Figure 4.8 Variable importance of various Kickstarter features . . . 62
Figure 5.1 Impact of project, personal, and social network based features on Kickstarter users. . . 66
Figure 5.2 Characteristics of groups in Kickstarter . . . 70 Figure 5.3 Graphical representation of the CrowdRec model. . . 71 Figure 5.4 Decay of user interest with the depletion of popular reward categories. . . 79 Figure 5.5 The precision and recall performance over experienced and occasional
back-ers with Twitter profiles. . . 83 Figure 5.6 The precision and recall performance over experienced and occasional
back-ers without Twitter profiles. . . 84 Figure 5.7 Effect of group sizes of Kickstarter users over the recall performance for all
datasets. . . 85 Figure 5.8 Effect of topics on the DCG measure. . . 86 Figure 5.9 Effect of prior information . . . 87 Figure 6.1 Travel pattern of a tourist who is interested in historical sites and nature. . . . 90 Figure 6.2 Behavior of travelers in terms of topical composition, impact of social circle
and influence of prominent reviewers . . . 94 Figure 6.3 Plate diagram for generative process ofSSTREC. . . 96
Figure 6.4 Performance comparison of SSTREC model in terms of precision and recall . 105 Figure 6.5 Performance comparison of SSTREC model in terms of DCG . . . 107 Figure 6.6 A visual example of travel routes recommended by the SSTREC model. . . . 108
CHAPTER 1:
INTRODUCTION
Content recommendation has risen to a new dimension with the advent of social media plat-forms such as Twitter, Facebook, FriendFeed, Dailybooth, Instagram, etc. Although, this uproar of data provides us with a gold-mine of real-world information, the conventional recommenda-tion models based on collaborative or content-based techniques are not capable of capturing the complex heterogeneous relationship provided by these data sources. The content-based recom-mendation techniques work on a non-relational setting where the association between the entities are ignored. In other words, it assumes that users do not influence each other. Contrary to this notion, collaborative filtering techniques model the relationship between the entities; however, it ignores the content-based features. Therefore, designing a model that is independently based on either collaborative or content-based systems is not sufficient to create a robust recommender framework. For example, consider a scenario of recommending an item to a user in Amazon. To understand the likes and dislikes of this user, one could use his purchase history to obtain features such as frequently purchased categories, spending pattern, wish lists etc. However, it is important to note that the behavior of this user is not restricted to a single platform (in this case Amazon); in-stead, the digital footprints of this user can manifest in the form of social network activities, blogs, web searches and even purchases made in other e-commerce websites. These activities provide us with a plethora of valuable information. For example, information from the user’s Facebook profile can provide insights about the nature of his social circle and the type of pages the user likes and follows. Profile information from Twitter can provide insights on follower, friends and the content information about his Tweets and geo-location information. In addition to the user-based attributes, external domains also provide various product-based attributes such as promotional ac-tivities about the product, attractive product images from Instagram etc. With the availability of such a wide variety of information, it is essential to address the question “how to effectively utilize such high dimensional distribution of attributes?”. The solution to this question lies in addressing the following challenges associated with recommendation systems and the heterogeneity of data.
(1) Sparsity in item selection (explicit feedback or implicit feedback): most users buy few items from a repository containing several thousand items, therefore distribution of items per-user is extremely sparse. In the recommendation literature this problem is widely known as thecold start problem.
(2) Difficulty in clustering similar users:some users have unique tastes and varied buying pat-terns. Such users form a distribution of their own with very little similarity with other users. Therefore, forcefully merging these users with other users will degrade the performance of the recommendation model. This phenomenon is widely known as thegrey sheep problem.
(3) Overcoming the curse of dimensionality to create scalable recommendation
frame-work: having a huge feature space is not always profitable since it becomes extremely
dif-ficult to choose the right set of features that can capture the behavior of users. Additionally, the large feature dimension also affects the scalability of the recommendation models.
(4) Optimizing for Bias and Variance: with a large heterogeneous feature space it is very
much likely for a model to under- or over-fit. Therefore, it is extremely important to create models that have a good balance between bias and variances.
In this thesis, we show various ways in which we can create hybrid recommendation sys-tems. From simple recommendation models involving heuristic combinations of collaborative and content based techniques to more complex systems involving latent probabilistic frameworks that jointly models user’s behavior for greater personalization.
1.1
Heterogeneity of Data
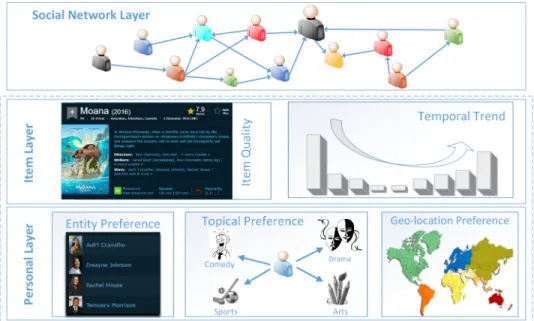
We begin by explaining the intuition behind data heterogeneity in Figure 1.1, which shows the different layers of features that affect a user’s interest in a particular item. In this example, we have chosen the item to be the popular movieMoanaby Disney pictures. This item can vary from physical products such as books, electronics or even digital recommendations such as push notifications in mobile phones and point of interest recommendation. In this Figure, we can see that the user’s interest to pick a movie is influenced by the following attribute layers:
Figure 1.1: Impact of project, personal and social network based features on Kickstarter users
(1) The social network layer: users are socially linked through various social media sites,
which in-turn influences their purchase behavior. For instance, people discuss about movies in Twitter, follow celebrities, retweet and like Twitter posts. Some companies also have dedicated Facebook pages to promote their product and keep users informed about the latest developments.
(2) The item layer:this layer comprises the content quality and thetemporal trendof the movie. The temporal trend can be determined using popularity factors of the item such as box office collection, promotional activities and reviews.
(3) The personal layer: This layer is a combination of the topical preference of the user, the
user’s preference over the cast members of the movie, and the influence of geo-location. The geo-location of users have a strong influence over the selection of items. Nonetheless, this impact is not uniform for all types of items. For example, products such as high end DSLR cameras have a strong demand in USA, UK, France and Germany, while consumer grade cameras are preferred in Asian countries. Similarly, action-based movies such as the Transformers series are highly popular in China, while drama-based movies such asLa La landandMoonlighthave a mediocre response.
From the above explanation, we can see that in web data, features are not confined to a single platform. Therefore, to build a robust recommendation model for a specific domain, it is extremely important to incorporate the heterogeneous linkage between other external domains.
1.2
Contributions
The key contributions of our thesis are summarized in the following topics. In the upcoming sections, each of these topics will be explained in detail.
Recommending Twitter Lists: Lists in social networks have become popular tools to organize
content. In paper [1], we propose a novel framework for recommendingliststo users by combin-ing several features that jointly capture their personal interests. Our contribution is of two-fold. First, we develop a ListRec model that leverages the dynamically varying tweet content, the
network oftwitterersand the popularity of lists to collectively model the users’ preference towards social lists. Second, we use the topical interests of users, and the list network structure to develop a novel network-based model called the LIST-PAGERANK. We use this model to recommend auxil-iary lists that are more popular than the lists that are currently subscribed by the users. We evaluate ourListRecmodel using the Twitter dataset consisting of 2988 direct list subscriptions. Using
automatic evaluation technique, we compare the performance of the ListRec model with
dif-ferent baseline methods and other competing approaches and show that our model delivers better precision in terms of the prediction of the subscribed lists of thetwitterers. Furthermore, we also demonstrate the importance of combining different weighting schemes and their effect on captur-ing users’ interest towards Twitter lists. To evaluate the LIST-PAGERANK model, we employ a user-study based evaluation to show that the model is effective in recommending auxiliary lists that are more authoritative than the lists subscribed by the users.
Analysis of Kickstarter Crowdfunding Domain: Crowdfunding has gained widespread
popu-larity in recent years. By funding entrepreneurs with creative minds, it is gradually taking over the role of venture capitalists who provide the much needed seed capital to jump start business ventures. Despite the huge success of the crowdfunding platforms, not every project is success-ful in reaching its funding goal. Therefore, in [2] we answer the following question “what set
of features determine a project’s success?”. We begin by studying the dynamics of Kickstarter, a popular reward-based crowdfunding platform, and the impact of social networks on this platform. Contrary to previous studies, our analysis is not restricted to project-based features alone; instead, we expand the features into four different categories: temporal traits, personal traits, geo-location traits, and network traits. Using a comprehensive dataset of 18K projects and 116K tweets, we provide several unique insights about these features and their effects on the success of Kickstarter projects. Based on these insights, we build a supervised learning framework to learn a model that can recommend a set of investors to Kickstarter projects. By utilizing features from the first three days of project duration alone, we show that our results are significantly better than the previous studies.
Group Recommendation Models for Crowdfunding: As an extension to the analysis on
Crowd-funding platforms, our recent work [3] proposes a probabilistic recommendation model, called
CrowdRec, that recommends Kickstarter projects to a group of investors. Being a highly heteroge-neous platform, Kickstarter is fueled by a dynamic community of people who constantly interact with each other before investing in projects. Therefore, the decision to invest in a project depends not only on the preference of individuals, but also on the influence of groups that a person be-longs and the on-going status of the projects. The proposed CrowdRec seamlessly incorporates the on-going status of projects, the personal preference of individual members, and the collective preference of the group . Using a comprehensive dataset of over 40K crowdfunding groups and 5K projects, we show that our model is effective in recommending projects to groups of Kickstarter users.
Trip Recommendation in Location-based Social Networks (LBSNS):The pervasive growth of
location-based services such as Foursquare and Yelp has enabled researchers to incorporate better personalization into recommendation models by leveraging the geo-temporal breadcrumbs left by a plethora of travelers. In our research [4], we exploreTravel path recommendation, which is one of the applications of intelligent urban navigation that aims in recommendingsequence of point of interest (POIs) to tourists. Currently, travelers rely on a tedious and time-consuming process of
searching the web, browsing through websites such as Trip Advisor, and reading travel blogs to compile an itinerary. On the other hand, people who do not plan ahead of their trip find it extremely difficult to do this in real-time since there are no automated systems that can provide personalized itinerary for travelers. To tackle this problem, we propose a tour recommendation model that uses a probabilistic generative framework to incorporate user’s categorical preference, influence from their social circle, the dynamic travel transitions (or patterns) and the popularity of venues to recommend sequence of POIs for tourists. Through comprehensive experiments over a rich dataset of travel patterns from Foursquare, we show that our model is capable of outperforming the state-of-the-art probabilistic tour recommendation model by providing contextual and meaningful recommendation for travelers.
1.3
Organization
The rest of this thesis is organized as follows. We begin by surveying the related work on recommendation algorithms in Chapter 2 and delineate our work on ranking tweet content and recommending Twitter List using regression and PageRank models. Chapter 4 will explain the characteristics of the Kickstarter domain and provide various interesting outcomes from the fea-ture analysis of this domain. This chapter will also illustrate a simple hybrid recommendation model based on gradient boosted classifier to recommend backers to Kickstarter projects. The concept of group recommendation will be introduced to the readers in Chapter 5, where we will outline the challenges associated with this form of recommendation and propose our model called CrowdRec and its generative process. Finally, in Chapter 6 we will illustrate the notion of Travel recommendation by providing some statistical insights about the behavior of travelers and propose asocial sequential tour recommendation modelfor travelers.
CHAPTER 2:
BACKGROUND ON RECOMMENDATION MODELS
The main objective of all recommender systems is to obtain a utility function that estimates the preference of a user towards an item. Typically a recommendation system can also be viewed as a ranking engine, which presents users with a summary list of items in some order. The user then interacts with the ranked list to receive more details about the item. Essentially, recommender systems can be divided into two main categories: collaborative filtering methods and content-based methods. Collaborative filtering-content-based techniques utilize the action of users selecting items (i.e. rating, like etc) as input to obtain the similarity between users (or items). Content-based approaches on the other hand, utilize the content information of the items to provide recommenda-tions. This information might include user’s topical interest, item description, age, gender, etc. We begin this chapter by introducing the fundamentals of content and collaborative filtering (CF) tech-niques, where we explain various model- and memory-based methods. In the subsequent sections, we will demonstrate advanced recommender techniques using latent factors models involving ma-trix factorization and probabilistic generative models. In Section,3.3, we delineate our work on developing hybrid recommendation models using ridge-regression and topic-specific PageRank. More specialized models such as Group recommendation, and tour recommendation models will be described in the chapters dedicated for such models.
2.1
Content Based Recommendation
Content-based recommendation system learns the user behavior exclusively from the features of the objects rated by the user. These features can be in the form textual representation of the ob-ject or other meta-data information that exhibits the characteristics of the obob-ject. Irrespective of the characteristics of the object, the first step in building a recommender framework is to pre-process the data to extract these features. This completely depends on whether the data is structured or un-structured. For example, if we are building a recommendation model for suggesting News feeds, the feature extraction stage would involve extracting keywords, n-grams, concepts, sentiments etc. Once the information is extracted, we can represent these items by a vector of attributes. For text-based attributes, the feature space is usually represented as a vector of term weights, where each
weight indicates the degree of association between the item and the term. There are numerous ways to calculate these terms weights, but the most widely used techniques involve the follow-ing concepts: (a)Term-Frequency, which is based on the observation that multiple occurrences of a term in a document are not less relevant than single occurrences and (b) Inverse Document Frequency, which is based on the observation that frequently used terms are less relevant (or im-portant) than rare terms. In paper [5], the authors propose a news recommendation model called
News@hand that makes use of Semantic Web technologies to represent item features. The at-tributes of the news articles are represented as TF-IDF scores in the space of concepts defined in the ontologies. Textual content of items can also take the form of social tags which are keywords generated by the users. For instance, in paper [6], the authors represent the user profile as a tag vector, where the weights indicate the number of times a tag has been assigned to a document; [7] on the other hand, adopt a more sophisticated approach by matching the user-tag co-occurrence usingWORDNET [8]. Besides these classic techniques, plethora of works exists on learning the term weights from the item’s textual content [9–13]. In a recent work Gu et. al. [14] propose a unified method that can simultaneously learn the weights of multiple content matching signals and global term weights. In addition to content based features, other meta-data such as likes, ratings and comments can also be extracted to enhance the feature space. For example, the authors of paper [15] extract publisher, date, ISBN, price, etc., to recommend books for Amazon users using a Naive Bayes classification model. Papers [16, 17] target movie recommendation by learning the synopses extracted from the Internet Movie Database (IMDB). The synopsis of the movies are represented by feature vectors that contain weighting for word with noun tags and noun phrases, where the phrases are weighted according to its importance in the synopsis. Similar to this idea, paper [17] proposes a model calledMovies2GO that learns user preferences from the synopsis of movies rated by the user; however, unlike conventional method of ranking items, this paper uses a novel voting scheme that allows multiple individuals with conflicting preferences to arrive at an acceptable compromise. Content-based systems also adopt the concept of relevance feedback to
refine the recommendation model to incrementally refine queries based on previous search results [18–20].
Recent works on content-based systems include the extracting of stylistic features such as light-ing, color, and motion for video recommendations [21] and developing recommendation models for spoken documents[22]. In [22], the authors develop recommendations for internet audio (i.e. spoken document) by extracting content-based features to characterize non-linguistic aspects of the audio such as speaker, language and gender. Paper [23] on the other hand, combines search and recommendation system that refines the learners from the re-ranking results to enhance the recom-mendation performance and [24] study the impact of content uniqueness for group recommenda-tion systems. For a comprehensive summary of collaborative filtering techniques, the readers are referred to survey articles [25, 26].
2.2
Recommendation using Collaborative Filtering
2.2.1
Memory-Based Techniques
Although content-based techniques are extremely popular and performs reasonably well even with the lack of user ratings, they are limited by the features that are explicitly associated with the objects that they recommend. For example, consider the scenario of recommending a movie
I to two users U1 andU2. Let us assume that the movie is characterized by a set of attributesA. These attributes can be the textual contents of the movies or it’s meta-data information such as plot, description, names of the cast members etc. When recommending, the content-based system assumes that the attribute values of the user U1 is independent from the attribute values of U2, i.e. relationships of the form U1 ×U2 are completely ignored. Collaborative systems (in short CF) on the other hand, rely only on user ratings and can be used to recommend items without any descriptive data. The greatest strength of CF algorithms is that it captures the correlation between the users to make robust recommendations that are more accurate than content-based ones [27]. As explained by the survey [28], this allows the CF algorithms to perform out-of-the box recommendations. For instance, it is possible for a person who likes pop music to also enjoy music from other genres such as classical, jazz, country etc. A content-based recommender system
trained on the features pop albums will not be able to suggest jazz or classical albums since there will be very little overlap of features (i.e., performers, instruments, mood, tempo etc.) between two different genres of music.
In Collaborative filtering, the training dataset is represented as aU×Imatrix withU represent-ing the number of users andI representing the items. The values of this matrix can be the rating provided by the user to the items or implicit binary values indicating the binary actions such as likes and clicks. Memory-based CF algorithms creates a prediction function by utilizing the entire training sample of the user-item database. Usually, the prediction function measures the similarity between the users using some distance measure. The popular ones include neighborhood-based CF algorithm [29], which adopts the following steps to calculate the user-user similarity: (1) cal-culate similarity weightwi,j between two users (or items)iandj, which indicates the correlation between two users (2) find the k most similar users (i.e. neighbors) after computing the similar-ities and (3) aggregate the weighted similarity scores of the neighbors to rank the unseen items and recommend the top-N items to the user. One of the earliest and the most popular research on memory-based CF techniques can be seen from paper [30] that proposes a recommendation system for the retail bookseller Barnes and Noble and [31] that proposes a recommendation system for the e-commerce websiteAmazon.com.
2.2.2
Model-Based Techniques
Although simple to implement and interpret, memory-based CF techniques come with several limitations. First, similarity between two users are based directly on the commonly rated/selected items and therefore these methods become unreliable when the data is sparse. Second, memory-based techniques require the entire data to calculate the user similarity, which makes these algo-rithms extremely slow, thus hampering the scalability. To overcome this issue, researchers pro-posed models that work by factorizing the user-item matrix to a lower dimension called latent-factors. The preference of users towards items is then calculated based on this latent dimension to perform recommendation. These methods can also be viewed as dimensionality reduction tech-niques that utilizes algorithms such asSingular Value Decomposition[32],Principal Component
Analysis(PCA) [33]. Nonetheless, from a recommendation context, the most popular latent-factor models span from two areas of research namely: (a) Matrix-factorization (MF) [34, 35] and (b) Probabilistic latent factor (PMF) models. First, we briefly explain the rationale behind MF techniques and then provide details about PMF models, which is the main focus of this thesis.
Matrix Factorization for CF:the key assumption made by any form of latent-factor model is that
a large user-item matrixU×I (usuallyI >> U) can be reduced to a low-dimensional latent space of two individual componentsθu ∈RK andφi ∈RK of users and items respectively, where where
K << I. The rating of a userutowards an itemiis then estimated using the following function:
ˆ
rui=θuTφi (2.1)
In the above equation ˆrui is the estimated rating of an item iby the user u, this equation is also termed as thehypothesis function. The classic paper on MF for recommendation was proposed by Korean et. al. [34]. In this paper, the cost function between the estimated and the actual rating is formulated as follows:
C = X
u,i∈observed ratings
(rui−θTuφi) +λ( X u kθuk2+ X i kφik2) (2.2)
where rui is actual set of observed rating (i.e. ground truth), θT ·φ is the estimated rating, and
λis the regularization parameter that penalizes the L2-normskθuk2 kφik2 in-order to avoid over-fitting. The objective is to minimize the cost function w.r.t to the parameters φ and θ, which is performed using a technique calledalternating least squares(ALS). The steps to perform ALS is briefly described as follows:
• Fix the user parameterθand solve the quadratic function for item parameterφji.
• Once item parameters are estimated, use this updated set of item factors to estimate user parameterθj
u.
• Repeat step 1 and 2 until convergence.
Although equation 2.2 can be solved using techniques such as stochastic gradient descent (SGD), ALS is a better algorithm due to the following reasons. First, by holding the user or
item parameter constant, equation 2.2 essentially becomes a convex function and hence the mini-mization should converge at some point. Second, unlike SGD, by holding θfixed and estimating
φ(or vise versa), ALS allows faster convergence since the algorithm finds the absolute minimum at each step and does not take small steps in the downward direction of the slope. The formulation of the cost function in equation 2.2 can also be extended to incorporate user and item biases to capture the uncertainty in the rating system. For example, consider two users A and B who like an item I. In a rating system that allows users to rate items on a scale of 1-5, let us assume that user A gives a rating of 5 for the item, while B provides a rating of 3. This does not mean, user B dislikes the item. It simply means user B is more critical than A. On the contrary, it could also mean that user A is more lenient in rating. Therefore, in-order to accommodate such user biases, we can reformulate the cost function as follows:
C = X
u,i∈observed ratings
(rui−θuTφi) +λ( X u (kθuk2+b2u) + X i (kφik2+c2i)) (2.3)
In addition to the above formulation, another popular variant of the MF-based recommender system modifies the hypothesis function forimplicit feedback data. Not all recommender systems are rating-based; in fact, most of the web-data is associated with implicit feedback where users expresse their preference towards items using hidden actions such as clicks, page scrolls, likes and wish lists. In other words, a userneed not exclusively buy an item or rate an item to express his/her interest. To model such implicit feedback Hu et al., [35] introduce a boolean factor pui ∼ θTuφi, wherepui is a binary value that is determined based on the level of interaction between the user and the item. For instance,pu,i can be 1 if the user likes or adds an item to his wish list. The cost function for this implicit MF formulation is defined as follows:
Cimp =
X
u,i∈observed ratings
δui(rui−θuTφi) +λ( X u kθuk2+ X i kφik2) (2.4)
whereδui := 1 +λruiis the confidence inpui, which penalizes the cost function for incorrect prediction. So far, we provided an overview of the matrix factorization techniques for
recommen-dation. For a detailed understanding of MF algorithms, readers can refer the recent works such as [36–38] and [39].
Probabilistic Matrix Factorization: As explained earlier, the primary focus of this thesis is
to tackle the challenges of recommendation systems from the perspective of probabilistic latent models. Therefore, we begin by introducing one of the earliest works on generative latent fac-tor modelsfor recommendation [40]. Although this model was originally projected as a variant of matrix factorization technique, the formulation is much closer to a class of models known as
probabilistic graphical models (PGMs). Probabilistic graphical model is a vast area of research; nonetheless, our research is confined to a sub-class of PGMs known asGenerative models for Di-rected Acyclic Graphs. For a detailed understanding of probabilistic graphical models the readers are suggested to survey the book by Koller et al. [41]. The generative model of PMF is shown in Figure 2.1, where the nodes represent random variables,V represents an item, U represents a user and the plate notations imply a set ofM items andN users. Relationship between the random variables are represented as directed edges. The generative process is explained as follows:
• For each useru, draw a user latent factor:θu ∼ N(0, λ−θ1IK) • For each itemi, draw item latent factor: βi ∼ N(0, λ−φ1)IK)
• For each user-item pair(u, i), draw a rating (or feedback): rui ∼ N(θuTφi, c−ui1)
Parameters θ and φ are estimated using a maximum a posteriori (MAP) estimate. Similar to the above formulation, cui represents the confidence on the response rui. Our research work essentially focuses on such generative models, wherean action is explained using a set of random variables connected via directed edges. More specifically, we focus on a class of generative models called thetopic models. We begin by explaining a primitive topic model calledprobabilistic latent semantic analysis (PLSA) for recommendation. We then gradually add more complexity to this model to explain the popular document-topic model calledlatent dirichlet allocation(LDA) in the upcoming sections.
Figure 2.1: Graphical Structure of the Probabilistic Matrix Factorization
2.2.3
Probabilistic Latent Models
In this section, we will be discussion two important models (a) Probabilistic Latent Semantic Analysis and (b) Latent Dirichlet Allocation. These two models will serve as the foundation for our work in the later chapters.
Probabilistic Latent Semantic Analysis (PLSA) for Recommendation: The probabilistic latent
semantic analysis is a generative model, which laid the foundation for the research on topic models. Although there are several variations of the PLSA algorithm, the very first model was proposed by Hoffman et al., [42] for document and word clustering. The authors extended the same framework for collaborative filtering in paper [43]. The PLSA framework is also called as theaspect model
and the traditional way of estimating the parameters is to use the expectation maximization (EM) algorithm. The graphical structure of PLSA is shown in Figure 2.2, where U denotes the set of users{uj}Uj=1andI denotes the set of items{im}Im=1. The variableZis basically the latent factor of the model. With the graphical structure and the notations defined, the generative process of PLSA can be explained as follows:
U
Z
I
P(U) P(Z|U) P(I|Z)
Figure 2.2: Graphical Model of PLSA: Variant1
U
Z
I
P(U) P(Z|U) P(I|Z)
U
Z
I
P(U|Z) P(Z) P(I|Z)Figure 2.3: Graphical Model of PLSA: Variant2
• Based on thisz, the user then selects an itemi.
The central assumption of the model is that users choose items based on some hidden interestsz
and the goal is to infer these hidden interests. The generative model shown in Figure 2.3 is similar to 2.2; except, the graphical model is re-structured to fit the d-separation property which states that once the latent interest of the userz is known, the selection of itemiis independent of the useru. The central inferential problem of PLSA is to estimate the posterior probability given by:
p(z|u, i) = p(z, u, i) p(u, i) = p(u)p(z|u)p(i|z) P Z p(u)p(z|u)p(i|z) (2.5)
We can ignore the normalization factor in the above equation and proceed by finding the log-likelihood of the numerator. The probability of a user u choosing an item i can be obtained by marginalizing over the variablezas follows:
p(u, i) = X Z p(z, u, i) =X Z p(u)p(z|u)p(i|z) (2.6)
Since we haveU users andIitems, the complete likelihood for the dataset is defined as follows:
D=Y
U Y
I
p(u, i)n(u,i) (2.7)
wheren(u, i)is the number of times a useru picked an itemi. Taking the log of the likelihood function we obtain the following equation:
L=X U X I n(u, i)log(u, i) (2.8a) =X U X I n(u, i) log [X Z p(u)p(z|u)p(i|z)] (2.8b)
Since, in our case, variablez is latent, explicitly finding the maximum likelihood estimates of the parameters is hard. Therefore, we maximize the expected value of the log-likelihood as follows:
E(L) =X U X I n(u, i)X Z logp(u)p(z|u)p(i|z) =X U X I n(u, i)Q(z)X Z
logp(u) + logp(z|u) + logp(i|z) (2.9)
where the Q-functionQ(z)is generally set to the posteriorp(z|u, i). In the E-step we obtain this posterior probability and for the M-step we maximize the modified version of the log-likelihood that is obtained by introducing lagrange multipliers as follows:
H =E(L) +α[1−X U p(u)] +βX U [1−X Z p(u|z)] +γX I [1−X Z p(i|z)] (2.10)
The Lagrange Multipliers α, β, and γ can be obtained by taking the partial derivatives of the equation (2.10) w.r.t p(u),p(u|z), and p(i|z). When simplified the parameters p(u),p(u|z), and
p(i|z)equates to the following expressions: p(u) = P I P Z n(u, i)p(z|i, u) P U P I P Z n(u, i)p(z|i, u) (2.11a) p(i|z) = P Un(u, i)p(z|i, u) P I P Un(u, i)p(z|i, u) (2.11b) p(z|u) = P In(u, i)p(z|i, u) P Z P In(u, i)p(z|i, u) (2.11c)
Using the above set of equation, the EM algorithm is defined as follows:
1. Initialization:Begin by randomly initializing the parametersp(u),p(u|z), andp(i|z). 2. E step: Estimate the posteriorp(z|u, i)using Equation 2.5.
3. M step: Use the newly calculated posterior from Step 2 to recalculate the parameters using
expressions 2.11(a-c).
4. RepeatSteps 2 and 3until convergence.
Latent Dirichlet Allocation (LDA): A Recommendation Perspective: Proposed by Blei et al.,
[44], LDA is the most popular topic model for document and word clustering. Although the gen-erative model of the document-topic generation is very similar to PLSA, LDA introduces Dirichlet priors that smooths the topic mixture in individual documents and the word distribution, thus al-leviating the overfitting problem of PLSA. In this section, we provide the details of the LDA and derive the collapsed Gibbs Sampling process to infer the parameters. Instead of explaining LDA from a document-word perspective, we explain it from a recommendation perspective where docu-ments are users and words are the items selected by these users. To explain the generative process, we provide a toy example in Figure 2.4, which illustrates the decision making process of a useruto watch a moviev. Since this is just an illustrative example, we have just four movies and genres (or topics); in reality, the topic and movie space can be extremely large. The following steps delineate the generative process of the model:
• Each useruhas multiple topical interests (in our example, genres). Therefore, he can choose items (in our example, movies)vfrom various genres. In Figure 2.4, the useruis interested
incomedy, horror, dramaandactiongenres. The user’s interest over the set of genres follow a dirichlet distributionθ ∼Dirichlet(α)with hyper-parameterα.
• From distribution of genresθ, the user then chooses asingle genre z using a multinomial over the distributionθu.
• After selecting a genre z, u then picks a movie v from the genre-movie distribution ma-trix φ ∼ Dirichlet(η) with hyper-parameter η. The movie is drawn using a multinomial distribution over the distributionφ.
However, in reality, we do not observe the user’s distribution of interest θ, which implies we do not observez, which in-turn means that we do not observe the movie-topic distribution either. The only observed variables are the users and the items. Therefore, the central inferential problem of LDA is to estimateθandφfrom the observed variablesN (movies) andU (users).
Figure 2.4: Plate notation of the LDA based recommender model
The formal representation of the LDA’s generative framework is depicted in Figure 2.5. The posterior for the model is defined as follows:
p(θ, φ, z|w, α, β) = p(θ, φ, z, w|α, β) p(θ, φ, z, w|α, β) (2.12a) = p(θ, φ, z, w|α, β) p(w|α, β) (2.12b)
|U| |Z|
Figure 2.5: Plate notation of LDA based recommender model
Based on the generative model, the likelihood can be expanded into the following expression:
p(θ, φ, z, i|α, β) =p(i|z, φ)p(z|θ)p(θ|α)p(φ|η) (2.13a)
More precisely, for asingle userthe likelihood is defined by:
p(θu, φ, zu, vu|α, β) = Nu Y
n=1
p(v|φzu,n)p(zu,n|θu)p(θu|α)p(φ|η) (2.14a)
where N is the number of movies and Nu denotes the movies chosen by the user u. Unfortu-nately, the denominator (i.e. the marginalizing constant) of the equation 2.12a is intractable to compute. Therefore, we use an approximate inference technique called Gibbs sampling to obtain the posterior of LDA. The following paragraph describes derivation of Gibbs sampler for LDA.
Collapsed Gibbs Sampling: It is important to note that although we need to obtain the complete
likelihoodp(θ, φ, z|w, α, β) in the equation 2.12a, this expression can be collapsed by excluding
θ and φ. This is because, once we infer zi, which is the topic assignment for each item {vi}Ni=1, it is sufficient to calculate the user-topic distribution θ and item-topic distribution φ. Hence, the
collapsed posteriorof the Gibbs sampler is written as follows:
p(z|v, α, β) =
p(z, v|α, β)
p(w|α, β) (2.15)
According to the Gibbs sampling procedure, when sampling a topic z for an item v, we assume that all other topic assignments for items other than v are known. Applying this rule to equation
2.15, we obtain the following posterior:
p(zi|Z¬i, α, β, v, N) =
p(zi, Z¬i, v, N|α, β)
p(z¬i, v, N|α, β) (2.16)
∝p(Z, N|α, β) (2.17)
where, Z¬i indicates the set of topic assignments for all movies expect movievi. Now, using the graphical model, the numerator can be expanded as follows:
p(Z, N|α, β) = p(N|Z, β) | {z } (A) ·p(Z|α) | {z } (B) (2.18)
Part (A) of the above expression is expanded into the following components:
p(V|Z, β) =
Z
p(V|Z, φ)·p(φ|β)dφ (2.19)
In equation (2.19), p(φ|β) follows a dirichlet distribution and p(V|Z, φ) follows a multinomial distribution defined by:
p(φ|β) = K Y k=1 1 ∆(β) N Y v=1 φβv−1 k,v (2.20a) p(V|Z, φ) = K Y k=1 N Y v=1 φψk,v k,v (2.20b)
here ψkv is a count matrix indicating the number of times item v is assigned to the topic k, and
∆(β)is the gamma function defined as follows:
∆(β) = Q|β| i=1Γ(βi) Γ(Pβi i=1βi) (2.21)
Substituting equations (2.20a) and (2.20b) in eqation (2.19) we obtain the following expression: p(V|Z, β) = Z K Y k=1 1 ∆(β) N Y v=1 φβv−1 k,v K Y k=1 N Y v=1 φψk,v k,v dφk (2.22a) = K Y k=1 1 ∆(β) Z V Y v=1 φψk,v+βv−1 k,v dφk (2.22b) = ∆(ψk+β) ∆(β) (2.22c)
Where equation (2.22c) is obtained using the propertyR Q|v=1α| pxv+αv−1
v dp= ∆(x+α). Deriving part (B) of equation (2.18) in the similar fashion yields the following expression:
p(Z|α) =
∆(Ωu+α)
∆(α) (2.23)
whereΩu is the count indicating the number of times a useruis assigned to topicz. Finally, we can obtainp(Z, N|α, β)using expressions (2.22c) and (2.23) as follows:
p(Z, N|α, β) = K Y k=1 ∆(ψk+β) ∆(β) · U Y u=1 ∆(Ωu+α) ∆(α) (2.24)
As mentioned earlier, since the posterior cannot be estimated directly, we use the following Gibbs update rule:
p(zi|N, Z¬i, α, β) =
p(Z, N|α, β)
p(Z¬i, N¬i|α, β) (2.25)
The numerator of the above expression was derived in equation (2.24). The denominator of this expression is defined by:
p(Z¬i, N¬i|α, β) = K Y k=1 ∆(ψk¬i+β) ∆(β) · U Y u=1 ∆(Ω¬ui+α) ∆(α) (2.26)
Substituting equations (2.23) and (2.26) we can obtain equation (2.25) as follows: p(zi =k|Z¬i, N, v, α, β) = ∆(ψk+β) ∆(ψ¬i k +β) · ∆(Ωu+α) ∆(Ω¬i u +α) = Γ(ψk,v+βv) Γ(PNv=1ψk,v+βv) · Γ(Ωd,k+αk) Γ(PKk=1Ωu,k +αk) Γ(ψ¬i k,v+βv) Γ(PNv=1ψ¬i k,v+βv) · Γ(Ω¬i u,k +αk) Γ(PKk=1Ω¬i u,k +αk) (2.27a)
Therefore, given a user u and a item i, the probability of assigning a topic z to the tuple (u, i)
is then obtained by simplifying the Gamma functions in expression (2.27a). The final posterior expression is defined by:
p(zi =k|Z¬i, v, N¬i, α, β) = (Ω¬u,zi +αz)· ψ¬i z,v+βv PV v=1ψz,v¬i +βv (2.28)
It should be noted that, in this draft, we donot furnish all the nity grity details of the Gibbs sampling derivation of LDA. For complete details about the derivation, readers are suggested to survey the draft onparameter estimation for text analysis[45].
2.3
Summary
In this chapter, we provided a complete overview of the popular techniques in the field of Recommender systems. First, we furnished the research works on content-based recommendation which learns the user behavior exclusively from the features of the objects rated by the user. We then explained the flaws in this technique, and introduced the concept of collaborative filtering. The explanation about CF algorithms were split into (a) memory-based techniques and (b) model-based techniques. and the problems associated with memory-model-based techniques such as scalability and sparsity were delineated. Finally, we introduced probabilistic latent-factor models and ex-plained the details of two important algorithms PLSA and LDA that will serve as the basics for understanding the upcoming chapters.
CHAPTER 3:
LIST RECOMMENDATION IN TWITTER
3.1
Introduction
The increase in web contents in the form of social media websites, blogs, and news articles have resulted in the problem of information overload. Researchers have tackled the problem of information overload from different perspectives such as organizing trending topics in user’s time-line, URL recommendations for twitterers, recommending followers and tweets [46–49]. A new direction of research that is proposed in this chapter is the development of personalized recom-mendation based onsocial lists. Lists serve a dual purpose in various social networks. First, they serve as a newsletter or a daily-digest for users who seek unified source of information. Second, they act as topical-hubs that unite users who share similar interests. Originally lists were intro-duced by Twitter in 2009; however, they have been adopted by various social networking websites in different forms under different names. For instance, Google+ terms lists as social circlesand Facebook provides a feature calledcommunity pages. In general, every list has a curator who cre-ates the list and makes it as private or public. Other users can freely subscribe to such public lists, while private lists are restricted to the owner’s approval. Lists are one of the strongest indicators of topical homophily [50]. Consequently, they can be an excellent tool to smoothen the problem of information overload.
Recommending lists is a challenging task because most users create them for grouping friends or other users whom they find interesting. Such lists that are created for personal convenience do not gain the attention of people. This implies that most of them do not have any subscribers. Furthermore, list names are not unique; there can be thousands of lists with similar (or even same) names [51]. This further exacerbates the problem of finding genuine, authoritative and topically relevant set of lists. In this chapter, we propose two recommendation models that recommend lists for Twitter users based on their personalized interest. Our first model, called theListRec,
captures and models the users’ interest based on a combination of content, network and trendiness based measures. For users with rich tweet history, we measure their interests using the topics de-rived from their tweets. Unlike the existing studies, we view thetwitterer’sinterest as a temporally varying feature and exploit this variation using an exhaustive set of streaming tweets to
dynami-cally model the users’ interest. For users with sparse tweet history, we project the user space into a followee space and utilize the followee’s list subscriptions to indirectly measure the interest of the users. We also add a new trend based score that measures the popularity of lists in the Twitter domain. The final score is then modeled as a linear combination of these three individual scores (based on content, network, and popularity) to effectively measure the interests of the users and personalize list recommendation. The coefficients in this linear combination are estimated using a cyclic ridge regression estimation approach. Our experimental results show that the ListRec
outperforms other competing state of the art methods. Our second model is the LIST-PAGERANK
which will recommend lists that are popular and are more (topically) authoritative than the lists that are currently subscribed by the users. To the best of our knowledge, there are no studies that use Twitter lists for personalized recommendation. We summarize the major contributions of this chapter as follows:
a. We propose a recommendation framework calledListRec that recommends Twitter lists
based on the personalized interest oftwitterers. Unlike the existing studies that recommend external information like news articles and blogs, our work is purely domain-specific. b. The interests of users are modeled using a combination of weighting schemes: (a) a
con-tent based scheme that models the users’ interest based on temporally varying topics; (b) a network based scheme that uses the followee-network of the users to overcome the tweet sparsity; and (c) a trendiness based scheme that is based on the popularity of the lists. c. We propose a LIST-PAGERANK based algorithm that leverages the network structure of
Twitter lists to recommend authoritative lists that match the topical interest of the users. The rest of this chapter is organized as follows. We begin by describing the modeling of
ListRec in Section 3.3. Section 3.4 describes the creation of the list network and formulation
of the LIST-PAGERANK. Section 6.6 will show the results of our experiments and explain the data collection methodology. Section 3.2 discusses the related work on this topic. Finally, the conclusions obtained through this study are presented in Section 3.6.
3.2
Related Work
Over the past few years, researchers have proposed various methods to overcome the problem of information overload in social networks. These studies can be classified into three main cate-gories: (a) reorganization of user timeline in microblogs, (b) topic modelling, and (c) personalized recommendation.
Reorganization of user timeline: The research on timeline reorganization aims to re-rank the
timeline of users in microblogging network like Twitter. Feng et al. [52] build a feature-aware fac-torization model that uses the graph containing nodes in the form of users, publishers and tweets. They build their model based on the notion that the tweet history reveals user’s personal preference. Bernstein et al. [46] adopt a topic based technique for organizing twitter feeds. In their work, the tweets are transformed into queries for external search engine. The popular terms are then assigned as topics. Burgess et al. use Twitter lists to tackle the problem of timeline reorganization. Since lists implicitly denote the topical interests oftwitterers, they propose a system calledButterworth
that can automatically build twitter lists by leveraging user’s social network and the content gen-erated by friends. Our work is different from the ones mentioned above since it uses a novellist based PageRank algorithm. None of these works mention about the topic of list recommendation which forms a core part of our work.
Topic modelingThe use of topic models in microblogging has been extensively studied by many
authors. Ramage et al. [53] presents a scalable implementation of labeled LDA. Phan et al. [54] use the LDA topic model for building short and sparse text classifiers. [47] propose a URL recom-mendation system for Twitter users. According to the authors, the topics in Twitter are presented by different concepts that change over time. The concepts are built using a linguistic model that detects entities and mentions from users’ tweets. Our topic modeling method uses the notion of dynamic temporal LDA which is not captured by the methods mentioned above.
User RecommendationUnlike timeline reorganization that restricts itself to the ranking of tweets, the user recommendation tackles the information overload problem by providing users with con-tents or users that are relevant to the user’s interest. In [55], a URL recommendation system for
twitter users is proposed which aims to recommend URLs by constructing a vector-of-words from users’ tweets to measure their interest. In our previous work [56], we developed a model that recommends geo-location based tweet summaries. Analyzing the tweet’s content and social graph for recommending friends and followers have been studied by various researchers [57], [48], [49]. There are very few studies that exploit the list feature in Twitter [58, 59]. In their studies, [58] rank the tweets within the subscribed lists of users rather than recommending existing lists. In short, their work is similar to the ranking of user’s timeline and hence it is quite different from our work. The models proposed in our work are similar to the ones described in [60] and [61]. However, unlike these works, our paper leverages on the Twitterlistsand temporal interest of users to design a new recommendation system.
3.3
Recommending Twitter List using Regression
In this study, we classify the Twitter users into two categories: the persistent twitterers, and the
active consumers. Persistent twitterersare users who tweet frequently and consistently. Therefore, they tend to have a rich tweet history. On the other hand,active consumersare characterized by a sparse tweet history, but they actively consume information from Twitter by following other users. Our aim is to develop a list recommender system that can be effective for both these categories of users. For this reason, we use a combination of users’ tweet history (when available), and their network of followees to collectively measure their personalized interest.
List-preference based on varying topical interests: The topical interest of twitterers changes
with time. For example, consider the following set of tweets tweeted by atwitterer over a period of 1 year.
1. Love my #iphone 4s and its retina screen simply colorful and vibrant. #iphoneRocks - March 2012
2. #Apple versus #Samsung this is interesting. I think #iphone has lost it’s charm - December 2012
3. Finally sold my #iphone4s and got a #GalaxyS4 simply loving the big screen!. Can’t wait to explore the new #Android - June 2013
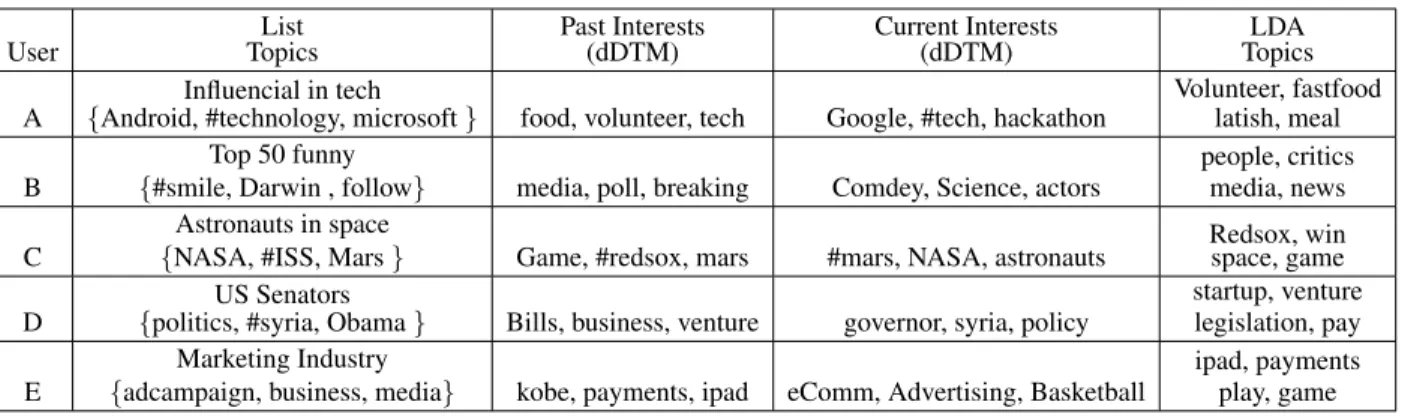
We can clearly see the transition of the user’s interest from iphone to Galaxy S4 mobile. This also means that recommending lists related to iphone might not be interesting to this user. Therefore, we model the interest of twitterers as a temporally varying factor by using the discrete dynamic topic model (dDTM) [62] to create atemporal topic-preference matrixthat captures the inclination of the users towards a set of topics at different time frames. Unlike LDA [44], the dDTM sees the order of collection as an evolving set of topics. The dDTM uses a state space model on the natural parameters of the multinomial distributions that represent the topics. The alignment among topics across time steps is captured by a Kalman filter. The inferior performance of topic models over short text documents is a well known problem that has been widely studied in the literature [63]. To overcome this problem, we use tweet pooling technique [64] to collect all the tweets tweeted by these users, and use their history of tweets as input to the dDTM. For the set of usersU in our database, we run the dDTM over their tweet history to obtain the set of topicsT at different time framestf. We then use these topics as an intermediate plane to formulate acontent-listmatrix that maps the topical interests of thetwitterersto the set of listsL. We explain this mapping using the following set of matrices:
• User-topic matrix J: The topical interest of twitterers J for a time frame tf is |U | × |T | matrix, where the valueU Tij denotes the number of times a word intwittereru’s tweet has been assigned to the topicτjT.
• Topic-List matrix M:The topic-List matrix defines a relation between the set of lists and the topics that are spanned by these lists. We create this matrix by collecting the set of tweets that emerge from every listlL, and use the dDTM to generate a set of topics. The topic-List matrix is represented asM =|T | × |L|.
The interest oftwittererstowards the lists is a|U | × |L|matrix that is obtained as follows:
F
=J·M (3.1)Network based List-preference: For users with low tweeting frequency (i.e. the active
set of lists {l1, ..., ln} in L. First, we obtain the set of followees F for users in U to create a
user-followeematrix given by
E =|U | × |F| (3.2)
Second, the user’s interest towards his followees is measured based on the number of times a userui retweeted his followeefj. The adjacency matrixE is defined as follows:
Eij =
RT(i, j)
P
f∈F
RT(i, f) (3.3)
whereRT(i, j)is the number of times the useriretweeted his followeej, andP
RT(i, f)is the total number of retweets by the useri(normalization factor).
Third, the list subscriptions of followees in the setF is retrieved to create afollowee-listmatrix |F| × |L|given by Jij = 1ifisubsribes to listj 0otherwise (3.4)
Finally, we obtain thenetwork-listmatrix|U | × |L|as follows:
∆=E·J (3.5)
List-preference based on Trending List: A list can be considered trending in Twitter if the
hashtags produced by this list are popular at a specific time t. Therefore, for every list in the set
L, we retrieve the hashtags that emerge from their respective tweets to create a hashtag-List matrix given by
K =|H| × |L| (3.6)
We then determine the trending lists by estimating the popularity of hashtags in the set H at a specific timetin the ordered Twitter streamsD1, . . .Dn. Each Twitter streamDiis a set of ordered
n-tuples represented as {< hi1, ti1 >, . . . , < him, tim >} where hi is the hashtag and ti is it’s corresponding publishing time. Kwak et al. [65] showed that the topics in Twitter become popular for a certain period of time and gradually die. This encourages us to use a time-decay function to
estimate the trending hashtags [66]. The numeric weight of hashtagsH in the Twitter streamD
at any given time is a function of the elapsed time since the first occurrence of this hashtag. The common way to model such functions is using an exponential-decay. Mathematically, we denote the function as follows:
W(h) = X
<hi,ti>D
β
[tnow−ti]
T (3.7)
where the parameterβ(0,1]controls the weight of the hashtags;tnowdenotes the current time, and
T sets the granularity of time-sensitivity. In this work, we give equal importance to every hashtag at the beginning by setting β to 1. The trendiness of hashtags h H is measured by estimating
ˆ
W(h)using first order derivative of their cumulative counts. The trending-List matrix is given by
Ω =H ·K (3.8)
whereHis a row matrix that contains the estimated weights for the hashtagsH.
Recommendation score of Twitter List: The recommendation of Twitter listsLfor a set of users
{u1, ..., un}given their tweet historyZu and followeesFuis represented as a linear combination of their topic based weightage
F
, their network based score∆, and the score based on list trendinessΩ. Formally, we denote the preference score by
P(u, l) = α
F
+β∆+γΩ (3.9)Ridge regression for list recommendation: We now describe the algorithm to estimateα, βand
γ for the preference score (3.9). The ridge regression algorithm is used as a solver for estimation at each step of Algorithm 1. The regularization function used here is theL2norm of the regression coefficient vector. We now explain the major steps involved in this estimation algorithm.
In the first step, β and γ are initialized using a fitting heuristic. In this fitting heuristic, we estimateβinit by selecting a randomly sampled subset of data, and fitting it to the response vector
∆. The size of this sample is set of 30% of the original data. Similarlyγinitis also estimated using this 30% fitting heuristic. The values ofβinitandγinitare used in Equation (3.9) to formulate the
Algorithm 1:Cyclic Approximate Ridge Regression for List Recommendation
Input: Binary response vectorP, Topic List matrixF, Network List Matrix∆, Trending List MatrixΩ
1: Initializeβ=βinitandγ=γinit 2: P0 =P −∆βinit−Ωγinit 3: UsingP0 andF estimateαf inal
4: SetP0 =P −F αf inal−∆βinit
5: UsingP0 andΩestimateγf inalas in Step 3 6: SetP0 =P −F αf inal−Ωγf inal
7: UsingP0 and∆estimateβf inalas in Step 3 8: Outputαf inal,βf inalandγf inal.
regression problem to estimateαf inal. This cycle of estimation is continued in the remaining steps to estimate the values ofβf inal andγf inalas explained in Algorithm 1. This final set of coefficient values are used for estimating the scores.
3.4
Recommending Twitter List using PageRank
In our previous work [1], we proposed a LIST-PAGERANK model that can recommend aux-iliary set of lists that are authoritative and topically similar to the lists that are subscribed by the
twitterers. We begin this section by explaining the construction of the list network. We define the set of Twitter lists as a tuple Lc <C,M,J,S>, where C denotes the curator of the list; M is the set of list members; J is the set of topical words, and S is the set of subscribers. A directed graphD(V, E)is formed with lists as the vertexV of the network. Defining edges in Twitter lists can be tricky. This is because, unlike user-follower relationship in Twitter, an explicit relationship between lists does not exist. Therefore, in this section, we exploit the hidden structure of Twitter lists to define their linkage. We say that, an edge between two lists existsif the member of a list is a subscriber of another list. Figure 3.1 shows this notion using three list nodes. In this figure, the user C who is a member of list 3 subscribes to another list 2; thus, establishing a linkage between these lists. Similarly, user G, a member of list 2 subscribes to list 3.
With the list network defined, we now explain the meaning of authority in Twitter list. The definition of authority is based on the following observations:
• Lists containing influential twitterers have the potential to attract many subscribers. The subscription count in turn makes the list authoritative.
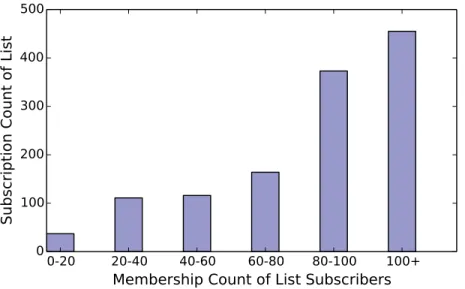
This notion is similar to the real-life event of news paper subscription. Top circulated news papers likeThe Wall Street JournalandThe New York Timesattract more subscribers because the content produced by them are relevant and exhaustive; more importantly, they are written by prominent reporters and journalists. The influence of a twitterer can be measured by his list membership count. For example, the user C in Figure 3.1 is a member of two lists: list 1 and list 3. Now, the authority score of the list 2 goes up due to the presence of this influential member.
Members Subscribers A A BB CC D D EE Members Subscribers X X GG C C RR C Subscribes to 1/3 * sim(List1,Lis t2) Members Subscribers R R CC R , C Subscribes to 2/2 * sim(List3,List2) F F GG G Subscrib es to 1/2 * sim( List2,List3) List 1 List 2 List 3
Figure 3.1: Representation of list-network using a subscriber-member relationship
We show this effect in Figure 3.1 by plotting the membership count of users against the scriber count of their list subscription. We see that, as the membership count increases, the sub-scriber count also increases. The increase in subsub-scriber count becomes more pronounced when the membership count goes beyond 80. This clearly shows that the subscription of users with high list membership results in attracting more subscribers; thereby, making the list more dominant. Our goal is to recommend auxiliary set of lists that are not only authoritative, but also topically similar to the lists that are subscribed by thetwitterers. We now explain the creation oflist-topicmatrixJ