Boston University
OpenBU http://open.bu.edu
Theses & Dissertations Boston University Theses & Dissertations
2017
Learning and adaptation in brain
machine interfaces
https://hdl.handle.net/2144/20794 Boston University
Dissertation
LEARNING AND ADAPTATION IN BRAIN MACHINE INTERFACES
by
SPENCER BRADLEY TORENE B.A., University of Maryland, 2004
Submitted in partial fulfillment of the requirements for the degree of
Doctor of Philosophy 2017
© 2017
SPENCER BRADLEY TORENE All rights reserved
First Reader _________________________________________________________ Jason T. Ritt, Ph.D.
Assistant Professor of Biomedical Engineering
Second Reader _________________________________________________________
Frank H. Guenther, Ph.D.
Professor of Speech, Language & Hearing Sciences and Biomedical Engineering
Third Reader _________________________________________________________
Timothy J. Gardner, Ph.D.
Humanty Doomanty perched on a wall,
Humanty Doomanty had a great fall,
All of the circuits and all of the mem
Took humanity’s place from them.
v
DEDICATION
I would like to dedicate this work to my patient spouse Becca, my wonderful children Elliot and Simon, and my dog Sam.
vi
ACKNOWLEDGMENTS
While I owe many thanks to many people, those singled out here deserve more than mere gratitude. Unfortunately for them, gratitude is the currency at present. First, thanks to my advisors, Jason and Frank, for guiding me through the third stage of learning how to think. I thank them for their scientific insight and wisdom, which has proven and will continue to prove invaluable. Thanks to Frank for bringing perspective and reason, and to Jason for consistently steering me towards better ways of answering questions. Thanks to my wife Rebecca for inspiring me to go back to graduate school, and who took Elliot to the trampoline park and numerous other locations while 8 months pregnant with Simon so I could write this dissertation. I would also like to thank Kayle Sawyer and EmilyKate McDonough, who told me to just use everything now and edit later, actually starting me on this daunting document. Thanks to my committee, Tim Gardner and Mark Kramer for bearing with me, and Chris Moore for providing extremely useful and encouraging comments on Chapter 2. Finally, many thanks to Shelley Russek and Sandi Grasso for having my back. They are the best.
vii
LEARNING AND ADAPTATION IN BRAIN MACHINE INTERFACES
SPENCER BRADLEY TORENE Boston University School of Medicine, 2017
Major Professor: Jason T. Ritt, Ph.D., Assistant Professor of Biomedical Engineering ABSTRACT
Balancing subject learning and decoder adaptation is central to increasing brain
machine interface (BMI) performance. We addressed these complementary aspects in
two studies: (1) a learning study, in which mice modulated “beta” band activity to control a 1D auditory cursor, and (2) an adaptive decoding study, in which a simple recurrent
artificial neural network (RNN) decoded intended saccade targets of monkeys.
In the learning study, three mice successfully increased beta band power
following trial initiations, and specifically increased beta burst durations from 157 ms to 182 ms, likely contributing to performance. Though the task did not explicitly require specific movements, all three mice appeared to modulate beta activity via active motor control and had consistent vibrissal motor cortex multiunit activity and local field potential relationships with contralateral whisker pad electromyograms. The increased burst durations may therefore by a direct result of increased motor activity. These findings suggest that only a subset of beta rhythm phenomenology can be volitionally modulated (e.g. the tonic “hold” beta), therefore limiting the possible set of successful beta neuromodulation strategies.
viii
In the adaptive decoding study, RNNs decoded delay period activity in
oculomotor and working memory regions while monkeys performed a delayed saccade task. Adaptive decoding sessions began with brain-controlled trials using pre-trained RNN models, in contrast to static decoding sessions in which 300-500 initial eye-controlled training trials were performed. Closed loop RNN decoding performance was lower than predicted by offline simulations. More consistent delay period activity and saccade paths across trials were associated with higher decoding performance. Despite the advantage of consistency, one monkey’s delay period activity patterns changed over the first week of adaptive decoding, and the other monkey’s saccades were more erratic during adaptive decoding than during static decoding sessions. It is possible that the altered session paradigm eliminating eye-controlled training trials led to either frustration or exploratory learning, causing the neural and behavioral changes.
Considering neural control and decoder adaptation of BMIs in these studies, future work should improve the “two-learner” subject-decoder system by better modeling the interaction between underlying brain states (and possibly their modulation) and the neural signatures representing desired outcomes.
ix TABLE OF CONTENTS DEDICATION ... v ACKNOWLEDGMENTS ... vi ABSTRACT ... vii TABLE OF CONTENTS ... ix
LIST OF TABLES ... xiv
LIST OF FIGURES ... xv
LIST OF ABBREVIATIONS ... xix
CHAPTER ONE: Learning and Adaptation in Brain Machine Interfaces ... 1
Introduction ... 1
Subject Learning of BMI Control (Chapter Two) ... 2
BMI Decoder Adaptation (Chapter Three) ... 4
Common Themes ... 6
CHAPTER TWO: Neural and behavioral correlates of learning a beta band neurofeedback task... 8 Abstract ... 8 Introduction ... 10 Methods... 15 Overview ... 15 Subjects ... 15
x
Behavioral Task ... 16
Microelectrode Arrays and Implantation ... 18
Histology ... 19 Neural Recordings ... 20 Recording Sessions ... 20 Decoding Features ... 21 BPR Threshold Determination ... 23 Neurofeedback ... 24 MUA Activity ... 25 Burst Analysis ... 26 Results ... 27
Mice Learn the Neuromodulation Task ... 27
Bursts Underlie Beta Band Neuromodulation ... 34
Beta band neuromodulation is achieved through active motor control ... 41
Discussion ... 47
Tonic “Hold” Motor Output Driven by vM1 ... 48
Increases of Beta Burst Durations ... 50
Controllable Beta vs. Automatic Beta ... 51
Relationship to Previous Studies ... 52
Specific Implementation of Experiment ... 53
xi
CHAPTER THREE: Neural and behavioral strategies during adaptive decoding of a
delayed saccade task ... 57
Introduction ... 57
Methods... 60
Overview ... 60
Subjects ... 60
Behavioral Task ... 61
Data Collection and Decoding Features ... 63
RNN Overview ... 64
Adaptation Strategy ... 65
Offline Training Paradigm ... 66
Closed Loop Training Paradigm ... 70
Reconstruction of 80-475 Hz Power ... 70
Results ... 71
Offline Performance... 71
Closed Loop Decoding Performance ... 80
Neural Correlates of Closed Loop Performance ... 87
Behavioral Correlates of Closed Loop Performance ... 94
Reconstruction of 80-475 Hz Power ... 108
Discussion ... 115
CHAPTER FOUR: Integrating Learning and Adaptation ... 123
xii
The “Two-Learner” System ... 129
APPENDIX ... 134
Learning Study Supplemental Information ... 134
Histology ... 134
“Bad” Electrodes ... 136
Mouse Motivation After Recent Water Deprivation ... 137
BPR-Auditory Tone Transformation ... 138
MUA Quality Control ... 139
Video Analysis ... 142
Electrode Correlations ... 145
FA/TP Latency within Sessions ... 146
Trial Progressions Over Sessions... 151
Mouse Response to Auditory Feedback ... 152
Behavioral Correlates... 156
LFP-EMG Correlations ... 158
LFP-EMG Coherence Phase ... 159
MUA-EMG Phase Preference... 160
EMG-EMG Coherence Changes... 161
Burst Durations vs. Amplitudes ... 162
Adaptation Study Supplemental Information ... 163
Batch Model Learning Parameters... 163
xiii Generalization Techniques ... 163 Saccade Behavior ... 166 Reconstruction of 80-475 Hz Power ... 167 BIBLIOGRAPHY ... 169 CURRICULUM VITAE ... 188
xiv
LIST OF TABLES
Table 1: Batch learning parameter values ... 163 Table 2: Online learning parameter values ... 163
xv
LIST OF FIGURES
Figure 1: Description of Experiment ... 17
Figure 2: Raw LFP examples ... 30
Figure 3: Beta band power increased over sessions... 32
Figure 4: Task performance increases are due to neuromodulation success and not due to reward seeking strategies ... 33
Figure 5: Beta band range bursts underlie beta band power increases ... 37
Figure 6: Beta range burst durations increased over sessions ... 39
Figure 7: Beta band neuromodulation is an active process driven by vM1 ... 44
Figure 8: Burst results compared to previous descriptions ... 56
Figure 9: Delayed saccade task ... 62
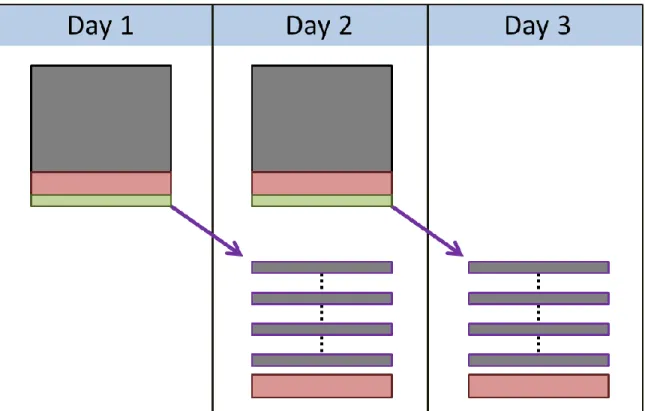
Figure 10: Offline model adaptation sequence ... 69
Figure 11: RNN generalization improves batch model validation rate ... 74
Figure 12: RNN generalization improves batch model test rate ... 75
Figure 13: Online adaptation performance increases in offline simulations ... 75
Figure 14: Better performing batch models have better online performance ... 76
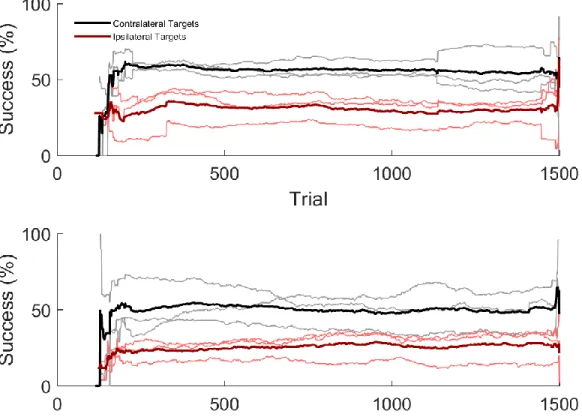
Figure 15: Higher contralateral than ipsilateral decoding performance ... 78
Figure 16: RNN weights consistent with related findings ... 79
Figure 17: Closed loop RNN performance worse than offline and closed loop LDA ... 82
Figure 18: Higher contralateral than ipsilateral decoding performance ... 83
Figure 19: Higher online contralateral than ipsilateral performance ... 84
xvi
Figure 21: Monkey J performance not due to within-session adaptation ... 86
Figure 22: Monkey C neural activity patterns change ... 89
Figure 23: Monkey J neural activity patterns are stable ... 90
Figure 24: Performance related to neural similarity to previous sessions ... 91
Figure 25: Better performance with consistent inter-session neural activity ... 92
Figure 26: Decoding performance of ipsilateral targets changes together ... 93
Figure 27: Individual behavioral strategies for eye vs. brain control ... 98
Figure 28: Individual behavioral strategies for static vs. adaptive sessions ... 100
Figure 29: Monkey J changes behavioral strategy under brain control ... 101
Figure 30: Incorrect decoding responses associated with less stereotyped saccades ... 103
Figure 31: Saccade stereotypy positively associated with correct RNN decoding ... 104
Figure 32: Positive performance-stereotypy association specific to RNN decoding ... 105
Figure 33: Monkey J has more fixation errors during adaptive sessions ... 106
Figure 34: Fixation break rate inversely correlated with decoding performance ... 107
Figure 35: Reconstruction models did not overfit data ... 112
Figure 36: Good 80-475 Hz reconstruction accuracy ... 113
Figure 37: 1 – 2 Hz LFP power consistently a large factor in 80-475 Hz power ... 114
Figure 38: Mouse A histology ... 134
Figure 39: Mouse B histology... 135
Figure 40: "Bad" electrodes ... 136
Figure 41: Low motivation for reward within 24 hours of deprivation ... 137
xvii
Figure 43: Mean MUA shape grouped by FWHM ... 139
Figure 44: MUA-coincidences based on chance ... 140
Figure 45: Mean MUA shape grouped by coincidences ... 141
Figure 46: Mean quality-controlled MUA shapes ... 142
Figure 47: Video frame alignment across sessions ... 144
Figure 48: Electrode correlations around BPR threshold ... 145
Figure 49: FA/TP latency for mouse A... 146
Figure 50: FA/TP latency for mouse B ... 147
Figure 51: FA/TP latency for mouse C ... 148
Figure 52: Behavioral Index increase not due to behavior ... 149
Figure 53: Distribution of TPs, FAs, and TOs within sessions ... 151
Figure 54: Mouse C seeks reward ~400 – 600 ms after reward tone ... 152
Figure 55: Auditory feedback frequency is possibly informative ... 153
Figure 56: Little or no dependence on feedback frequency for reward seeking ... 154
Figure 57: Increased EMG associated with trial success ... 156
Figure 58: Mouse position at trial initiation predictive of outcome ... 157
Figure 59: Low EMG-LFP correlation ... 158
Figure 60: Increased contralateral EMG-LFP coherence around reward availability .... 159
Figure 61: MUA-triggered EMG traces show protraction phase preference ... 160
Figure 62: EMG-EMG coherence decreases around reward threshold ... 161
Figure 63: Burst duration vs. session-normalized power... 162
xviii
Figure 65: Most initial saccade activity complete by ~350 ms ... 166 Figure 66: Reconstruction bias weights for monkey C are large ... 167 Figure 67: Reconstruction bias weights for monkey J are large ... 168
xix
LIST OF ABBREVIATIONS
AAC ... Amplitude-Amplitude Coupling BI... Behavior Index BMI ... Brain Machine Interface BPR ... Beta Power Ratio CFC ... Cross Frequency Coupling dlPFC ... Dorsolateral Prefrontal Cortex EEG ...Electroencephalogram EMG ... Electromyogram ERD... Event Related Desynchronization ERS ... Event Related Synchronization FA ... False Alarm FEF ...Frontal Eye Field FWHM ... Full-Width Half-Max ISI ... Inter-Spike Interval ITI ... Inter-Trial Interval LDA ... Linear Discriminant Analysis LFP ... Local Field Potential MUA ... Multi-unit Activity PAC ... Phase-Amplitude Coupling RMSE ... Root Mean Square Error RNN ...Simple Recurrent Neural Network
xx
SEF ... Supplementary Eye Field SMR ... Sensorimotor Rhythm TP ... True Positive vM1 ... Vibrissal Motor Cortex
CHAPTER ONE: Learning and Adaptation in Brain Machine Interfaces
Introduction
Brain-machine interfaces (BMIs) are a proposed technology to provide mobility
and independence to paralyzed and “locked-in” patients. However, a major limitation to the viability of BMIs as a medical treatment is low performance. Two fundamental and complementary components of BMI performance are the subject’s ability to learn to use the decoder, and the decoder’s adaptation to changes in the subject’s neural activity. We investigated both aspects in this dissertation and report on the following: (1) a BMI learning study in which mice controlled an auditory neurofeedback cursor, and (2) an adaptive BMI study in which a decoder was updated online as monkeys performed a delayed saccade task. Through this work we may better understand the distinct, but connected, roles of subject learning and decoder adaptation to create recommendations for higher BMI performance.
The learning study focused on an important prerequisite of motor control: the decision to move in the first place. Patients may need “asynchronous” BMIs that determine when subjects want to be in rest or motor execution states, in contrast to common “synchronous” BMIs, which assume subjects intend to move during experimenter defined control periods. We established whether the beta sensorimotor
2
asynchronous control signal by training mice to increase beta SMR power in response to auditory neurofeedback.
The adaptive study arose from an ongoing saccade BMI study (Brincat et al., 2013b). A BMI that detects the direction of intended saccades could be extremely useful to locked-in patients, who generally have difficulty moving their eyes. Previously employed static decoders required hundreds of training trials each day, placing a large burden on the subjects. As a possible improvement, we implemented an adaptive
recursive artificial neural network (RNN) that could reduce the need for training, and
improve decoding performance over trials. Although preliminary offline simulations suggested good performance was possible, the closed loop RNN was lower performing than both the preliminary offline results and the closed loop static LDA decoder. We assessed whether changes in monkey behavior or internal cognitive factors drove poor performance.
Subject Learning of BMI Control (Chapter Two)
Non-adaptive BMI studies, in which the decoder is fixed, allow subjects to achieve high levels of BMI skill (Ganguly and Carmena, 2009). Important work has looked at the ability of individual neurons to modulate activity and tuning properties in BMI tasks (Fetz, 1969; Jarosiewicz et al., 2008; Ganguly et al., 2011; Chase et al., 2012; Koralek et al., 2012; Clancy et al., 2014). However important these studies are, relying on unit activity to decode motor intent may not be suitable over long term timescales, due to gliosis or electrode degradation (Chestek et al., 2011; Prasad et al., 2012). The viability
of using LFPs—rather than unit activity—as a decoding signal should be investigated, due to the robustness of LFP decoding over the life of the electrode (Chao et al., 2010; Flint et al., 2013). Furthermore, LFPs have been shown to contain more information than unit activity about behavioral state when fewer than 20 electrodes are available
(Scherberger et al., 2005; Bansal et al., 2012; Flint et al., 2012). Many studies have looked at the capability of subjects to modulate various LFP bands or SMRs (Wyrwicka and Sterman, 1968; Wolpaw and McFarland, 2004; Bai et al., 2008; Hwang and
Andersen, 2009; Pfurtscheller et al., 2010; Engelhard et al., 2013; Rouse et al., 2013; Wander et al., 2013), but fewer have been devoted to understanding the learning process through which volitional LFP modulation takes place, including relevant behavioral observations (Rouse et al., 2013; Orsborn et al., 2014; So et al., 2014).
The ability of subjects to learn how to use decoders is a vital component of successful BMI systems, and our understanding of this process with LFPs is no less
important. The motor cortex beta sensorimotor rhythm (SMR) is a good candidate for
volitional modulation in motor BMIs, as a classic neural signature of sensorimotor activity (Sanes and Donoghue, 1993; Murthy and Fetz, 1996) that appears prominently in the entire cortical-basal ganglia loop (Cassidy et al., 2002; Kühn et al., 2004). The beta SMR has been successfully modulated in electroencephalography BMIs (Wolpaw and McFarland, 2004; Naros and Gharabaghi, 2015), but EEG cannot provide low level detail of the beta SMR modulation learning process. Up-regulation of the beta SMR is a more robust phenomenon than the beta ERD during both actual and imagined movement (Leeb et al., 2007; Bai et al., 2008; Pfurtscheller and Solis-Escalante, 2009; Pfurtscheller et al.,
4
2010; Solis-Escalante et al., 2010) and does not require overt movement (Pfurtscheller et al., 2005). Furthermore, down-regulation of neural activity appears to be harder than up-regulation, in general (Rouse et al., 2013; Clancy et al., 2014).
We trained mice to increase beta band power in the vibrissal motor cortex to receive water reward. Mice increased the rate of water rewards received per session through successful neuromodulation, and not through a successful behavioral strategy. It appears that the neuromodulation may have been accomplished through the extension of low frequency (alpha and beta) burst durations and was accompanied by particular EMG signatures.
BMI Decoder Adaptation (Chapter Three)
Adaptive BMI studies have shown that performance can improve with adaptation (Orsborn et al., 2014), and trajectory precision drops as soon as adaptation ceases and the decoder is fixed (Orsborn et al., 2012; Flint et al., 2013). Fixed decoders might allow performance to stagnate (Bishop et al., 2014), unless only a small portion of the most stable neurons are utilized (Ganguly and Carmena, 2009). Unfortunately, the recording quality of units do not always remain stable or consistent (Chestek et al., 2011; Prasad et al., 2012) and the information and performance that can be extracted from neural
recordings decreases with reduced numbers of neurons (Wessberg et al., 2000; Carmena et al., 2003; Ganguly and Carmena, 2009). Performance could be better if adaptive decoding methods are used that minimize instability in neural recordings over time.
Therefore, increasing the cost-benefit ratio of intracortical implants will likely require decoder adaptation.
Even when decoders have good offline performance, their parameters change drastically after subject learning (Orsborn et al., 2012). Studies that recalibrate their decoders on a daily basis show high variability in performance (Taylor et al., 2002; Carmena et al., 2003; Gilja et al., 2012); it would be better to create decoders that had more consistent, high initial performance. Adaptation must be performed with caution, as even small changes in parameter weights can be highly detrimental to performance (Ganguly and Carmena, 2009). The timescale of adaptation has been researched before, from only one batch update (Gilja et al., 2012) to updates at every time step (Shpigelman et al., 2008; Vidaurre et al., 2011) to intermediate time scale updates (Orsborn et al., 2012). Whether it is desirable to use frequent or infrequent updating may depend on how much learning you can expect subjects to achieve, or on the quality of the implants. There is some debate as to whether effective learning can occur with frequent parameter
updates (Li et al., 2011; Orsborn et al., 2014), although it appears that fixed or more slowly adapting decoders allow more refined movements to develop (Danziger et al., 2009), as well as biomimetic decoders as a starting point (Sadtler et al., 2014). Learning tends to occur as demand dictates—that is, units that have improper assignments of preferred direction tend to shift those preferred directions, and units that are weighted more heavily increase their modulation depth (Orsborn et al., 2014). While there is some debate as to what the best adaptation paradigm is (DiGiovanna et al., 2009; Li et al., 2011; Gilja et al., 2012; Orsborn et al., 2012; Dangi et al., 2014; Marsh et al., 2015), it
6
appears clear that gradual modifications of biomimetic decoders are most intuitively learnable by subjects (Danziger et al., 2009; Sadtler et al., 2014). To this end, we trained
a simple recurrent artificial neural network (RNN) with several generalization techniques
on previously recorded data as a starting point for further adaptation of a delayed saccade BMI.
Performance of the closed loop adaptive RNN was worse than both the offline RNN adaptation and a closed loop static LDA decoder. We suspect the poor adaptive performance during the delayed saccade task was due to changes in the monkeys’
strategies and motivation at the loss of initial eye control trials, and is not consistent with poor decoder adaptation parameters.
Common Themes
There are two common themes in these studies: (1) the use of LFPs as decoding features, and (2) the study of motor intention and behavior.
LFPs at the opposite ends of the neural spectrum were used as features to decode different types of motor intention and activities on different timescales. In the learning study we looked at how low frequency LFPs (13-30 Hz) can be volitionally modulated over several seconds to inform decoders of an overall, broad subject motor state. In the adaptation study we looked at how high frequency LFPs (80-500 Hz) within a brief, time-limited delay period can be decoded into dynamic motor activity. Furthermore, in the adaptive work, we briefly attempted to extract additional neural information by modeling the relationship between the low and high frequency LFP bands. The diversity of
processes for which various LFP frequency bands may inform decoders (Fontolan et al., 2014; Bundy et al., 2016; Gao, 2016; Michalareas et al., 2016) is illustrated in these works as potential surrogates of missing spiking activity.
Another common theme is the study of motor intention. In the learning study we used beta SMR frequencies as a “switch” for the intent to move and found that there was a direct connection between motor cortical activity and EMG activity. This connection was possibly a strategy or an outcome of learning the specific task requirement to generate high beta power. In the adaptation study we decoded delay period working memory to guess the directional intention of upcoming eye movements, the success of which was related to the stereotypy of post-delay saccades. In both studies we report on task-related motor behavior, which is not often reported in great detail in motor BMI studies, despite its obvious and important relationship to neural modulation in motor cortical areas.
8
CHAPTER TWO: Neural and behavioral correlates of learning a beta band neurofeedback task
Abstract
Motor brain machine interface (BMI) studies often assume the subject’s intention to move during rigidly structured trials and do not consider “rest” periods. Medical translation of motor BMIs to patient populations relies on successful asynchronous control, in which the patient is able to exert choice about when to control a BMI and when not to. We investigated the possibility of asynchronous control through a beta sensorimotor (SMR) rhythm brain “switch” in a neuromodulation task.
Three mice successfully modulated vibrissal motor cortex (vM1) beta band power to control a 1D auditory cursor. Task performance was due to neuromodulation success and not to advantageous reward seeking responses. Reward threshold rates increased and latencies decreased, occurring soon after trial initiation. Task-related beta SMR activity consisted of bursting events, in agreement with several recent studies. Paralleling the neuromodulation learning was an increase in beta burst durations from 157 ms to 182 ms, suggesting they contributed to performance. Increased whisker pad electromyograms (EMG), and consistent multiunit activity and local field potential phase relationships between vM1 and contralateral EMG during task-related periods, indicate beta power modulation occurred during active motor control. Though the task did not explicitly
require specific movements, the consistency of the vM1-EMG relationships across all three mice suggest the increased burst durations may therefore be a direct result of increased motor activity durations. Further, the vM1-EMG phase coherence increased around reward threshold, at frequencies in the high beta range that are higher than normal mouse whisking frequencies are reported to be, suggesting a tonic “hold” beta was
employed by all three mice to solve the neuromodulation task.
The similarity with which mice solved the neuromodulation task suggests that only a subset of beta rhythm phenomenology can be volitionally modulated (e.g. the tonic “hold” beta), in this case through intentional extension of motor processes resembling a “hold”. If true, the possible set of successful beta neuromodulation strategies would therefore be limited. While we showed the feasibility of a brain “switch” for
asynchronous BMI control, future neuromodulation studies should consider the underlying mechanisms of control, even within a particular rhythm.
10
Introduction
Brain-machine interfaces (BMIs) have shown remarkable progress in the last 15 years
(Taylor et al., 2002; Carmena et al., 2003; Guenther et al., 2009; Gilja et al., 2012), and continued progress could one day help paralyzed patients regain lost motor function (Collinger et al., 2013). However, almost all BMI studies use a paradigm of rigidly structured trials that disregard the motor state of the patient, assuming that a patient intends to move only if a trial is ongoing (“synchronous BMI”). While structured experiments have proven helpful to the progress BMI technology has made, translating the resulting decoders into real world applications would have limited benefits if the subject cannot exert choice over when to control the BMI and when not to (“rest periods”; e.g. when sleeping, reading, or conversing). Many BMI decoders show significant drift during rest periods (Chao et al., 2010), as the processing of decoding neural activity never ceases and BMIs interpret slight movement even when there is no intention to move. The inability of BMI decoders to distinguish between motor
preparation and execution can further interrupt natural motor dynamics and force
accommodations from the BMI subject (Canolty et al., 2012). Before motor BMIs can be translated from the laboratory, it is critical that they be able to determine the neural state of a subject to avoid improperly decoding non-existent motor commands (Ryu and Shenoy, 2009). Only when BMIs are usable outside of a rigid trial structure
(“asynchronous BMI”), will their full potential as medical devices be realized (Hochberg et al., 2012).
Unit activity has been used to detect changes in motor state (Achtman et al., 2007; Kaufman et al., 2014; Velliste et al., 2014), but long term unit activity is less stable than local field potentials (Chao et al., 2010; Chestek et al., 2011; Prasad et al., 2012; Flint et al., 2013). Further, LFPs contain more information than unit activity about behavioral state when few electrodes are available for recording (Bansal et al., 2012; Flint et al., 2012), potentially due to a more consistent relationship between LFPs and states (Pesaran et al., 2002; Scherberger et al., 2005; Hwang and Andersen, 2009). LFP-based motor state detection has previously been demonstrated (Mason and Birch, 2000; Bai et al., 2008; Fatourechi et al., 2008; Wang et al., 2012; Williams et al., 2013), and a potential LFP feature that has successfully been modulated in BMIs is the beta rhythm (Wolpaw and McFarland, 2004).
The beta rhythm is a classic neural signature of sensorimotor activity (Sanes and
Donoghue, 1993; Murthy and Fetz, 1996) that appears prominently in the entire cortical-basal ganglia loop (Cassidy et al., 2002; Kühn et al., 2004) and could be a natural
indicator of motor intent. Event-related synchronization (ERS; an increase in power) of
beta occurs as rebounds after movement (Pfurtscheller and Lopes da Silva, 1999; Cassim et al., 2001; Pfurtscheller et al., 2005), and occurs during real and imagined movement preparation and planning (Shenoy et al., 2003; Scherberger et al., 2005; O’Leary and Hatsopoulos, 2006; Leeb et al., 2007; Kilavik et al., 2012; Torrecillos et al., 2015). These ERS events seen in trial-averaged data may, however, be constituted by an increased rate of bursting events, rather than sustained oscillatory events (Feingold et al., 2015; Jones, 2016; Lundqvist et al., 2016; Sherman et al., 2016). Therefore, volitional modulation of
12
the beta sensorimotor rhythm (SMR) or these bursting events could be used as a “brain
switch” by the subject to indicate when the BMI decoder should start or stop decoding (Pfurtscheller and Solis-Escalante, 2009).
A potential problem with using the beta SMR is that there may be a reduction in SMR activity for paralyzed and “locked-in” patients (Kübler and Birbaumer, 2008). It may also be important to distinguish between motor imagery and motor execution (Birch et al., 2002), which can be difficult because LFP dynamics underlying imagined movement parallel the dynamics underlying actual motor movement (do Nascimento et al., 2006; DaSalla et al., 2009; Miller et al., 2010). Neurofeedback training could help increase, restore, or maintain reduced beta SMR activity or assist in the differentiation of real versus imagined motor intent (Toppi et al., 2014). Further, if beta band activity is vital to motor learning (Feingold et al., 2015; Torrecillos et al., 2015; Cao and Hu, 2016; Tan et al., 2016), then successful neuromodulation of this activity could be important for patients recovering from stroke or other trauma (Daly and Wolpaw, 2008).
Neuromodulation has been performed by rats, cats, mice, monkeys, and humans in cortical and subcortical areas (Wyrwicka and Sterman, 1968; Wolpaw and McFarland, 2004; Cerf et al., 2010; Kobayashi et al., 2010; Philippens and Vanwersch, 2010; Ludwig et al., 2011; Koralek et al., 2012; Sakurai and Takahashi, 2013; Grosse-Wentrup and Schölkopf, 2014), but little of this work details the behavior and neural-behavioral relationships accompanying the neuromodulation.
We investigated the use of beta oscillations in motor cortex as a “switch” for neural control of a BMI, due to the beta rhythm’s natural association with motor control, as well as the extended lifespan and usefulness of LFP signals over spiking activity (Wang et al., 2014). Freely moving mice in a neurofeedback task received water reward by controlling an auditory pitch cursor. The cursor was controlled through a modified beta power
measure from intracortical electrodes in vibrissal motor cortex (vM1). Beta power (13-30
Hz) was normalized by broadband activity to reduce motion artifacts (Ludwig et al., 2011). We were able to investigate the features of beta neuromodulation learning because the electrodes were intracortical. Recently, beta band activity has been found to occur in bursts, rather than sustained oscillations, in both the cortical and subcortical sensorimotor system (Feingold et al., 2015; Sherman et al., 2016) and in prefrontal areas involved with working memory and attentional control (Sacchet et al., 2015; Lundqvist et al., 2016). If beta band activity occurs in bursts, it is unclear how learned neuromodulation of beta activity would alter the power, duration, or rate of beta bursts.
Neuromodulation performance improved quickly, increasing suddenly and plateauing in
the 3rd control session. These performance improvements were due to neuromodulation
success—not through learned behavioral strategies. Post-hoc analysis of LFP data shows that the neural activity underlying the performance improvement were ~5 – 27 Hz beta-range bursts that increased in median duration from 157 – 182 ms during task-related periods across the experiment. Beta-range bursts did not increase in power or rate during these same task-related periods. Increases in EMG power from ~12 – 38 Hz around reward threshold periods were associated with increases in task-related vM1 LFP-EMG
14
coherence and significant MUA-EMG phase preferences. The increases in EMG power and apparent drive of high beta EMG by vM1 suggest the possibility that the beta-range bursts resemble the tonic “hold” beta SMR previously described in monkeys and humans. This work illustrates the feasibility of using neurofeedback to create a beta-range “brain switch” for motor BMIs, but also provides evidence that neuromodulation studies should be mindful of the context in which rhythms are modulated.
Methods
Overview
All procedures were performed under protocols approved by the Boston
University Institutional Animal Care and Use Committee guidelines. Freely moving mice
received instantaneous neurofeedback of left vibrissal motor cortex (vM1) beta power
and increased beta power relative to broadband power for water reward.
Subjects
Mice in this experiment came from homozygous and heterozygous Emx-Cre (Jin et al., 2000) and Ai32 (Madisen et al., 2012) lines, or subsequent cross-breeding (n = 5 males). While the genetic modifications in these lines did not play a direct role in the experiments, these lines were used in anticipation of future experiments employing optogenetic stimulation. One of the five mice had a high rate of false alarms during the behavioral training phase and was never implanted for neurofeedback control. A second mouse had a relatively long recovery time after the implant surgery, and did not initiate many trials during neurofeedback sessions. We therefore curtailed this mouse’s
participation in the experiment and its data is excluded from analysis. Data from three mice therefore remained for analysis. These mice will hereafter be referred to as mice A (Emx-Cre +/+), B (Emx-Cre –/+), and C (Ai32 –/+ Emx-Cre –/+), and were respectively P140, P127, and P85 at the start of training.
Mice were maintained on a 12 hr light/dark schedule and given ad libitum access
16
throughout a contiguous session block. Mice received up to 1 mL of water during the course of an experimental session through water rewards, and 1 mL of water several hours after the termination of each experimental session.
Behavioral Task
The arena (Figure 1A) was an open field with two adjacent nose ports: (a) a reward port for water delivery, and (b) a trial initiation port, that mice used to initiate trials (Erlich et al., 2011; Leventhal et al., 2012). In preliminary work, we found that mouse-initiated trials stabilized motivation to perform and increased task participation. Further, mouse-initiated trials allow us the possibility of recognizing mouse intention to participate on a single trial basis.
Upon trial initiation, the house light turned off and auditory feedback
simultaneously started, indicating an ongoing trial (Figure 1B). If the beta power reward threshold was not met within 30 s (Koralek et al., 2012) or the mouse committed a false alarm and poked the reward port early, the trial ended and the house light turned on and feedback simultaneously stopped. If the reward threshold was met within 30 s (success), feedback stopped and a 10 kHz auditory tone (reward tone) played for 2-5 s. If the mouse poked the reward port while the reward tone was playing, water reward was provided and the house light turned on. If the reward tone stopped before the mouse poked the reward port, the house light turned on and no reward was provided.
Auditory feedback was presented, in which the frequency of the tone was graded
by a logistic function of the beta power ratio magnitude (see Decoding Features). EMG
We define the behavioral index (BI) as:
𝐼𝑏𝑒ℎ =
𝑇𝑃 − 𝐹𝐴 𝑇𝑃 + 𝐹𝐴
where 𝑇𝑃 is the number of true positives (i.e. rewards received), and 𝐹𝐴 is the number of
false alarms. The range of this value is [-1, 1], with -1 indicating all false alarms, and 1 indicating all true positives.
Figure 1: Description of Experiment
(a) Behavioral arena schematic. Two nose ports control the flow of the behavioral task: the trial initiation port (bottom port) and the reward port (top port). (b) Task flow. Inter-trial interval (ITI) periods ended when mice initiated trials by breaking an infrared beam in the initiation port. Upon trial initiation, the neurofeedback auditory tone was played. If mice entered the reward port prior to reward availability, the trial resulted in a
18
false alarm (red box), the trial was ended, and the ITI period began. If mice successfully reached reward threshold (dark green box), a 10 kHz reward tone played and they had 2-5 s to retrieve the water reward (light green box) before the ITI period began. If 30 s elapsed without a false alarm and without reward availability (yellow box), the trial ended, feedback stopped, and the ITI period began. (c) Histology from mouse C shows electrode tracts in layer 5 of vM1. This slice shows the location of the reference electrode and is located approximately 0.86 mm anterior to bregma. Red scale bar represents 1 mm. (d) Offline BPR calculation confirms accuracy of online BPR calculation. Top: an example of the corresponding offline (blue) and online (orange; PowerBand, i.e. exponential filter) BPR calculations. Bottom: an example of the
corresponding offline (blue) and online (orange; beta bandpass RMS) BPR calculations. Note the ranges for both the PowerBand and RMS online calculations do not match the offline BPR calculations, but that the heights of the peaks are similar in scale.
Microelectrode Arrays and Implantation
After mice were trained to seek water reward in response to a 10 kHz auditory tone after ignoring a random auditory tone (1-5 kHz), they were implanted in left
vibrissal motor cortex with a microelectrode array (vM1; -1.0 mm ML of bregma, +1.0
Franklin, 2001; Parikh et al., 2009; Matyas et al., 2010; Xu et al., 2012). The arrays were custom 13 channel fixed electrode arrays (approximately 1.5 mm diameter array, 50 µm Teflon coated tungsten wires, ~100-150 kΩ impedance). The reference wire was ~1 mm longer than the other 12 wires, targeted to the subcortical white matter. Three ground wires were wrapped around steel screws (00-90 x 1/16, Antrin Miniature Specialties, Inc.) attached to the skull over the cerebellum, and the left and right cortices. The arrays were then fixed to the ground screws using dental cement.
EMG stereotrodes were created from twisted strands of two 50 µm (100 µm Teflon coated) stainless steel wire (~1 MΩ impedance). One of the wires was cut 1 mm shorter to create a potential differential. The stereotrodes were threaded subcutaneously into the bilateral whisker pads, as described previously (Schroeder and Ritt, 2013).
Histology
Animals were sacrificed and perfused with 0.1 M phosphate buffer and then 4% paraformaldehyde solution. Brains were extracted, placed into a 30% glucose solution, and then sliced at 60 µm. The slices were treated with 1% Triton X-100 detergent, stained with DAPI, and fixed on slides with ProLong Gold antifade reagent. Images were
captured using a Nikon Eclipse Ni-E fluorescent microscope and processed with Nikon NIS-Elements Advanced Research software.
Histological slices confirm the placement of the recording electrodes within deeper layers of motor cortex, especially vM1, and the reference electrode below motor cortex within the white matter or lateral ventricles (Figure 1C). Some cortical damage was visible, but due to the length of time (~3 – 6 months) between implantation and
20
sacrifice, it is unclear to what extent the cortex was damaged during the time of data
collection for this work. Based on the presence of MUA (see MUA Activity), we believe
the cortex to have been reasonably healthy during the relevant recording period.
Neural Recordings
All neural data were recorded using a TDT RZ2 BioAmp Processor and a TDT PZ2 Preamplifier (Tucker-Davis Technologies) at a 24.4 kHz sampling rate. All non-EMG data were low pass filtered at 150 Hz using a 4th order non-causal Butterworth filter and downsampled to 488 Hz for offline processing of LFPs, unless otherwise noted. EMG was processed as follows: (1) the two signals from the stereotrode were subtracted from each other, (2) this differential signal was band pass filtered from 200-3000 Hz using a 2nd order non-causal Butterworth filter, (3) this band passed signal was low pass filtered at 40 Hz using a 2nd order non-causal Butterworth filter, and (4) the resulting signal was downsampled to 244 Hz for offline processing.
At the start of each recording session, “bad” electrodes were identified via visual and auditory inspection and were excluded from online neurofeedback control. All remaining electrodes were considered “good”. Only mouse C had any “bad” electrodes for the brain control sessions analyzed (n=1 – 4 electrodes per session). All 12 of mice A’s and B’s recording electrodes were considered “good” for these analyses.
Recording Sessions
Two different online power calculation methods were used to determine real time
(exponential filter) for 12 brain control sessions before switching to the second method (RMS filter). Mouse C used the second method exclusively. The important comparison to be made in this work is the development of neuromodulation skill by novice subjects, and not how subjects use particular power filters. Therefore, to help ensure a fair comparison of neuromodulation skill development between the three mice, we only consider those first 12 brain control sessions for mice A and B in which the exponential filter was used.
Rodents show relatively little desire for water within 24 hours of water deprivation (Stellar and Hill, 1952; Dufort and Abrahamson, 1966). Even when over-trained in the neuromodulation task, the three mice initiated significantly fewer trials during the first session in a contiguous block of session days (median 169 vs. 222,
𝑝 = 0.0014, Wilcoxon rank sum test, Holm-Bonferroni corrected) and significantly more timed out trials per trial initiation occurred during these first sessions (median 0.09 vs.
0.02, 𝑝 < 0.001, Wilcoxon rank sum test, Holm-Bonferroni corrected). A lack of
motivation during recent water deprivation is therefore a potential confound and we excluded these initial sessions from further analysis (2 sessions each for mice A and B). After exclusion, there were only ten sessions remaining for the first method (exponential filter) for each of mice A and B. All analyses are based on these first ten, non-initial sessions for the first two mice, and the first ten sessions of the third mouse using the second method (RMS filter).
Decoding Features
Previous work has used a simple beta power threshold in a sliding window to signal motor intent (Leeb et al., 2007). However, the subject in Leeb et al. was a
22
stationary human who was confined to the wheelchair, whereas our task involves freely moving mice. As discussed in previous studies (Ludwig et al., 2011), motion artifacts are possibly confounds and we therefore corrected for broadband power increases by using a
beta power ratio (BPR). BPR is defined as the power in the 13-30 Hz band (i.e. beta)
normalized by the power in the 1-80 Hz band (broadband LFP), similar to previous normalization strategies (Hamada et al., 1999; Shaw and Chew, 2003; Kropotov et al., 2005; Sun and Dan, 2009; Rouse et al., 2013; Williams et al., 2013; Khanna and Carmena, 2015).
We used two methods of calculating the power in the beta band. The first method used TDT’s PowerBand module, which calculates instantaneous power using exponential filters of the cosine and sine of the neural data. The second method was bandpass filtering the raw neural signals, and then calculating the RMS of these filtered data. We will refer to the PowerBand module method as the “exponential filter”, and the RMS method as the “RMS filter”.
The PowerBand module calculates power via the following equation:
𝑆𝑡 = 𝑐𝑜𝑠𝐴𝑣𝑔𝑡2+ 𝑠𝑖𝑛𝐴𝑣𝑔𝑡2+ 2|(𝑐𝑜𝑠𝐴𝑣𝑔𝑡∗ 𝑠𝑖𝑛𝐴𝑣𝑔𝑡)|
where 𝑐𝑜𝑠𝐴𝑣𝑔𝑡 and 𝑠𝑖𝑛𝐴𝑣𝑔𝑡 are exponential moving averages of the co and
sine-multiplied values of the neural data:
𝑐𝑜𝑠𝐴𝑣𝑔𝑡+1= (1 − 𝜏) ∗ 𝑐𝑜𝑠𝑡+ 𝜏 ∗ 𝑐𝑜𝑠𝐴𝑣𝑔𝑡
𝑠𝑖𝑛𝐴𝑣𝑔𝑡+1 = (1 − 𝜏) ∗ 𝑠𝑖𝑛𝑡+ 𝜏 ∗ 𝑠𝑖𝑛𝐴𝑣𝑔𝑡
where 𝜏 is the exponential weighting of the average, determined by the bandwidth 𝐵 and
𝜏 = 𝑒−2𝜋∗𝐵∗𝐹𝑠
and 𝑐𝑜𝑠𝑡 and 𝑠𝑖𝑛𝑡 are the instantaneous products of the neural signal and the cosine and
sine functions:
𝑐𝑜𝑠𝑡 = 𝑥𝑡cos(2𝜋𝜑𝑡) 𝑠𝑖𝑛𝑡= 𝑥𝑡sin(2𝜋𝜑𝑡)
where 𝜑 is the center frequency of the band.
For mice A and B, we used three PowerBand modules to calculate power in the
0.5-55.5, 64-80, and 14-30 Hz bands (𝜑 = 25.5, 𝐵 = 50; 𝜑 = 72, 𝐵 = 16; and 𝜑 = 22,
𝐵 = 16, respectively). The 14-30 Hz band power was divided by the sum of the power in the 0.5-55.5 and 64-80 Hz bands. For mouse C, we used the RMS of the 1-57, 63-80, and 13-30 Hz causally filtered neural data (12 dB/octave filter rolloff).
A single average BPR was calculated from the BPR of all individual electrodes. This average BPR was smoothed by 600 ms (Koralek et al., 2012) for the PowerBand calculation, and the RMS values were smoothed by 1000 ms. We also compared both online BPR calculation methods (exponential and RMS) and an offline version that calculated power through the multitaper method (chronux.org) and was then summed and normalized similarly to the online BPR estimate (Figure 1D). The online BPR calculation is noisy and has a different range than the offline calculation, but has a similar relative scale and peaks at similar times.
BPR Threshold Determination
After implantation, mice were given approximately a week to recover from surgery and were then recorded during pre-brain control sessions to determine the
24
appropriate value of the BPR reward threshold. Mice A and B each ran two pre-brain control sessions. Due to recording quality issues, we ignored the first pre-brain control session for both mice A and B. BPR threshold values were determined from the
remaining pre-brain control session for each mouse. Mouse C ran five pre-brain control sessions and we determined a BPR reward threshold value as the average BPR threshold of these sessions.
We individually calibrated the BPR threshold offline for each mouse using the pre-brain control session BPR data. We iteratively adjusted the BPR threshold value until mice would have reached reward threshold 80 times in a 40 min session (i.e. two
rewards/min). This initial rate of reward was found to be appropriate in initial modeling because it was low enough to allow improvement and not so infrequent to demotivate mice unfamiliar with the brain control task.
Neurofeedback
Auditory tone frequency was altered in real time, according to:
𝐻𝑧𝑡= 4040 1 + 𝑒 − ( 4.6(𝐵𝑃𝑅𝑡−𝐵𝑃𝑅𝑚𝑒𝑎𝑛) (𝐵𝑃𝑅𝑡ℎ𝑟𝑒𝑠ℎ−𝐵𝑃𝑅𝑚𝑒𝑎𝑛) ⁄ ) + 1000
where 𝐻𝑧𝑡 is the auditory frequency at time 𝑡, 𝐵𝑃𝑅𝑡 is the online BPR at time 𝑡,
𝐵𝑃𝑅𝑡ℎ𝑟𝑒𝑠ℎ is the BPR reward threshold for the mouse, and 𝐵𝑃𝑅𝑚𝑒𝑎𝑛 is the mean of
𝐵𝑃𝑅𝑡ℎ𝑟𝑒𝑠ℎ and the 1st percentile of the BPR values found from the pre-brain control sessions. This logistic function bounds the feedback frequency between 1000 Hz as
𝐵𝑃𝑅 → ∞− and 5040 Hz as 𝐵𝑃𝑅 → ∞+, and 5000 Hz (reward target) at 𝐵𝑃𝑅 𝑡 =
𝐵𝑃𝑅𝑡ℎ𝑟𝑒𝑠ℎ. In preliminary work, we found a logistic function necessary because the limited value range allows the same parameter values to be used over the entire experimental life of a mouse, regardless of any signal quality changes or BPR drift.
MUA Activity
Multi-unit activity was extracted through a two-step process. First we applied a
bandpass filter to the raw neural recordings between 300-5000 Hz using a non-causal 6th
order Butterworth filter. The bandpassed neural activity was then inverted so that only negative-going spikes were detected. MUA windows (~1.5 ms) were selected using the following threshold (Quiroga et al., 2004):
𝑇ℎ𝑟 = 4𝜎𝑛
𝜎𝑛 = 𝑚𝑒𝑑𝑖𝑎𝑛 { |𝑥| 0.6745}
where 𝜎𝑛 is an approximate standard deviation that reduces the effect of high spike
amplitudes and bursting or fast-firing units on the standard deviation, and 𝑥 is the
bandpassed neural activity. MUA windows were then aligned to the maximum value of the window, in contrast to aligning on the threshold crossing times.
Second, we performed the following three quality control steps on the extracted MUA windows to exclude MUA activity that was likely due to noise:
MUA activity that occurred during LFP signal saturation (|𝐿𝐹𝑃𝑥| > 0.8 𝐿𝐹𝑃𝑀𝐴𝑋) was
considered to be noise and was excluded.
MUA activity with a full-width half-max (FWHM) ≥ 10 samples (~0.41 ms) had shapes
26
MUA activity was binned in 1 ms bins across all 12 recording electrodes, and any
MUA windows that occurred in the same 1 ms bin across ≥ 6 electrodes were considered
to be noise and were excluded. To determine that this step was necessary, we permuted the ISIs of all MUA windows across all 12 electrodes 100 times to generate 95% confidence bands of random spiking activity and determined that coincident spikes should not generally occur in greater than ~2 electrodes, again assuming the spikes are completely random. Given that spiking activity is not completely random, we made the cutoff for coincident MUA windows 6 electrodes, to allow for the possibility that some coincident spikes are due to synchronization of neural activity or an increased firing rate. The mean MUA shapes appear to be neural and the retention rate of MUA windows after these quality control steps were 73.3%, 78.6%, and 54.9% of all detected MUA windows, respectively for the three mice.
Burst Analysis
We used methods similar to previous studies to determine the existence and duration of beta band bursting activity (Feingold et al., 2015; Lundqvist et al., 2016). First, we chose frequencies appropriate for each mouse, based on the largest power increases seen 0 – 250 ms prior to reward availability (16-25 Hz, 10-27 Hz, and 5-17 Hz
for mice A, B, and C, respectively). Then we band passed the raw neural data using a 4th
order non-causal Butterworth filter and these mouse-specific frequencies. Next, we calculated the Hilbert envelope of the band pass filtered data, and defined the existence of bursts where the envelope exceeded 3 times the median value of the envelope, and the duration of those bursts as the continuous data above 1.5 times the median value.
Results
Mice Learn the Neuromodulation Task
Mice successfully learned the neuromodulation task and several lines of evidence suggest mice accomplished this feat through proficiency in neuromodulation and not to advantageous behavioral strategies such as delayed reward seeking responses.
Raw LFP traces (Figure 2) indicate that there are two major variations of activity that occurred at reward threshold when the online decoder calculated a high BPR: (1) a visually classical beta oscillation, in which the hallmark arch shape repeats at 13-30 Hz, and (2) large negative impulse-like activity, which could be a local motor potential (Schalk et al., 2007). Spectrograms of the neural data around reward availability periods show a power increase in frequencies overlapping the 13-30 Hz range, compared to random baseline periods (Figure 3A). We also saw a progressive increase in the 13-30 Hz range in session-wide LFP spectra (Figure 3B) that could be due to increased numbers of beta band bursts over sessions.
Mice successfully learned the neuromodulation task, as measured by the behavior
index (BI). The rising BI indicates a decrease in the number of false alarms committed
relative to the number of true positives over the ten brain control sessions (Figure 4A,
top). The mean BI for all mice begins at −0.5 (i.e. 25% true positives) and peaks at
+0.35 (i.e. 68% true positives) during session 9. There was a large increase in mean BI at session 3 that could be due to reward seeking strategies and/or successful
neuromodulation—inhibition of reward seeking at inappropriate times would inherently decrease the number of FAs, and successful neuromodulation would increase the chances
28
that reward seeking occurs during reward availability. However, neuromodulation performance is likely the proximal cause for the BI jump at session 3, based on several reward threshold timing measurements that improved during the same session.
The most direct evidence for the neural origins of task success is that the rate of threshold events quickly increases and their timing is tied to trial initiation. Mice quickly increased the rate of BPR threshold events (Figure 4A, middle), irrespective of whether the threshold event occurred within a trial (i.e. whether or not a reward was associated with the event). With only one exception (mouse B, session 6), all mice had higher threshold event rates from session 3 onwards than in either of the first two sessions, which is a direct result of successful neuromodulation and tightly corresponds with the BI jump at session 3. Mice may have learned to increase overall levels of motor activity to generate more reward threshold events at random times. However, we found that threshold events occurred shortly after trial initiation (Figure 4A, bottom). We
determined that the post-initiation threshold event latency distributions were not random by shuffling inter-trial interval times and finding the successive reward threshold events. By breaking this time dependence on the actual trial initiation times, we found that all three mice had a significant increase in reward threshold latencies sooner than 2 s after trial initiation, and that the shuffled reward threshold latencies looked more like an exponential distribution that is indicative of randomly occurring events (Figure 4B). Therefore, it seems probable that neural strategies are at least partially responsible for the increase in neuromodulation task performance, but did the mice engage in any reward seeking strategies that could also have increased performance?
Mice could have adopted a strategy of simply waiting long enough for a threshold
event to occur before seeking reward, that means we would expect the false alarm (FA)
latency to be significantly shorter than the true positive (TP) latency. In other words,
false alarms would be caused simply because mice sought reward too quickly, and so the true positive latency would be longer, on average. If the TP and FA latencies are similar, however, then the reward seeking responses are relatively random and any increase in the number of TPs relative to FAs must be due to the ability of mice to generate threshold events soon after trial initiation. We found the latter relationship to be true: median latencies to TPs and FAs from trial initiation were similar across most sessions for all mice (Figure 4C). This suggests that mice tended to seek reward at random intervals and that the success rate depended on the latency to reward threshold from trial initiation. Moreover, both the TP and FA latencies decreased over the first 3-4 sessions, and then generally remained constant for the remaining sessions, arguing against the possibility that TPs increased and FAs decreased because the mice simply waited longer to respond. TP and FA responses were similar enough, however, that we wondered whether mice were seeking reward entirely randomly or whether it at least partially depended on auditory feedback frequency. If TP response latencies were completely random, the probability density should resemble an exponential distribution. However, mice reliably sought reward ~250 to 650 ms after reward tone, with a notable decrease in response probability ~0 to 250 ms after reward tone. These data indicate that reward seeking was a response to the reward tone.
30
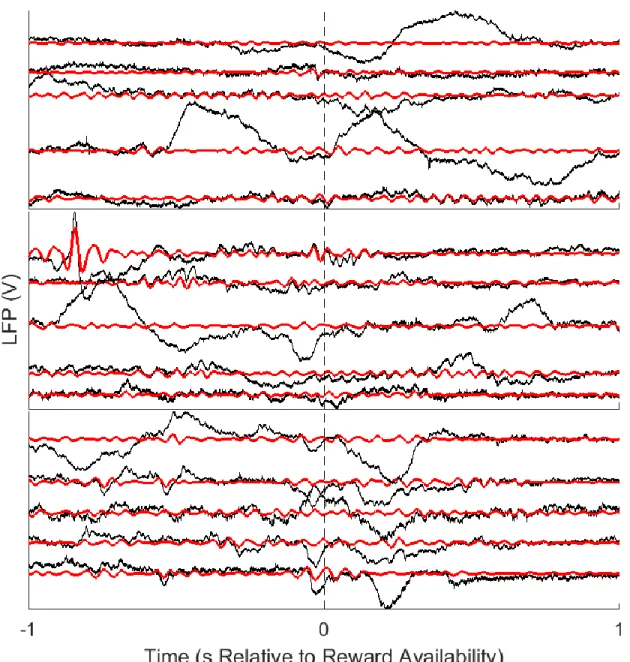
Figure 2: Raw LFP examples
Five random LFP traces (black) are shown for each of the three mice (top to bottom, respectively). Each trace is centered on the 2 s around reward availability. The bandpassed LFP traces (13-30 Hz; shown in red) are plotted for comparison. There are varying degrees to which classically-defined beta band activity occurred. For example, most of the raw traces
for the first two mice (A and B) have many bouts of classical beta band activity, including true 13-30 Hz oscillations and the hallmark arch shape. In contrast, the third mouse (C; bottom) had little classically-defined beta band activity, but instead had only brief moments in a true 13-30 Hz regime, without the appropriate arch shape. Also note that there may not be large 13-30 Hz oscillations on a given electrode around reward availability, but that there would be ~11 other electrodes with concurrent activity that may have had larger 13-30 Hz oscillations that increased the BPR value at that time.
32
Figure 3: Beta band power increased over sessions
(a) Mice showed an overall increase in ~5 – 45 Hz power around reward availability. All spectrograms are normalized by random epochs. Red dashed lines indicate frequency bands in which there was a large increase in power 0 – 250 ms prior to reward availability. These subject-specific
frequency bands are used for burst analyses (see Bursts Underlie Beta
Band Neuromodulation). (b) LFP spectra show bumps in the 15 – 30 Hz
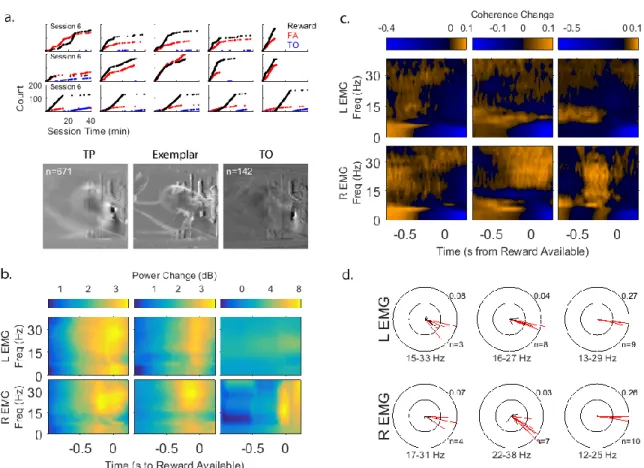
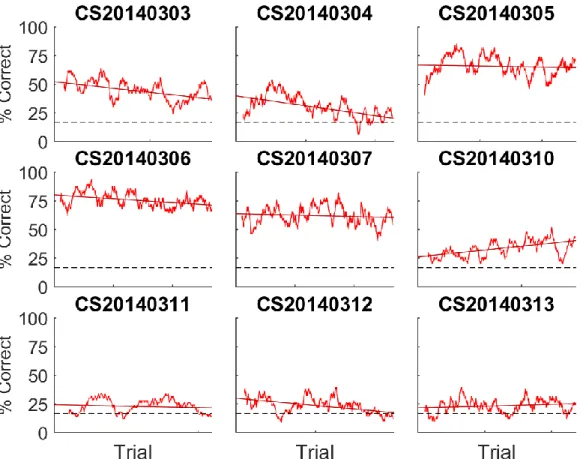
Figure 4: Task performance increases are due to neuromodulation success and not due to reward seeking strategies
(a) Behavior index (BI) increases over sessions (top) are supported by increases in threshold rates (middle) and decreases in reward threshold latencies (bottom). Note the BI jump in session 3 is accompanied by a similar jump in the threshold rate and drop in threshold latency in session 3. This result suggests the BI increase is at least partially due to
neuromodulation success. (b) Reward threshold latencies were tied to trial initiation times. Early session (1-3) latencies (gray) occur within a similar distribution as random bootstrapped latencies (red). Late session (8-10) latencies (black) occurred earlier than by chance, suggesting that mice
34
learned to produce threshold events soon after trial initiations. Bootstrapped latencies were generated by permuting the inter-trial
intervals (ITIs). (c) True positive and false alarm latencies decreased over sessions and are not substantially different, indicating that the BI increase was not due to delayed reward seeking responses.
Bursts Underlie Beta Band Neuromodulation
Recent evidence suggests that trial-averaged spectrograms misrepresent the neural activity that occurs at the single-trial basis (Feingold et al., 2015; Lundqvist et al., 2016; Sherman et al., 2016). For instance, trial-averaged spectrograms might suggest prolonged activity in the beta band range during the preparatory period before a reach (Sanes and Donoghue, 1993), when in fact the power increase seen over time periods as long as a few seconds may only be the result of an increase in the rate of short ~100 – 200 ms burst events.
Although the reward criterion of our neuromodulation task was to increase power in the 13-30 Hz band relative to broadband power, our mice generated power increases in various frequencies bands between ~5 – 45 Hz (Figure 3A). We therefore used mouse-specific frequency bands (16 – 25 Hz, 10 – 27 Hz, and 5 – 17 Hz, for mouse A, B, and C, respectively) with increased power over the 250 ms before reward threshold to
investigate whether the power increase consisted of bursting events.
To establish that the increased power consisted of bursts, rather than prolonged rhythmic activity, we first looked at the duration of the elevated power events using
methods similar to recent work (Feingold et al., 2015; Lundqvist et al., 2016; Sherman et al., 2016). The median duration of elevated power events across all “good” electrodes in all brain control sessions was 205, 133, and 207 ms for mouse A, B, and C, respectively, which correspond to 3.3 – 5.1, 1.3 – 3.6, and 1.0 – 3.5 cycles per event, depending on frequency. These median durations are similar to previous descriptions of beta bursts (Murthy and Fetz, 1992, 1996; Leventhal et al., 2012; Feingold et al., 2015; Lundqvist et al., 2016) and suggest the possibility that beta range bursts underlie the power increases seen around reward threshold.
We next looked at the density of bursts around both trial initiation and trial termination (when the mouse either commits a FA or TP, or the 30 s trial time limit was reached). There was a large increase in burst density starting ~0.5 s before trial initiation, which dropped to or below chance density for ~0.5 s starting at trial termination, when mice sought reward or had otherwise not yet initiated the next trial (Figure 5). The large increase in burst density from ~0.5 s prior to trial initiation until trial termination suggests bursting activity was enhanced during trial-related time periods. We therefore defined bursts to be “task-related” if their onset occurred between 0.5 s before trial initiation and 0 s from trial termination (Figure 6A). Having defined task-related burst events, we found the median task-related burst durations for two of the three mice were lower than all task- and non-task-related bursts (144, 142, and 184 ms for mouse A, B, and C, respectively, corresponding to 2.3 – 3.6, 1.4 – 3.8, and 0.9 – 3.1 cycles, depending on frequency). Therefore, it is possible that whatever behavioral or neural strategies the mice use to
36
solve the neuromodulation task may be inherently different than incidental beta burst-producing activities.
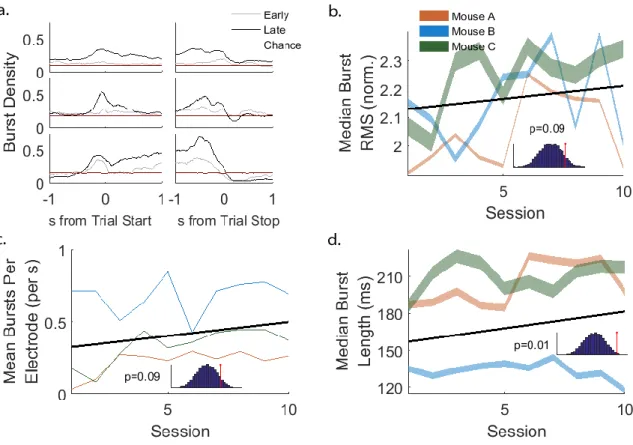
We next asked if the neuromodulation performance increase over sessions was due to an increase in the amplitude of task-related bursts, given the explicit reward state of high 13-30 Hz power. The median-normalized RMS of the task-related bursts did not significantly increase over sessions, although the slope approached significance (Figure 6B; 𝑝 = 0.09, permutation test, 𝑝 = 0.18 after Holm-Bonferroni correction). We then wondered if the performance improvement was due to an increased rate of task-related bursts, due to the lack of significant increase in burst RMS and the increase in burst density around trials. Again, the rate of task-related bursts did not significantly increase,
although the slope approached significance (Figure 6C; 𝑝 = 0.09, permutation test,
𝑝 = 0.18 after Holm-Bonferroni correction). We also measured the median duration of task-related bursts and found that they significantly increased from 157 ms to 182 ms
(Figure 6D; 𝑝 = 0.01, permutation test, 𝑝 = 0.03 after Holm-Bonferroni correction). The
25 ms change corresponds to a median increase of ~0.1 – 0.7 cycles per burst, depending on the frequency (5 – 27 Hz).
These durations agree well with the literature, increase over sessions, and may be a major driver of neuromodulation task success. Both the power and rate of the task-related bursts do not significantly increase, and could indicate that they are not the proximal causes of neuromodulation task success. In sum, the trial-averaged power increases seen around reward threshold appear to be generated by an increase in the
duration and density of task-related burst events, rather than through an increase in the power of extended oscillations.
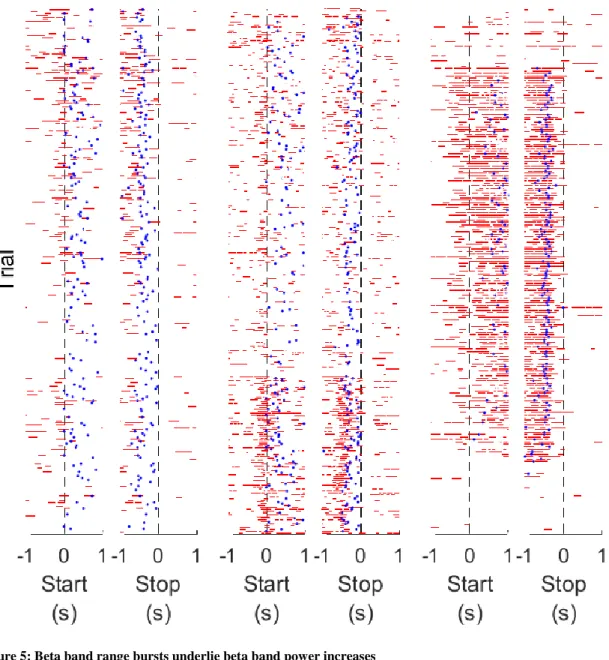
Figure 5: Beta band range bursts underlie beta band power increases
Examples of elevated beta range bursts during the last session of each mouse. Red lines: elevated power event (i.e. a “burst”). Blue dots: reward threshold events. The number of beta bursts increased ~0.5 s prior to trial starts and dropped at trial termination. Reward threshold events occurred
38
during periods of dense beta bursts. The mice had different progressions of beta burst generation during this session; mouse A gradually increased the production of burst events, mouse B had a fairly sudden drop in the
production of burst events, and mouse C had a very distinct period of burst production in the middle of the session. Mice A and B generated reward threshold events throughout their sessions, but mouse C only had reward threshold events during the period of increased burst production. Traces are in trial order (first trial at bottom, last trial at top), and a random “good” electrode was selected for display in each trial. Left plots: mouse A. Center plots: mouse B. Right plots: mouse C.
Figure 6: Beta range burst durations increased over sessions
(a) Burst density increased ~0.5 s before trial initiation and decreased around trial termination. This time range defines the period of “task-related” bursts. Early burst densities (gray) were lower than late burst densities (black) and were similar to chance burst densities (red). Chance burst densities were derived from 10000 random epochs from all sessions. Top row: mouse A. Middle row: mouse B. Bottom row: mouse C. (b) The median normalized burst RMS did not increase over sessions (p=0.09 uncorrected p-value, 10000 permutations of Theil Sen fit). Inset:
histogram of permuted Theil Sen fit slopes and the slope of the unshuffled data. (c) The rate of burst events did not increase over sessions (p=0.09
40
uncorrected p-value, 10000 permutations of Theil Sen fit). Inset:
histogram of permuted Theil Sen fit slopes and the slope of the unshuffled data. (d) Burst durations increased over sessions (p=0.01 uncorrected p-value, 10000 permutations of Theil Sen fit, p=0.03 Holm-Bonferroni corrected p-value). Inset: histogram of permuted Theil Sen fit slopes and the slope of the unshuffled data.