I N T E R N A T I O N A L J O U R N A L O F C O M P U T E R S & T E C H N O L O G Y
Speech Activity Detection and its Evaluation in Speaker Diarization
System
1
Sukhvinder Kaur
,
2J. S. Sohal
1Ph.D Reaearch Scholar , I.K. Gujral PTU, Jalandhar, Kapurthala-144601, India
1
[email protected]
2Director, LCET, Ludhiana-141113, Punjab, India2
[email protected]
ABSTRACT
In speaker diarization, the speech/voice activity detection is performed to separate speech, non-speech and silent frames. Zero crossing rate and root mean square value of frames of audio clips has been used to select training data for silent, speech and non-speech models. The trained models are used by two classifiers, Gaussian mixture model (GMM) and Artificial neural network (ANN), to classify the speech and non-speech frames of audio clip. The results of ANN and GMM classifier are compared by Receiver operating characteristics (ROC) curve and Detection ErrorTradeoff (DET) graph. It is concluded that neural network based SAD comparatively better than Gaussian mixture model based SAD
.
Keywords
Artificial Neural Network, DET, Gaussian Mixture Model, ROC, Speaker Diarization System.
INTRODUCTION
Speaker Diarization is a process to determine “who spoke what” in an audio recording of meeting. It automatically finds the segments of time and spoken words within a meeting in which each meeting participant is talking. The aim of speaker diarization is to find speaker change points in an audio stream and then grouping together speaker homogeneous speech regions according to the speaker identity, which is not known a priori. The sources of audio recording can include particular speakers, background noise sources, music and other channel characteristics. Speaker diarization has many applications, including audio document processing, speaker adaptation for automatic speech recognition, audio indexing and speaker localization[1].
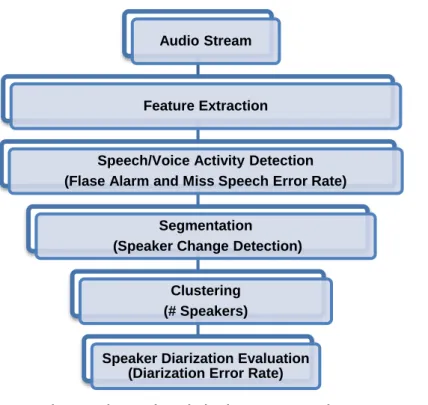
In the process of speaker dirization, there is need of some tools for extracting features of audio signal, speech activity detection (SAD), segmentation, clustering and re-alignment, shown in figure 1. Already available tools are LIUM_SpkDiarization Diarization [2], audioseg [3]; DiarTK[4], and SHoUT [5]. LIUM_SpkDiarization Diarization toolkit, written in Java, published under the GPL license This includes hierarchical agglomerative clustering methods using well-known measures such as bayesian information criteria (BIC) and cross likelihood ratio (CLR) for speaker segmentation and identification. DiarTK, written in C++, released under GPL license, designed for handling an arbitrary number of feature streams and it is expected to facilitate research and tests in novel feature types (visual information, location information) for diarizing multi-modal recordings while keeping limited the computational complexity. Separation of speech and non-speech signal is performed by a tool written in C++ named SHoUT. audioseg toolkit, written in C language provides tools, for silence /audio activity detection, segmentation, segment clustering, segment classification with Gaussian mixture models , joint segmentation and classification using hidden Markov models [3].
In this research, efficient speech activity detection is performed by using two classifiers: GMM classifier and artificial neural network classifier [6]. Their performance is compared with traditional receiver operating characteristics (ROC) curves and Detection Error Tradeoff (DET) [7] graphs by using MATLAB software. In the GMM classifier, the conditional-probability density function of the observation vector with respect to the different classes is modelled as a linear combination of multivariate Gaussian pdf’s [8]. Each of them has the following general form:
P(x) =
(1/(2π)
d/ 2|Σ
1/2|)𝑒
−1/2(𝑥−−µ)T Σ −1 (x−µ) (1)Where d is the dimension of feature vector x, µ is the mean of each feature, Σ is the d-by-d covariance matrix, and |Σ| is its determinant. It characterises the dispersion of the data on the d-dimensions of the feature vector.
In this work, we propose to use an artificial neural network (ANN) trained as a classifier to classify speech and non- speech frames at SAD stage. The ANN models are implemented through MATLAB software. In this software program, the model is trained, tested and finally evaluated for its performance [9].
The paper is organized as follows. Speaker diarization system is described in section 2. In Section 3, speech and non-speech detection algorithm is mentioned, section 4 presents the experimental results and finally the conclusion is given in the last section.
I S S N 2 2 7 7 - 3 0 6 1 V o l u m e 1 6 N u m b e r 1 I N T E R N A T I O N A L J O U R N A L O F C O M P U T E R S & T E C H N O L O G Y
7568 | P a g e
Fig. 1 Basic Speaker Diarization System Design
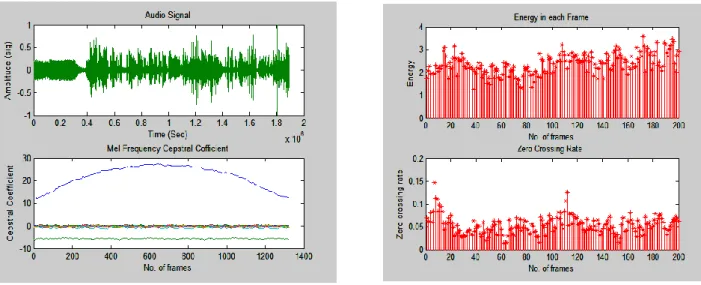
Figure 1 shows the main modules of an overall diarization system. It composed of speech feature extraction, Feature selection, SAD, speech segmentation, model clustering, re-alignment and evaluation module. The audio processing starts with the pre-processing module. It is responsible for the filtering of noise and the extraction of various features of acoustic signal like ‘Mel frequency cepstral coefficient (MFCC), spectrogram, pitch, energy and zero crossing rate (ZCR). Waveform of Audio signal and its feature ‘MFCC’ is shown in figure 2. Feature extraction can be stood as a step to reduce or compress the dimensionality of the input speech, a reduction which inevitably leads to some information loss. During feature extraction we divide the speech signal into frames and extract features for each frame. It changes the speech signals into a sequence of feature vectors. It results information loss during the transition from speech signal to a sequence of feature vector. It must be kept low [1]. The next module selects the features to perform SAD. An audio recording in .wav form may consist of some acoustic activities like speech, noise, music, background conversation, advertisement. Therefore, non-speech regions must be detected and removed from the audio stream [10]. Further speech signal is partitioned into speaker homogeneous regions in segmentation and clustering module. At last the output is evaluated.
SPEECH/NON SPEECH DETECTION
In speaker diarization system SAD divides the audio signal into speech and non-speech signals using zero crossing rate (ZCR) and root mean square (RMS) value shown in figure 3. The zero crossing rate is the rate of the signal sign change. It is a measure of number of times in a given time interval/frame that the amplitude of the speech signals passes through a value of zero. A definition for ZCR and RMS value is:
ZCR = ∑∞ |sgn[x(m)] − sgn[x(m − 1)]|
m=−∞ w(n − m) (2)
Where, sgn[x(m)] = 1 for x(m)≥0
= -1 for x (m) <0
And w (n) is the windowing function with a window size of N samples
RMS= √ ∑n=t2(x[n])2 n=t1 t2−t1 (3) Audio Stream Feature Extraction
Speech/Voice Activity Detection (Flase Alarm and Miss Speech Error Rate)
Segmentation (Speaker Change Detection)
Clustering (# Speakers)
Speaker Diarization Evaluation (Diarization Error Rate)
I N T E R N A T I O N A L J O U R N A L O F C O M P U T E R S & T E C H N O L O G Y
Fig. 2 Waveform of audio clip and its feature vector MFCC Fig. 3 RMS value of energy and zero crossing rate of audio clip.
The speech activity detection consists of following steps: Training Phase:
1. Segmentation of audio signal with frame size 30msec. 2. RMS value of energy and ZCR of each frame is calculated.
3. 15 percent frame features with highest energies and relative low ZCR are selected as training data set for the speech modeling, while the 25 percent frame features with lowest energies and relative higher ZCR as the training data set for non-speech modeling.
4. The selected speech and non-speech training data sets are used to iteratively re-train the two Gaussian mixture models (GMM), one for each with 32 and 16 mixture components respectively.
5. The same selected training data sets are also used to train Artificial Neural network (NN) model. Testing Phase:
1. Framing of audio signal in 30msec window and 10msec shift. 2. Generate 20 MFCC features of each frame. It acts as test data-set.
3. The trained GMM models and test data are used by GMM classifiers to classify it into speech and non_speech frames.
4. Also the trained neural network model and test data are given to artificial neural network (ANN) classifier to classify it into speech and non-speech frames.
5. The outputs of two classifiers GMM and ANN are evaluated by receiver operating characteristics (ROC), area under ROC curve (AUC) and DET graph [11]
EXPERIMENTS AND RESULTS
In this section, we describe the experiments performed on different data sets with the help of MATLAB GUIDE, functions from Voice Box and www.mathworks.com.
Data-set used
The data sources are video clips free down loaded from youtube.com in MP4 format, further it is converted into .wav form, and noise free recordings of TV shows by using single distant microphone (SDM).
I S S N 2 2 7 7 - 3 0 6 1 V o l u m e 1 6 N u m b e r 1 I N T E R N A T I O N A L J O U R N A L O F C O M P U T E R S & T E C H N O L O G Y
7570 | P a g e
(speaker not attributed when speech exists) and false alarm (speaker attributed when no speech exists) errors shown in equations (4) and (5). In this work, only false alarm and miss speech rates are discussed.
𝑀𝑖𝑠𝑠 𝑆𝑝𝑒𝑒𝑐ℎ 𝑅𝑎𝑡𝑒 =𝑡𝑜𝑡𝑎𝑙 𝑓𝑎𝑙𝑠𝑒 𝑛𝑒𝑔𝑎𝑡𝑖𝑣𝑒 𝑡𝑖𝑚𝑒
𝑡𝑜𝑡𝑎𝑙 𝑠𝑐𝑜𝑟𝑒𝑑 𝑡𝑖𝑚𝑒 (4)
False alarm rate = total false negative time
total scored non − speech time (5)
SPEECH ACTIVITY DETECTION EXPERIMENTS
After framing the silent free audio signal into 1323 frames, ZCR and RMS value is calculated using equation (2) and (3) respectively for each frame. In speech processing, a frame with RMS close to zero, suggests that it is a silent frame; a sudden change in the RMS for a short period suggests an irregular event such as a knock or a phone ring. If the change is long enough it may indicate a speaker change. High value of ZCR suggests non-speech such as different types of music or sound of clapping. To find training data for speech and non-speech modelling, we have manually selected ZCR<=0.04 and RMS value>0.04 for speech frames. For non-speech frames, ZCR>0.04 and RMS value<=0.04.
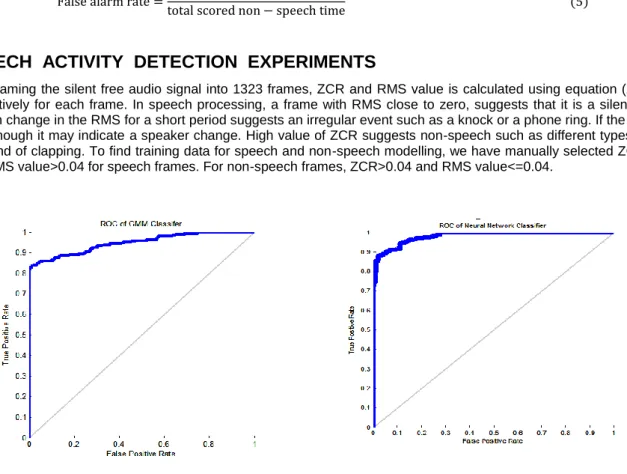
(a) (b) Fig. 4 ROC Curve using (a) ‘GMM’ classifier (b) Neural network classifier.
The training data is used to train two different models: GMM and Artificial neural network [6]. Trained models are used to classify test data by using two different binary classifiers: GMM classifier and neural network. The performances of two classifiers are evaluated with traditional ROC curves as shown in. figure 4. In this graph, true positive rate (miss speech rate) is plotted in function of the false positive rate (false alarm rate) for different cut-off points. The ROC curve and AUC is a measure of test accuracy. The value of AUC will always lies in between 0 and 1.
Table 1: Comparison of GMM and Neural Network Classifiers.
Name of classifier Area under ROC Curve Detection error Tradeoff Error
GMM classifier 0.9403 12.45
Neural network 0.9759 9.05
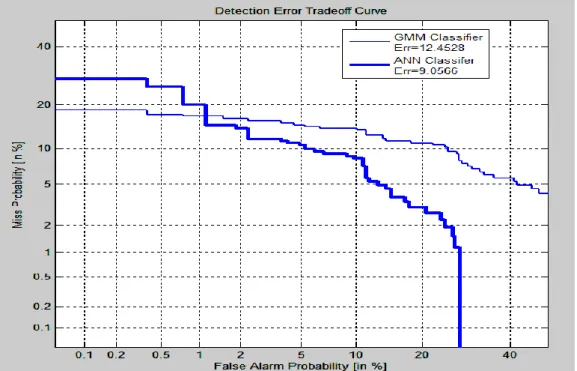
It is clear from Table I that AUC for neural network classifier is greater than that of GMM classifier. It shows that neural network based SAD performs better than GMM classifier The performances of two classifiers can also be evaluated by Detection Error Tradeoff (DET) curves as shown in figure 5. It is a graph of two error rates: miss rate and false alarm rate, plotted on the x and y axes. The error rate by using GMM classifier is 12.45 and that of ANN classifier is 9.05.
I N T E R N A T I O N A L J O U R N A L O F C O M P U T E R S & T E C H N O L O G Y
Fig. 5 DET Curve for ‘GMM classifier and Artificial Neural network classifier.
CONCLUSION
In this paper we presented two classifiers for speech activity detection in an audio recording: GMM and ANN classifier. The performance is evaluated by ROC curves and DET graphs. For SAD, ANN performs better than GMM Classifier as its AUC is 97.59%, and error rate is 9.05. Further work will be separated into two research areas to optimize the diarization error rate in speaker Diarization system: Improved segmentation and clustering of Speech signal
ACKNOWLEDGMENTS
The author thanks Dr, J. S. Sohal (Director, LCET, Ludhiana, Punjab) for his support and assistance in accomplishing this research work .
REFERENCES
1. X. M. Anguera, S. Bozonnet, N. Evans, C. Fredouille, G. Friedland, and O. Vinyals, “Speaker Diarization: A Review of Recent Research,” IEEE Trans. Audio Speech Lang. Process., vol. 20, no. 2, pp. 356–370, 2012. 2. S. Meigner and T. Merlin, “An Open Source Toolkit For Diarization Sylvain Meignier , Teva Merlin LIUM –
Universit ´ du Maine , France.”
3. A. S. Toolkit and G. Gravier, “Guillaume Gravier Micha¨ el Betser Mathieu Ben,” no. January, 2010.
4. D. Vijayasenan and F. Valente, “DiarTk: An Open Source Toolkit for Research in Multistream Speaker Diarization and its Application to Meetings Recordings.,” Interspeech, pp. 5–8, 2012.
5. M. Huijbregts, Segmentation, Diarization and Speech Transcription: Surprise Data Unraveled. 2008.
6. S. H. Yella, A. Stolcke, M. Slaney, and M. View, “Artificial Neural Network Features For Speaker Diarization Idiap Research Institute , CH-1920 Martigny , Switzerland,” pp. 402–406, 2014.
7. A. Slaby, “ROC analysis with Matlab,” Proc. Int. Conf. Inf. Technol. Interfaces, ITI, pp. 191–196, 2007. 8. C. Micheal, “The EM algorithm.” 1997.
9. G. Nasr, E. Badr, and C. Joun, “Cross Entropy Error Function in Neural Networks: Forecasting Gasoline Demand.,” FLAIRS Conf., pp. 381–384, 2002.
10. M. Huijbregts and F. De Jong, “Robust speech/non-speech classification in heterogeneous multimedia content,” Speech Commun., vol. 53, no. 2, pp. 143–153, 2011.
11. A. Martin, G. Doddington, T. Kamm, M. Ordowski, and M. Przybocki, “The DET Curve in Assessment of Detection Task Performance,” Proc. Eurospeech ’97, pp. 1895–1898, 1997.
I S S N 2 2 7 7 - 3 0 6 1 V o l u m e 1 6 N u m b e r 1 I N T E R N A T I O N A L J O U R N A L O F C O M P U T E R S & T E C H N O L O G Y
7572 | P a g e
12. M. Sinclair and S. King, “Where are the challenges in speaker diarization?,” ICASSP, IEEE Int. Conf. Acoust. Speech Signal Process. - Proc., pp. 7741–7745, 2013.
Author’ biography with Photo
Sukhvinder Kaur received the BE degree in Electronics and Electrical Communication Engineering from Punjab University, Chandigarh India in 1995 and M.Tech degee from Punjab Technical University in 2010. She is currently pursuing the Ph.D. degree at the Electronics and Communication Department , I K Gujral PTU, Kapurthala, Punjab, India Her research interests include multimedia indexing and automatic speaker diarization.