KYTC Maintenance Overview
and Budget Analysis
Report Number: KTC-17-21/SPR18-56-2-1F DOI: https://doi.org/10.13023/ktc.rr.2017.21
© 2018 University of Kentucky, Kentucky Transportation Center
Information may not be used, reproduced, or republished without KTC’s written consent.
Kentucky Transportation Center
College of Engineering, University of Kentucky Lexington, Kentucky in cooperation with
Kentucky Transportation Cabinet Commonwealth of Kentucky
The Kentucky Transportation Center is committed to a policy of providing equal
opportunities for all persons in recruitment, appointment, promotion, payment, training,
and other employment and education practices without regard for economic or social
status and will not discriminate on the basis of race, color, ethnic origin, national origin,
creed, religion, political belief, sex, sexual orientation, marital status, or age.
Research Report
KTC-17-21/SPR18-56-2-1F
KYTC Maintenance Overview and Budget Analysis
Nancy Albright, P.E.
Kentucky Transportation Center
Bryan Gibson, Ph.D.
Kentucky Transportation Center
and
Doug Kreis, Ph.D., P.E.
Kentucky Transportation Center
Kentucky Transportation Center
College of Engineering
University of Kentucky
Lexington, KY
in cooperation with the
Kentucky Transportation Cabinet
The contents of this report reflect the views of the authors, who are responsible for the facts and accuracy of the data presented herein. The contents do not necessarily reflect the official views or policies of the University of Kentucky, the Kentucky Transportation Center, the Kentucky Transportation Cabinet, the United States Department of Transportation, or the Federal Highway Administration. This report does not constitute a standard, specification, or regulation. The inclusion of manufacturer names or trade names is for identification purposes and should not be considered an endorsement.
1. Report No.
KTC-17-21/SPR18-56-2-1F 2. Government Accession No. 3. Recipient’s Catalog No
4. Title and Subtitle
KYTC Maintenance Overview and Budget Analysis 5. Report Date
6. Performing Organization Code
7. Author(s):
Nancy Albright, Bryan Gibson, and Doug Kreis 8. Performing Organization Report No. KTC-17-21/SPR18-56-2-1F
9. Performing Organization Name and Address
Kentucky Transportation Center College of Engineering
University of Kentucky Lexington, KY 40506-0281
10. Work Unit No. (TRAIS)
11. Contract or Grant No.
SPR-18-56-2
12. Sponsoring Agency Name and Address
Kentucky Transportation Cabinet State Office Building
Frankfort, KY 40622
13. Type of Report and Period Covered 14. Sponsoring Agency Code
15. Supplementary Notes 16. Abstract
The Kentucky Transportation Cabinet (KYTC) manages over 27,500 miles of the state’s roadways and is responsible for preserving many assets in a good state of repair, including bridges, traffic signals, lighting features, traffic signs, and guardrails. The Cabinet’s Maintenance function, which encompasses maintenance (e.g., patching potholes, repainting roadway lines and markings, cleaning bridges, mowing) and operations (e.g., plowing and salting roadways; keeping signs, traffic signals, and roadway signals functional), had a budget in FY 2018 of roughly $350 million. This report describes core maintenance functions and reviews their importance for preserving Kentucky’s roadway network and analyzes trends in KYTC’s maintenance budget. Among the maintenance issues explored are potholes; guardrails, signs, and striping; roadside vegetation; and winter operations (i.e., snow and ice removal). Without adequate maintenance funding, pressing maintenance issues are sometimes left unattended, which has negative consequences for the entire transportation network. Time trend analysis of KYTC’s maintenance budget indicates that inflation has reduced the purchasing power of funding allocated for maintenance activities. Forecasts suggest that its purchasing power will continue to decline through FY 2022. Winter maintenance operations, which vary significantly in scope and expense from year to year, can apply significant pressure to the Cabinet’s maintenance budget. In years with particularly severe winters, some maintenance activities are deferred because of the high cost of snow and ice removal. Accordingly, a starting point to improve maintenance outcomes is keeping maintenance funding on pace with inflation. Improving maintenance outcomes has many benefits, including extending the service lives of assets, eliminating potential safety hazards, and increasing traffic flow efficiency.
17. Key Words
maintenance, operations, snow and ice removal, financial analysis
18. Distribution Statement
Unlimited
19. Security Classification (report)
Unclassified
20. Security Classification (this page) Unclassified 21. No. of Pages 25 19. Security Classification (report)
Table of Contents
Table of Contents ... 3
Acknowledgements ... 4
Executive Summary ... 5
Chapter 1: Introduction ... 6
1.1 Overview... 6
1.2 Objectives ... 6
1.3 Structure of the Report ... 6
Chapter 2: Background ... 7
Chapter 3: Maintenance Budget ... 11
Chapter 4: Conclusion ... 22
Appendix ... 23
List of Figures
Figure 1: Average Maintenance Budget Spending — Fiscal Years 2015-2017 ... 12
Figure 2: Kentucky Construction Cost Index by Fiscal Year ... 13
Figure 3: Maintenance Budget and Total Lane Miles ... 14
Figure 4: Total Maintenance Spending on Interstates and Other NHS ... 15
Figure 5: Total Maintenance Spending on the Rest of the System... 16
Figure 6: Maintenance Spending Per Lane Mile on Interstates and Other NHS ... 17
Figure 7: Maintenance Spending Per Lane Mile on the Rest of the System ... 17
Figure 8: Snow and Ice Expenditures Compared with Average Snowfall... 18
Figure 9: Rural Secondary Maintenance Allotment ... 19
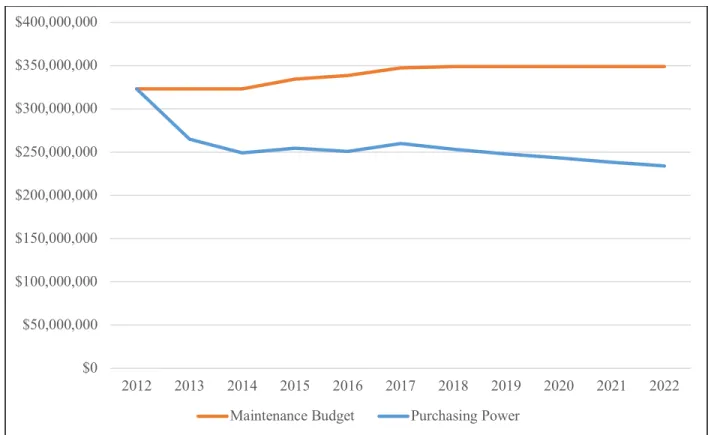
Figure 10: Maintenance Budget with Forecasts ... 20
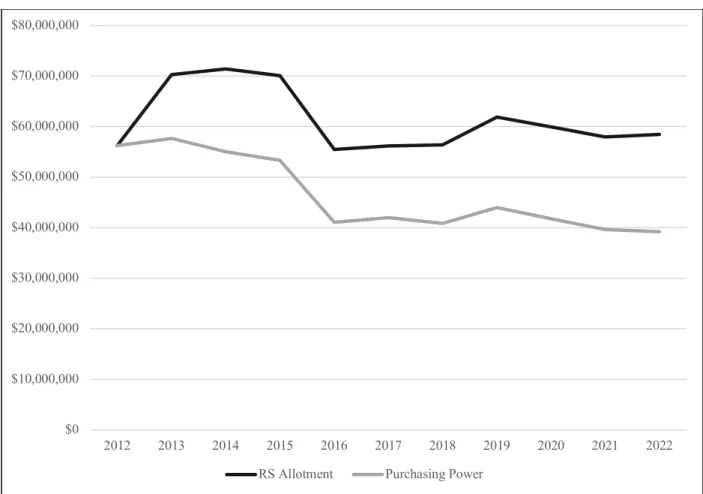
Figure 11: Rural Secondary Maintenance Allotment Forecasts ... 21
List of Tables
Table 1: Description of Maintenance Categories ... 12
Table 2: Kentucky Construction Cost Index Forecast Regression Results ... 25
Acknowledgements
The following individuals contributed greatly to the successful completion of this project through their participation on the Study Advisory Committee.
Jon Wilcoxson (co-chair) — Kentucky Transportation Cabinet Jason Siwula (co-chair) — Kentucky Transportation Cabinet
Executive Summary
The Kentucky Transportation Cabinet (KYTC) manages over 27,500 miles of the state’s roadways and is responsible for preserving many assets in a good state of repair, including bridges, traffic signals, lighting features, traffic signs, and guardrails. KYTC’s Maintenance function encompasses maintenance and operations. Maintenance is the routine care of infrastructure. Before KYTC rebuilds, rehabilitates, or performs preservation projects, it regularly executes fundamental tasks to optimize the highway network’s condition. Fundamental tasks include patching potholes, repainting roadway lines and markings, cleaning debris from water runoff ditches, washing salt off steel bridges, mowing, and picking up litter, among other activities. Operations refers to all tasks that keep highway traffic moving. Operational items include plowing and salting roadways; keeping signs, traffic signals, and roadway lighting in a state of good repair; removing dead animals in the roadway; and repairing damaged guardrails. Maintenance and operations are the responsibility of the Department of Highways’ Maintenance units, which include the Division of Maintenance, the Division of Traffic Operations and the district staffs dedicated to preservation. The Cabinet’s maintenance budget covers maintenance and operations for roadways, roadsides, and bridges — everything between the right-of-way boundaries. In FY 2018, roughly $350 million was budgeted for maintenance and operations.
This report describes core maintenance functions, reviews their importance for preserving Kentucky’s roadway network, and analyzes trends in KYTC’s maintenance budget. Among the maintenance responsibilities explored are potholes; guardrails, signs, and striping; roadside vegetation; and winter operations (i.e., snow and ice removal). Baseline spending for snow and ice removal typically accounts for nine percent of the overall maintenance budget — approximately $30 million. However, the cost of snow and ice removal varies significantly depending on how much frozen precipitation falls. For instance, during a severe winter that requires substantial winter operations (up to 27 percent of the maintenance budget), other activities that are part of roadway maintenance may see reduced funding, leading to lower service levels.
Without adequate funding, pressing maintenance issues are sometimes left unattended, negatively affecting the entire transportation network. Time trend analysis of KYTC’s maintenance budget indicates that inflation has reduced the purchasing power of funding allocated for maintenance activities. Forecasts suggest that its purchasing power will continue to decline through FY 2022. Accordingly, a starting point to improve maintenance outcomes is keeping maintenance funding on pace with inflation. Improving maintenance outcomes has many benefits, including extending the service lives of assets, eliminating potential safety hazards, and increasing traffic flow efficiency.
Chapter 1: Introduction
1.1 OverviewThe Kentucky Transportation Cabinet’s (KYTC) mission is to provide a safe, efficient, environmentally sound and fiscally responsible transportation system that delivers economic opportunity and enhances the quality of life in Kentucky.1 KYTC manages over 27,500 miles of roadway, the 8th largest state system in the country, and over 9,000 bridges, the 7th highest total. Additional assets include 200,000 acres of right of way as well as traffic signals, roadway lighting fixtures, traffic signs, guardrail, rest areas, and weigh stations as well as many cross drains, pavement markings, striping, and other features.
Annually, Kentucky’s transportation network carries over 800 million tons of freight valued at nearly $580 billion2. Each year drivers travel over 48 billion miles on Kentucky roads3 heading to school, work, running errands, and returning home. A robust maintenance program safeguards taxpayer-funded infrastructure by preserving the transportation network in a condition that facilitates safe and efficient travel for all of Kentucky’s residents. Additionally, the maintenance program helps ensure that current and prospective businesses have access to a reliable transportation system. Having access to a sound transportation system promotes economic growth by improving the competitiveness of businesses and opening up new job opportunities. KYTC is tasked with preserving the network and ensuring mobility and access; however, funding constraints and inflation limit the state maintenance budget’s purchasing power. Analysis in this report provides background on the various maintenance activities, detailed budgetary analysis, and budget projections for the next five years.
1.2 Objectives
The project has two objectives:
• Describe the core functions of Maintenance to internal and external audiences. • Assist KYTC in quantifying the need and importance of maintenance funding. 1.3 Structure of the Report
This report summarizes KYTC’s maintenance budget and its various components. Chapter 2 discusses the importance of maintenance for the transportation network and some unintended consequences of underfunding maintenance activities. Chapter 3 reviews the maintenance budget, expenditures across different road types, the impact of winter maintenance operations, and demonstrates how inflation has reduced purchasing power. Chapter 4 offers recommendations and conclusions.
1https://transportation.ky.gov/Pages/AboutUs.aspx 2 http://transportation.ky.gov/Planning/Documents/Freight%20Planning/Freight%20Plan/2016%20KYTC%20Freight %20Plan/KentuckyFreightPlan_ExecSummary_FINAL_Sept2016.pdf 3https://www.fhwa.dot.gov/policyinformation/statistics/abstracts/2015/state.cfm?loc=ky
Chapter 2: Background
KYTC’s Maintenance function encompasses maintenance and operations. Maintenance is the routine care of infrastructure. Before KYTC rebuilds, rehabilitates, or performs preservation projects, it regularly executes fundamental tasks to optimize the highway network’s condition. Fundamental tasks include patching potholes, repainting roadway lines and markings, cleaning debris from water runoff ditches, washing salt off steel bridges, mowing, and picking up litter, among other activities. Operations refers to all tasks that keep highway traffic moving. Operational items include plowing and salting roadways; keeping signs, traffic signals, and roadway lighting in a state of good repair; removing dead animals from the roadway; and repairing damaged guardrails. Maintenance and operations are the responsibility of the Department of Highways’ maintenance and operations units, which include the Division of Maintenance, the Division of Traffic Operations, and the district staffs dedicated to maintenance and operations.
Within KYTC’s Division of Maintenance, there are five branches that cover corresponding maintenance and operations activities: Bridge Preservation, Operations and Pavement Management, Roadway Maintenance, Roadside Maintenance, and Permits. Bridge Preservation manages bridge inspections, bridge repairs, weight restrictions, bridge maintenance, the management program, and evaluates bridges on the Extended Weight Coal Haul Program.4 Operations and Pavement Management is responsible for data collection that provides information on the condition of assets, system performance, and maintenance budget needs. Within this branch, programs include the Maintenance Rating Program (MRP), Operations Management System (OMS), Sign Management System (SMS), Pavement Management, and Intelligent Transportation Systems (ITS).5 Roadway Maintenance handles road maintenance contracts that cover a wide array of areas through the Contracting Section, Field Maintenance Section, and Traffic Section. Some of these include the statewide resurfacing program, pavement rehabilitation, new guardrail program, coordination of emergency and disaster work, slip and slide repair statewide coordination, statewide raised pavement markers and lenses, and statewide waterborne striping among others. Additionally, Roadway Maintenance work with district staff to review citizen concerns on state roadways.6 Roadside Maintenance handles the area between the road and the fence as well as winter weather response. The Roadside Environmental Team is responsible for coordinating vegetation management programs, rest areas, and snow and ice activities including salt, environmental waste management, and guardrail recycling. Additionally, they assist districts with setting up contracts for inmate crews to perform roadside management support along state rights-of-way.7 Finally, Permits reviews requests for road access and work on rights of way. They review and implement policies for utility installations; entrances; altering existing drainage facilities; replacing right-of-way fencing; locating facilities on rights of way; requests to conduct fairs, parades, festivals, banners, and welcome signs on rights of way; and new school site proposals on or near state roads. The Division of Traffic Operations also provides maintenance and operations management and support throughout the state. The three branches within the Division are Traffic Engineering, Systems Operations, and Traffic Design Services. The Traffic Engineering Branch provides statewide expertise and support for district requests regarding the proper application of traffic control devices and has primary responsibility for the development and implementation of the Highway Safety Improvement Program. The System Operations Branch is responsible for the development of traffic signal timing and communications systems
4http://transportation.ky.gov/Maintenance/Pages/Bridge-Maintenance.aspx 5http://transportation.ky.gov/Maintenance/Pages/Pavement-and-Operations.aspx 6http://transportation.ky.gov/Maintenance/Pages/Roadway-Maintenance.aspx 7http://transportation.ky.gov/Maintenance/Pages/Roadside-Maintenance.aspx
and processes the repair or replacement of all electronic traffic control devices while the Traffic Design Services Branch supports the development of traffic signal design plans.8
As the transportation network has grown, maintenance has become an integral part of keeping roads and bridges safe and in a state of good repair. With technological advancements redefining how transportation networks are maintained and managed, routine maintenance entails not only the regular upkeep of legacy networks, but also ensuring that new technologies are deployed effectively. Neglecting upkeep of assets until the only viable choices are to rehabilitate or replace them causes them to deteriorate more quickly. Routine care of infrastructure keeps it in better condition longer. The following examples illustrate the problems of neglecting proper maintenance.
Potholes are a critical safety hazard and create both maintenance and operations challenges. Potholes most often begin to form when water becomes trapped in pavement and breaks the pavement at a weak spot. Water is one of the fiercest enemies of the highway system; it can dislodge pavement foundations, work loose surface material free, and freeze/expand when trapped inside the pavement during cold weather, all of which enlarges potholes. Once the pavement breaks and the hole begins to form, the combined effects of traffic and water chip away at the edges of the pothole. Therefore, keeping water away from the pavement by regularly cleaning ditches and pipes is a critical maintenance activity. Water stays on, in, or under the pavement for various reasons including clogged pipes and ditches, base failures under the driving surface, surface rutting, and loss of appropriate superelevation. Routine maintenance of the pavement surface and the drainage structures can address these issues. Water can damage bridge surfaces and joints in a similar fashion. If these maintenance items are not regularly performed, the driving surface may deteriorate faster, requiring agencies to resurface them sooner. In 2015, 44 percent of interstates were in good condition while only 19 percent of parkways were in good condition.
Other elements of the transportation network that require close attention from maintenance personnel are guardrails, signs, and striping. Guardrails separate vehicles from roadside hazards. When they are damaged, they must be repaired quickly to ensure driver safety. Signs are ubiquitous along roadways, and motorists rely on them for information on state driving laws, potential hazards, and their destinations. Keeping them upright and legible is an important safety operational function. Likewise, pavement stripes convey critical driving information and need to be maintained to achieve sufficient visibility. Paint on the pavement wears off over time and in many instances stripes are repainted annually to meet federal guidelines.
Roadside vegetation poses an underappreciated maintenance challenge. Trees and grasses tend to be neglected because they are not an immediate threat. However, they present many problems when their growth is not kept under control. They block signs; create sight distance issues at intersections; and serve as wildlife habitat, which then increases the odds of animals lingering in the roadway. Many of the trees on the right of way are weed species and not particularly sturdy. They can fall into the roadway if exposed to high winds or heavy ice loads. Trees also create an operational issue in the fall. Green tunnels generated by the foliage offer a bit of pleasant scenery, but as leaves fall in autumn and become wet they create a driving hazard. Falling leaves also clog drains and gutters, trapping water on the pavement. Given the potential consequences of not trimming roadside vegetation, it is essential to remove or trim vegetation to protect the traveling public. But vegetation is not without its benefits. Its strong root structure helps prevent long-term erosion of cut and fill slopes. Poor vegetation in those areas destabilizes slopes, potentially triggering slides or rock falls. Therefore, an overall vegetation management system provides a balance of both needs.
Keeping roads free of snow and ice during the winter can account for a considerable portion of KYTC’s maintenance budget. Kentucky rarely has typical winters. The amount of snow and ice varies significantly from year to year and among locations throughout the state. KYTC attempts to have a policy that balances the high cost to prepare for harsher winters only seen every few years with the public safety threat of not being prepared to address most winter weather. Therefore, KYTC prepares for a “fixed cost” winter, setting up contracts for materials and support from contract trucks and drivers accordingly. In a mild winter, KYTC will set up contracts for salt purchases that may not be needed and contract trucks/drivers that are used sparingly. During mild winters, KYTC can carry over materials to the next fiscal year. KYTC maintains salt reserves, which can prove useful during both extremely mild and harsh winters. Because its contractual preparations are focused on average winter conditions, KYTC purchases a base amount of salt to ensure competitive prices and timely deliveries. In an extremely mild winter, KYTC has more deicing salt on hand than space to store it under cover. The backup facility in Louisville Underground offers additional space to store the material until it is needed. The downside of this arrangement is that while salt is a relatively inexpensive snow-fighting tool, the more it is handled the more expensive it becomes. That is, KYTC incurs costs when it moves salt to Louisville and when it retrieves that salt and transports it to a district.
In extremely snowy winters KYTC works to quickly acquire and distribute salt, but this is a complex logistics process. The Cabinet also transfers backup salt from the Louisville facility to district facilities as quickly as possible in between weather events. Existing staff and contractors work overtime to keep main roads and then secondary roads open and safe. Thus, harsh winters stretch KYTC’s limited resources. During years in which the Cabinet’s expenditures for winter operations increase and strain its budget, other routine maintenance activities must be delayed. When setting maintenance priorities in these years, items left unaddressed are those which do not present an immediate threat. However, these delays cannot persist indefinitely, as maintenance issues worsen over time. If left unattended for too long, they impair the state’s infrastructure and economy.
Bridge maintenance issues that appear minor can in fact have a major impact on a bridge’s life expectancy. Maintaining bridges in good or fair condition is more cost-effective than restoring them from a poor condition. Tasks such as cleaning drains, washing salt residue off steel, cleaning expansion joints, and clearing debris below the bridge can postpone deterioration significantly. Additional work patching decks and piers, greasing bearings, and repairing the protective paint extend by several years the length of time a bridge can remain in good or fair condition. Debris caught along the bridge deck can present problems because it traps water, clogs drains, and infiltrates expansion joints. As joints expand, contract, and move with traffic, water and debris can cause premature failure. Debris under a bridge can trap water next to the bridge foundations or change the direction and intensity of water flow, which may scour the surrounding bridge wingwalls and piers.
Given that bridges are designed to move slightly with traffic, if bearings and other components become rigid, it will no longer function as originally designed. This loss of flexibility can potentially accelerate the bridge deterioration. According to 2017 data, over four percent of the state’s bridges are substandard, meaning they had some posted limitation or restriction and were subject to more frequent inspections. Additional bridge maintenance may prevent bridges from becoming deficient, substandard, or encountering other maintenance issues.
As this chapter has demonstrated there are numerous maintenance and operations challenges confronting KYTC, but also a variety of maintenance activities that can prevent or mitigate accelerated deterioration of
the network and increase safety. The chapter also highlighted the breadth of responsibilities that KYTC’s maintenance and operations staff must manage as well as the importance of adequately funding maintenance. Failing to tackle certain maintenance activities can produce unintended consequences across the transportation network, including safety hazards, increased frequency of infrastructure replacement, and network disruptions. The next chapter explores the maintenance budget in more detail and further contextualizes the examples introduced in this chapter.
Chapter 3: Maintenance Budget
The maintenance budget is fundamentally different from the state construction budget. As a defined appropriation, it cannot be increased easily after it has been approved. Therefore, when costs begin to reach the authorized limit, maintenance activities are restricted. At this point, KYTC sets priorities to ensure that traffic continues to move safely and efficiently. As a result, some assets receive attention while lower priority activities are delayed.
This chapter explores various components of the maintenance budget in detail and presents future budget projections that account for inflation. The fiscal year (FY) 2017 maintenance budget totaled $347.5 million and the FY 2018 maintenance budget was $349 million. General Assembly House Bill 304, which covers appropriations for KYTC’s “operations, maintenance, support, and functioning,” allocated the following amounts for maintenance: “Included in the above Highways Road Fund appropriation is $347,457,900 in fiscal year 2016-2017 and $349,072,600 in fiscal year 2017-2018 for Highways Maintenance.”9
The maintenance budget covers maintenance and operations for roadways, roadsides, and bridges — everything between the right-of-way boundaries. Funding is spread across most of the duties for which KYTC’s maintenance and operations group is responsible for.
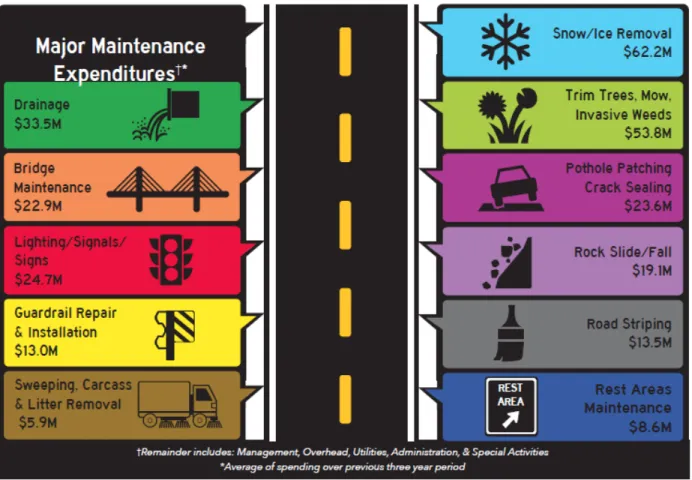
Figure 1 provides a breakdown of the maintenance budget. It shows average expenditures over the last three fiscal years and the potential impact of snow and ice expenditures on maintenance activities. Outside of extreme winter weather response, the maintenance budget allocates between $5 and $35 million statewide for different major activities, which are performed by state forces and contractors. More detail on the activities categorized in Figure 1 is available in Table 1. Each category has maintenance and/or operational needs beyond the spending indicated. Like the rest of the highway program, spending is constrained by available funding. These categories largely omit training and administrative functions and emergency response. They also do not include funding sources or activities that lie outside the maintenance function but which have an impact on the routine care of Kentucky’s infrastructure assets. For example, the federal bridge program and the state resurfacing budget address asset needs beyond routine maintenance but they do impact the routine maintenance needs of the state. In these and the rest of the state and federal construction programs, the maintenance and operations group coordinates it activities to minimize lost effort.
9
Figure 1: Average Maintenance Budget Spending — Fiscal Years 2015-2017 Table 1: Description of Maintenance Categories
Snow and Ice – Training driver simulations, calibrating equipment, preparing equipment for winter, in-house labor and equipment during winter storms, salt and calcium chloride materials, and payment for contractor support.
Drainage– Cleaning and repairing pipes under the pavement and under access points, cleaning culverts, reestablishing roadside ditches, and pump station maintenance.
Tree/Brush Trimming/Weed Control/Mowing – The pruning or removal of trees and shrubs along the right of way, treatment of stumps to prevent regrowth, and removal of trees that may originate off right-of-way but present a danger to the traveling public. Spraying for noxious weeds listed in and as required by KRS 176.051, spraying herbicide around guardrail, training and calibration on proper use of the pesticide equipment, and other spraying as needed for vegetation control, state forces and equipment as well as contractor support for mowing and trimming.
Bridge Maintenance – The equipment, labor and materials needed to complete minor repairs such as joint sealing, concrete patching, waterproofing, steel cleaning and patching, and cleaning debris on and around the structure (bridge inspection and larger maintenance projects are funded separately).
Pavement/Pothole Patching– This includes patching beyond potholes, such as strip patching and milling, for both the driving lanes and the shoulders.
Signs, Signals, and Lighting– The fabrication and installation of replacement sheeting and panel signs, either by state forces or contractors (does not include signs contained in construction contracts). Maintenance and operation of traffic signals and controllers, roadway lighting, overhead changeable message signs, navigation lighting, and aviation lighting.
Rockfall/Landslide – For minor rockfalls and landslides: the material, labor and equipment necessary to remove the debris, as well as protect and reestablish the slope (major slips and slides that require a geotechnical analysis will typically be funded separately).
Guardrail Repair and Installation – Repairs made to longitudinal guardrail, crash cushions and end
treatments by state forces or by contractors. Reimbursement is sought when the damage is the result of a known crash. However, those funds cannot be restored to the maintenance budget and are deposited to the general road fund instead. There is a small amount of funds set aside in the maintenance budget to install guardrail at locations where it does not exist.
Road Striping – the restriping work on the edge lines and lane lines.
Sweeping, Carcass and Litter Removal – Contractor payments, inmate crew support, removal of animal carcasses and other debris on the pavement, and sweeping debris from the roadways and shoulders.
Rest Areas – The custodial efforts and landscape management either by state forces or contractors and the inspection of work performed by contract (does not include utility expenses, larger repairs, and weigh station services).
To further contextualize the maintenance budget and changes in it and construction costs in recent years, we collected data from KYTC. Figure 2 shows changes in the Kentucky Construction Cost Index over the last ten years, which was developed and is updated annually by KYTC. The index uses average unit bid prices for each year to develop a metric that is used to track construction costs. The metric serves as a good proxy to understand the changing costs of activities, such as maintenance, which require many of the same materials. In Figure 2, the base year is FY 2012. While the index values fluctuate from year to year, overall growth between 2012 and 2017 was over 33 percent.
Figure 2: Kentucky Construction Cost Index by Fiscal Year 0.00% 20.00% 40.00% 60.00% 80.00% 100.00% 120.00% 140.00% 160.00% 2006 2007 2008 2009 2010 2011 2012 2013 2014 2015 2016 2017 In de x V alu es ; B as e Y ea r FY 20 12
Applying the construction cost index to the annual maintenance appropriation over the last five years demonstrates that inflation has diminished the maintenance budget’s purchasing power even as the number of lane miles the maintenance and operations group is responsible for has climbed by 521 miles (Figure 3). In FY 2017, the gap between the nominal maintenance budget and the inflation-adjusted maintenance budget exceeded $87 million.
Figure 3: Maintenance Budget and Total Lane Miles
Examining total spending and per mile spending on maintenance across road types clarifies the correlations between some of the qualitative observations outlined in Chapter 2. Road types are grouped into the following categories:
• Interstates
• Other National Highway System (NHS)
o Includes non-interstate routes that are part of the NHS (e.g., parkways) • Rest of the System
o Includes State Primary and Secondary Roads, which are Kentucky-designated routes, and Rural Secondary routes, which encompass urban arterials, farm-to-market routes, and other collectors
62,900 63,000 63,100 63,200 63,300 63,400 63,500 63,600 63,700 63,800 $0 $50,000,000 $100,000,000 $150,000,000 $200,000,000 $250,000,000 $300,000,000 $350,000,000 $400,000,000 2012 2013 2014 2015 2016 2017 La ne M ile s
Figure 4 shows total spending on Interstates and Other National Highway System roads along with inflation-adjusted values.
Figure 4: Total Maintenance Spending on Interstates and Other NHS $5,000,000 $10,000,000 $15,000,000 $20,000,000 $25,000,000 2012 2013 2014 2015 2016
Interstates Interstates Purchasing Power
Other NHS Other NHS Purchasing Power
$5,000,000 $10,000,000 $15,000,000 $20,000,000 $25,000,000 2012 2013 2014 2015 2016
Interstates Interstates Purchasing Power
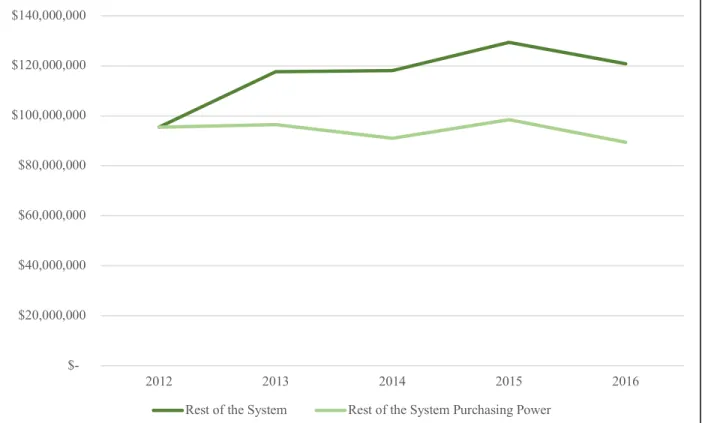
Figure 5 shows maintenance spending for the Rest of the System. This portion of maintenance spending greatly exceeds the amount dedicated to Interstates and Other NHS. In FY 2016, total spending for maintenance on Interstates, Other NHS, and the Rest of the System totaled $10.1 million, $17 million, and $120.8 million, respectively. Inflation adjustments accentuate the impact of inflation on purchasing power. By FY 2017, the gap on Interstates was $2.6 million, $4.4 million for Other NHS, and the Rest of the System was $32.4 million.
Figure 5: Total Maintenance Spending on the Rest of the System
For additional perspective, Figure 6 and Figure 7 present spending on a per lane mile basis. In terms of total spending, the Rest of the System is far greater than Interstates and Other NHS. On a per lane mile basis, however, Interstates usually outpace Other NHS and the Rest of the System due to those roads requiring more maintenance dollars per lane mile because they carry greater traffic loads and figure more centrally in the network. Traditionally, more on a per mile basis has been spent on Other NHS than the Rest of the System roads, although in recent years spending levels have tilted more in favor of the Rest of the System. In both figures, the impacts of inflation as measured by the Kentucky Construction Cost Index are apparent.
$20,000,000 $40,000,000 $60,000,000 $80,000,000 $100,000,000 $120,000,000 $140,000,000 2012 2013 2014 2015 2016
Figure 6: Maintenance Spending Per Lane Mile on Interstates and Other NHS
Figure 7: Maintenance Spending Per Lane Mile on the Rest of the System $500 $1,000 $1,500 $2,000 $2,500 $3,000 $3,500 2012 2013 2014 2015 2016
Interstates Interstates Purchasing Power Other NHS Other NHS Purchasing Power
$500 $1,000 $1,500 $2,000 $2,500 $3,000 2012 2013 2014 2015 2016
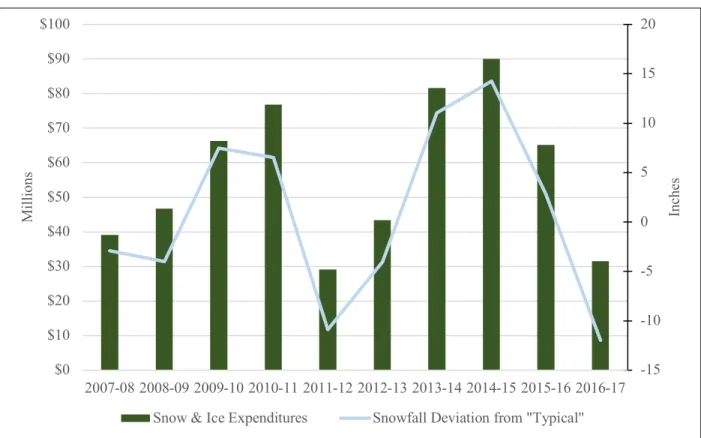
The cost of snow and ice removal varies significantly depending on how much frozen precipitation falls. During a severe winter that requires significant winter operations, other activities that are part of roadway maintenance may see reduced funding, leading to lower service levels. Figure 8 plots total winter operations expenditures against deviations from ‘average snowfall’. To derive ‘average snowfall’, we collected data on annual snowfall totals from National Weather Service stations in Louisville, Lexington, Bowling Green, Boone County, Flemingsburg, Paducah, and Booneville. Snowfall amounts were then averaged for each year and then the totals were averaged from 2006-2017 to generate an approximate measure of statewide average snowfall. The difference in snow for each year was then calculated (see Figure 8). Expenditures track relatively closely with snowfall deviations. Regardless of whether snow falls, as noted in Chapter 2, KYTC must be prepared for winter operations. Baseline spending for snow and ice removal typically accounts for nine percent of the overall maintenance budget — approximately $30 million.
Figure 8: Snow and Ice Expenditures Compared with Average Snowfall
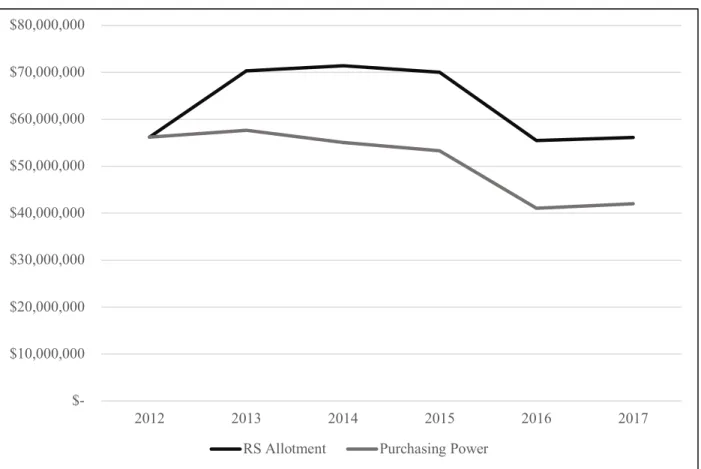
Along with the transportation budget’s funding for interstates, primary, and secondary roads, the Rural Secondary (RS) Program allocates some funds to maintain the RS system. The RS Program is part of Revenue Sharing, and in General Assembly House Bill 304 the following amounts are allocated to the entirety of the program: “Included in the above Road Fund appropriation is $151,757,600 in FY 2016-2017 and $152,312,600 in FY 2017-2018 for the Rural Secondary Program in accordance with KRS 177.320, 177.330, 177.340, 177.350, and 177.360.”10 The Appendix contains language from the Kentucky Revised Statutes for each of these items. After administrative and emergency funds are encumbered, about 37 percent of the amount collected for the RS program is sent to maintenance. For FY 2017, total RS Program funding for maintenance totaled $56.1 million. Figure 9 shows the annual RS allotments for maintenance.
10 http://transportation.ky.gov/Budget-and-Fiscal-Management/Documents/General%20Assembly%20House%20Bill%20304.pdf -15 -10 -5 0 5 10 15 20 $0 $10 $20 $30 $40 $50 $60 $70 $80 $90 $100 2007-08 2008-09 2009-10 2010-11 2011-12 2012-13 2013-14 2014-15 2015-16 2016-17 In ch es Mi lli on s
The numbers were adjusted for inflation using the Kentucky Construction Cost Index. By 2017, the loss in purchasing power attributable to inflation exceeded $14 million.
Figure 9: Rural Secondary Maintenance Allotment
The construction cost index (Figure 2) reveals an upward overall trend in the data, which indicates that time trend forecast models would capture historical patterns. To measure potential future impacts of costs on the maintenance budget, we developed forecasts for the Kentucky Construction Cost Index. Linear time trend and trend-squared models fitted using a regression to the index values from 2006-2017 displayed a pattern of continued growth in construction costs in Kentucky. Using a time trend regression for forecasting is a simple technique, and given the upward trajectory of historical costs, it may be the most reliable approach. Under this approach, previous index values are regressed on a time variable, either representing a year, or a year and a year-squared variable. This approach captures variability in the cost index over time and enables the development of projections based on historical index trends. Table 2 in the Appendix lists regression coefficients while Table 3 contains projected values over the next five years and an average of the two forecast models. By 2022, the index is forecast to grow 51 percent (trend) or 47 percent (trend-squared) over 2012.
Assuming no increases in the maintenance budget appropriation from FY 2018 onward, and using the average projected construction cost index values to account for inflation, the purchasing power gap continues to widen (Figure 10). The difference between the nominal maintenance budget appropriation and the inflation-adjusted appropriation including the forecast values grows to $115 million by 2022.
$10,000,000 $20,000,000 $30,000,000 $40,000,000 $50,000,000 $60,000,000 $70,000,000 $80,000,000 2012 2013 2014 2015 2016 2017
Figure 10: Maintenance Budget with Forecasts
RS allotments for maintenance were forecast through 2022 (Figure 11). Rather than assuming a flat budget moving forward (since the RS allotment for maintenance hinges on fuel taxes, not appropriations), a five-year moving average was employed to estimate future RS allotments. Using the average forecast values of the Kentucky Construction Cost Index (Table 3), the RS allotments adjusted for inflation were forecast through 2022 as well. By 2022, the difference between the allotment and inflation-adjusted allotment is anticipated to surpass $19 million.
$0 $50,000,000 $100,000,000 $150,000,000 $200,000,000 $250,000,000 $300,000,000 $350,000,000 $400,000,000 2012 2013 2014 2015 2016 2017 2018 2019 2020 2021 2022
Figure 11: Rural Secondary Maintenance Allotment Forecasts
Examining the maintenance budget and RS allotment in the context of inflation confirms the erosion in purchasing power over time. Given the many activities maintenance dollars are spent on and the impact of winter operations, maintenance dollars are being spread thin. Funding shortfalls result in some activities being deferred, which can lead to longer-term issues such as shorter asset lifecycles, potential safety hazards, and declining infrastructure condition.
$0 $10,000,000 $20,000,000 $30,000,000 $40,000,000 $50,000,000 $60,000,000 $70,000,000 $80,000,000 2012 2013 2014 2015 2016 2017 2018 2019 2020 2021 2022
Chapter 4: Conclusion
KYTC’s maintenance function is critical for ensuring that the transportation network operates in a safe and effective manner. This report summarized key points about essential maintenance activities and noted that maintenance is a broad category, covering many activities aside from those that may immediately come to mind, such as repairing potholes and mowing. According to TRIP, Kentucky drivers incur $4 billion in costs each year from driving on poor roads and suffering through congestion.11 Many of these issues can be mitigated through maintenance activities, as performing routine maintenance keeps roads and bridges in a state of good repair over longer periods.
Our budgetary analysis demonstrated that inflation (as measured by the Kentucky Construction Cost Index) has steadily eroded the purchasing power of the maintenance budget and RS allotment for maintenance over time. Looking ahead, the decline in purchasing power is forecast to worsen, even if modest increases in funding are programmed for maintenance. In 2017, the total for the combination of the maintenance budget and the RS allotment to maintenance was $404 million. However, the purchasing power gap for both the maintenance budget and the RS allotment topped $100 million. By 2022, that gap is expected to grow to $134 million. Working to ensure that maintenance funding keeps pace with inflation is a starting point for improving maintenance outcomes.
Improving maintenance outcomes can result in several benefits: • Streamlines freight movement
• Improves driver experience
• Addresses potential safety issues in a timely manner • Lengthens asset life
• Reduces demand for costly replacement projects • Improves traffic flow with fewer construction zones
• Better pavement conditions leads to optimal operating speeds
By improving maintenance outcomes, KYTC will be able to better serve the state’s transportation needs and ensure that the transportation network remains an engine of economic growth that facilitates safe and efficient travel.
Appendix
177.320 Use of portion of gasoline tax revenues for secondary and rural roads,
county roads and bridges and the Kentucky Transportation Center -- Allocation of funds. (1) Twenty-two and two-tenths percent (22.2%) of all funds arising from the imposition of taxes provided by KRS 138.220(1) and (2), 138.660(1) and (2) and 234.320 shall be set aside for the construction, reconstruction and maintenance of secondary and rural roads and for no other purpose, and shall be expended for said purposes by the Transportation Cabinet of the
Commonwealth of Kentucky according to the terms and conditions prescribed in KRS 177.330 to 177.360.
(2) On or after July 1, 1980, eighteen and three-tenths percent (18.3%) of all funds arising from the imposition of taxes provided by KRS 138.220(1) and (2),
138.660(1) and (2), and 234.320 shall be set aside for the construction, reconstruction and maintenance of county roads and bridges provided by KRS 179.410 and 179.415.
(3) All funds set aside in subsection (2) of this section for the construction, reconstruction and maintenance of county roads and bridges shall be allocated to the county in accordance with the formula established in KRS 177.360(1) pursuant to KRS 179.410.
(4) On or after July 1, 1986, one-tenth of one percent (0.1%) of all funds arising from the imposition of taxes provided by KRS 138.220(1) and (2), 138.660 and 234.320 shall be set aside for the purposes and functions of the Kentucky Transportation Center as established by KRS 177.375 to 177.380, except that the receipts provided to the center by this subsection shall not exceed one hundred ninety thousand dollars ($190,000) for any fiscal year. 177.330 Consultation by Department of Rural and Municipal Aid with fiscal courts
for selection of roads to be improved -- Recommendations -- Road through city with population of less than 3,000.
(1) At least once in each calendar year, the Department of Rural and Municipal Aid, through a duly authorized representative, shall consult with the fiscal courts of the various counties for the purpose of receiving recommendations from the fiscal courts for the selection of rural and secondary roads lying within the counties for construction, reconstruction, or maintenance under the Rural and Secondary Road Program as set forth in KRS 177.320(1). The Department of Rural and Municipal Aid may receive recommendations from any citizen on the selection of rural and secondary roads for construction, reconstruction, or maintenance under the Rural and Secondary Road Program. The Department of Highways shall notify each county fiscal court of the county roads that the department intends to construct, reconstruct, or maintain in accordance with the provisions of KRS Chapters 177 and 179.
(2) Where the construction of a secondary or rural road through an incorporated city with a population of less than three thousand (3,000) based upon the most recent federal decennial census is necessary, as determined by the Department of Rural and Municipal Aid, the road may be constructed, reconstructed, or maintained at the discretion of the Department of Rural and Municipal Aid.
177.340 Selection of roads to be improved in case of disagreement with fiscal court -- Roads become part of state highway system.
If, within thirty (30) days after consulting with a fiscal court, the Department of Rural and Municipal Aid and the fiscal court fail to agree on the selection of any rural and secondary roads for construction, reconstruction, or maintenance under the Rural and Secondary Road
any road, which, in its discretion, is essential to a system of secondary highways. Rural and secondary roads constructed, reconstructed, or maintained in accordance with an agreement between the affected county and the Department of Rural and Municipal Aid, or selected for construction, reconstruction, or maintenance by the Department of Rural and Municipal Aid, at its discretion, without agreement with the affected county, may become a part of the highway system of the Commonwealth of Kentucky at the discretion of the Department of Highways.
177.350 Standards for construction and improvement of state-maintained
secondary and rural roads -- Studies -- Surveys -- Maps -- Personnel -- Equipment. The Department of Rural and Municipal Aid may promulgate administrative regulations pursuant to KRS Chapter 13A to establish standards for the construction, reconstruction, maintenance, and improvement of rural and secondary roads in the Commonwealth of Kentucky. The department shall conduct studies, make surveys, prepare maps, employ
personnel, and obtain equipment as may be necessary for the establishment and maintenance of an integrated system of secondary and rural roads in the Commonwealth
of Kentucky.
177.360 Allocation of funds for state-maintained roads -- Apportionments to be
made on basis of revenue estimates -- Uniform financial information report required. (1) Except as provided in subsection (5) of this section, the Department of Rural and Municipal Aid shall allocate the funds set apart under KRS 177.320(1) for construction,
reconstruction, and maintenance of state-maintained secondary and rural highways as follows: (a) One-fifth (1/5) shall be apportioned equally among the one hundred twenty
(120) counties.
(b) One-fifth (1/5) shall be apportioned among the one hundred twenty (120) counties on the basis of the ratio which the rural population of each county bears to the total rural population of the state. "Rural population" as used here means the population in a county outside cities, towns, and urban areas having a population of twenty-five hundred (2,500) or more as shown by the most recent decennial census of the United States Bureau of the Census, and county population shall be determined by the most recent decennial census of the United States Bureau of the Census.
(c) One-fifth (1/5) shall be apportioned among the one hundred twenty (120) counties on the basis of the ratio that the public road mileage outside of cities, towns, and urban areas having a population of twenty-five hundred (2,500) or more bears to the total mileage of such roads for the entire state.
(d) Two-fifths (2/5) shall be apportioned among the one hundred twenty (120) counties on the basis of the ratio which the square-mile rural area of the county bears to the total square-mile rural area of the state. "Rural area" as used here means that area of the county outside of cities, towns, and urban areas having a population of twenty-five hundred (2,500) or more and shown by the most recent decennial census of the United States Bureau of the Census.
(2) A sum not exceeding six percent (6%) of the allocation provided by KRS
177.320(1) to each county shall be deducted at the beginning of each fiscal year and adjusted quarterly to cover the maintenance, administrative, engineering, and other costs of the program. (3) Of the total amount apportioned by the provisions of this section, a sum not exceeding six percent (6%) may be deducted and placed by the Department of Rural and Municipal Aid in a special emergency account to be expended at the direction of the commissioner to meet unforeseen emergencies on rural and secondary roads and bridges.
(4) Apportionments as required by the provisions of this section shall be made on the basis of revenue estimates supplied by the Finance and Administration Cabinet and adjusted quarterly in accordance with the most recent revision of the estimates by the Finance and Administration Cabinet.
(5) Any county eligible to receive county road aid moneys in accordance with KRS 177.320 and this section shall be required to submit a uniform financial information report to the Department for Local Government in accordance with KRS 65.905 before any payment of county road aid funds shall be made. The Department for Local Government shall notify the Department of Rural and Municipal Aid no later than March 1 annually of any county that has not submitted a uniform financial information report. The Department of Rural and Municipal Aid shall, upon notification by the Department for Local Government, immediately suspend all county road aid moneys to the county until the county complies with the provisions of KRS 65.900 to 65.925 and submits the uniform financial information report to the Department for Local Government. The Department for Local Government shall immediately notify the Department of Rural and Municipal Aid to reinstate county road aid moneys to any county affected by this subsection as soon as the county submits the uniform financial information report.
Table 2: Kentucky Construction Cost Index Forecast Regression Results
Year Year ^2 Constant Observations R-squared
Trend Model 0.0314*** (0.009) 0.977*** (0.065) 12 0.56 Trend ^2 Model 0.036 (0.040) -0.0003 (0.003) 0.967*** (0.114) 12 0.56
Table 3: Forecasted Values of the Kentucky Construction Cost Index Year Trend Trend^2 Average
2018 138.51% 137.44% 137.97% 2019 141.65% 140.11% 140.88% 2020 144.79% 142.71% 143.75% 2021 147.93% 145.25% 146.59% 2022 151.07% 147.73% 149.40%