UNIVERSITY COLLEGE LONDON
System Modelling and Optimisation
Studies of Fuel Cell Based micro-CHP
for Residential Energy Demand
Reduction
Alexandros Adam
A thesis submitted in fulllment of the degree of
Doctor of Philosophy
Declaration of Authorship
I, Alexandros Adam conrm that the work presented in this thesis is my own. Where information has been derived from other sources, I conrm that this has been indic-ated in the thesis.
Signed: Date:
Acknowledgements
I would like to express my deepest gratitude for the help and guidance received by my supervisors Prof. Eric S. Fraga and Prof. Dan J.L Brett throughout my PhD: Eric for introducing me to the amazing world of mathematical modelling but especially for his approach of analysing situations. Dan for sharing his in depth knowledge of the theory of fuel cells and for all the fun times in the Christmas parties.
There is a number of people that I would like to thank that helped me in various ways. Maria-Christina, who is always close to me, encouraging me and supporting my decisions. My parents Michalis and Anna for providing the continuous support over the years of my studies. Also thank you to the people in the PPSE room, Cristian, Asif, Shade for having great times in and outside the oce.
I would also like to thank Elisabeth Ness, a former Crest Nicholson employee, for the interest she showed in my work. She happily organised a site visit for me to witness a fuel cell micro-CHP system in operation in a Crest Nicholson test site in Epsom. Finally, I would like to express my graditute to Georgios Mantas, a mathematics teacher who was an inspirational gure to me during my school times.
This research was made possible by EPSRC support for the London-Loughborough Centre for Doctoral Research in Energy Demand, grant number EP/H009612/1 and EPSRC funding support of the Electrochemical Innovation Lab via EP/G030995/1 and EP/I037024/1.
Abstract
Fuel cell combined heat and power (CHP) units used for domestic applications can provide signicant cost and environmental benets for end users and contribute to the UK's 2050 emissions target by reducing primary energy consumption in dwellings. Recently there has been increased research interest in the use of modelling methods for the design of such systems and their smoother integration with domestic building services. Several models in the literature, whether they use a simulation or an optim-isation approach, ignore the dwelling side of the system and optimise the eciency or delivered power of the unit. However the design of the building services is linked to the choice of heating plant and its characteristics.
Adding the dwelling's energy demand and temperature constraints in a model can produce more general results that can optimise the whole system, not only the micro-CHP unit. The fuel cell has a number of heat streams that can be utilised to satisfy heat demand in a dwelling and the design can be dierent according to the heat used from each heat stream.
Firstly a mixed integer non-linear (MINLP) programming mathematical model was developed to provide all high level information for the design and sizing the plant of each conguration examined. Next, a MINLP model that can handle multiple heat sources and demands is presented. The model can provide a design that integrates the temperature and water ow constraints of a dwelling's heating system with the heat streams within the fuel cell processes while optimising total CO2 emissions.
The model is demonstrated through dierent case studies that attempt to capture the variability of the housing stock.
This research represents a signicant step towards an integrated fuel cell micro-CHP and dwelling design.
Contents
Contents 4
List of Figures 9
List of Tables 17
1 Introduction 24
1.1 Introduction to the Project . . . 24
1.2 Project Motivation . . . 25
1.3 Outline of the Thesis . . . 26
2 Background 27 2.1 Overview of the UK Energy System . . . 27
2.2 Household Energy Demand . . . 30
2.2.1 Energy Assessment of Buildings . . . 32
2.3 Domestic Micro-CHP . . . 33
2.4 Fuel Cell Technology . . . 34
2.4.1 Overview of Fuel Cell Technologies . . . 34
2.4.2 Fuel Cell Operation . . . 36
2.4.3 Fuel Cell Eciency . . . 39
2.5 Fuel cell micro-CHP system design . . . 40
2.5.1 Fuel Processing . . . 41
2.5.3 Heat Management . . . 42
2.5.4 Controls . . . 43
2.6 Fuel cell micro-CHP Products . . . 43
2.7 Fuel cell micro-CHP Cost . . . 44
2.8 Policy and Field Trials . . . 46
2.9 Thermal Comfort and Heating Systems . . . 47
3 Previous Work 52 3.1 Modelling Fuel Cell micro-CHPs for domestic applications . . . 52
3.1.1 Modelling Processes and Methods . . . 53
3.1.2 Modelling Results . . . 55
3.1.3 Concluding remarks . . . 56
4 Options for Residential Building Services Design Using Fuel Cell Based Micro-CHP 57 4.1 The potential for integration with building services . . . 57
4.2 Heat recovery in fuel cell micro-CHPs systems . . . 60
4.2.1 Heat recovery options in PEMFC systems . . . 62
4.2.1.1 Fuel Cell Stack . . . 62
4.2.1.2 Afterburner and Exhaust gases . . . 62
4.2.1.3 Fuel Processor . . . 63
4.2.2 Heat recovery options in SOFC systems . . . 63
4.2.3 PEMFC and SOFC dierences in terms of heat recovery . . . 64
4.3 Design options for integration for fuel cell based micro-CHP . . . 64
5 Reference Building and Dwelling Energy Data 66 5.1 Reference Building . . . 66
5.2 Dwelling Energy Data . . . 71
5.2.1 House A - Part L Building . . . 73
5.2.1.2 Radiator System . . . 75
5.2.2 House B - Typical UK Dwelling . . . 77
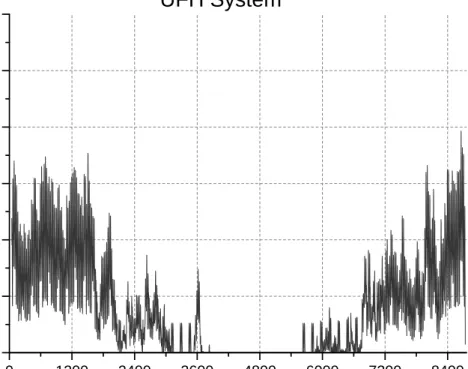
5.2.2.1 UFH System . . . 77
5.2.2.2 Radiator System . . . 78
5.3 Datasets for Modelling . . . 79
5.4 Summary of Results . . . 81
5.5 Concluding Remarks . . . 81
6 Model 1 - An MINLP model for high level evaluation of a SOFC micro-CHP design in dwellings 82 6.1 Optimisation methods in energy systems . . . 82
6.2 Problem Statement . . . 84
6.3 Basis for the Model . . . 84
6.4 Modelling Methodology . . . 85
6.4.1 Submodels . . . 85
6.4.1.1 Fuel Cell . . . 85
6.4.1.2 Gas Boiler . . . 86
6.4.1.3 Thermal Storage Tank . . . 87
6.4.1.4 Thermal balance . . . 88
6.4.1.5 Electricity balance . . . 88
6.4.1.6 Total SystemCO2 emissions . . . 89
6.5 Formulation and Solution Approach . . . 89
6.5.1 Equations Transformation . . . 92
6.6 Modelling Results . . . 95
6.6.1 Winter Day Analysis . . . 95
6.6.1.1 Case 1 . . . 95
6.6.1.2 Case 2 . . . 99
6.6.2 Summer day analysis . . . 104
6.6.2.2 Case 4 . . . 108
6.6.3 Combined 48-hour Dataset . . . 114
6.6.3.1 Case 5 . . . 114
6.6.3.2 Case 6 . . . 118
6.6.4 Summary of Results . . . 123
6.7 Discussion and Critical Analysis . . . 124
6.8 Limitations of the study . . . 126
6.9 Concluding Remarks . . . 127
7 Model 2 - An MINLP model for PEMFC based micro-CHP design in dwellings 128 7.1 Problem Statement . . . 128
7.2 Basis for the PEMFC Model . . . 129
7.3 Modelling Methodology . . . 129
7.3.1 Submodels . . . 132
7.3.1.1 Fuel Cell Stack . . . 132
7.3.1.2 Reformer . . . 133
7.3.1.3 Afterburner . . . 135
7.3.1.4 Gas Boiler . . . 136
7.3.1.5 Thermal Storage Tank . . . 138
7.3.1.6 Pipe network and Heat Emitters . . . 140
7.3.1.7 Electricity Energy Balance . . . 142
7.3.1.8 Total SystemCO2 emissions . . . 142
7.4 Formulation and Solution Approach . . . 143
7.5 Modelling Results . . . 148
7.5.1 Part L Dwelling Designed with UFH . . . 148
7.5.1.1 Case 1 . . . 148
7.5.1.2 Case 2 . . . 156
7.5.1.3 Variation 1 - The eect of applying a dierent tem-perature constraint on the storage model . . . 163
7.5.1.4 Comparative Results . . . 165
7.5.2 Part L Dwelling Designed with Radiators . . . 168
7.5.2.1 Case 3 . . . 169
7.5.2.2 Variation 2 - The eect of the minimum modulation of the gas boiler . . . 174
7.5.2.3 Case 4 . . . 176
7.5.2.4 Comparative Results . . . 186
7.5.3 Part L Dwelling - Electricity Exporting Scenarios . . . 187
7.5.3.1 Case 5 . . . 188
7.5.3.2 Case 6 . . . 189
7.5.4 House B -Typical UK Dwelling . . . 191
7.5.4.1 Case 7 . . . 191
7.6 Discussion and Critical Analysis . . . 194
7.7 Limitations of the study . . . 198
7.8 Concluding Remarks . . . 199
8 Conclusions and Future Directions 200 8.1 Summary of Contribution . . . 200
8.2 Implications for fuel cell micro-CHP system design . . . 201
8.3 Recommendations for future work . . . 202
Bibliography 204
List of Figures
2.1.1 Production and Consumption of Primary Fuels in the UK in 2013 ( [48]) . . . 28 2.1.2 Energy Consumption by fuel in the UK from 1970 to 2013 ( [49]) . . 28 2.1.3 Sankey Diagram of UK Energy System in 2013 ([43]) . . . 29 2.2.1 UK Domestic sector fuel mixture ([46]) . . . 31 2.2.2 UK domestic nal energy consumption by end user since 1970 ([46]) 32 2.3.1 Simplied diagram of a CHP system showing energy ows . . . 34 2.4.1 Fuel Cell Basic Operation ( [65]) . . . 35 2.4.2 Graph showing the voltage of an average PEMFC fuel cell against the
current density, illustrating the energy losses that occur . . . 38 2.4.3 Graph showing the power output of an average PEMFC fuel cell
against the current density . . . 39 2.4.4 Graph showing the electrical, thermal and total eciency of an SOFC
in relation to the load factor [73] . . . 40 2.5.1 Schematic Diagram of fuel cell micro-CHP components ([125]) . . . 41 2.6.1 Images of fuel cell micro-CHP products [34, 113] . . . 44 2.9.1 Images of Radiator and Underoor Heating System ([112],[124]) . . 49 2.9.2 Simplied Schematic of Combi Boiler . . . 50 2.9.3 Simplied Schematic of Gas Fired Boiler and DHW Storage Tank . . 51 2.9.4 Schematic showing the operation of a low loss header illustrating
primary and secondary circuits [2]. . . 51 4.1.1 Storage Tank for use in a micro-CHP system ([31]) . . . 58
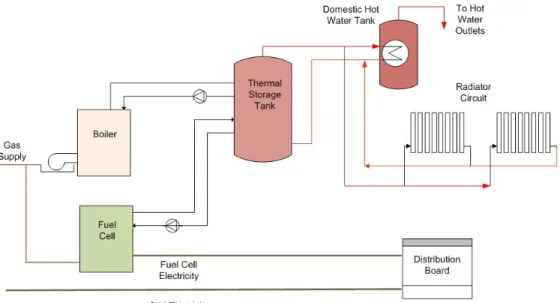
4.1.2 Simplied Schematic Diagram of Fuel Cell micro-CHP system - Con-guration 1 - Thermal Storage Tank Present . . . 59 4.1.3 Simplied Schematic Diagram of Fuel Cell micro-CHP system -
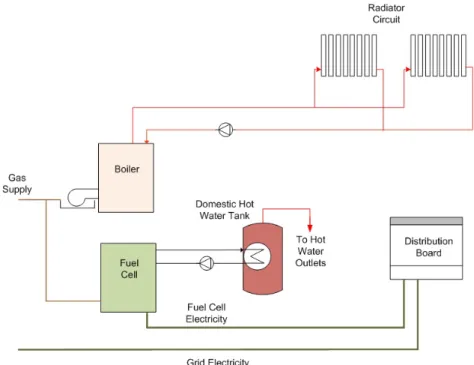
Con-guration 2 - Without Thermal Storage Tank . . . 59 4.1.4 Simplied Schematic Diagram of Fuel Cell micro-CHP system -
Con-guration 3 - Fuel cell serves DHW . . . 60 4.2.1 Schematic illustration of a PEMFC micro-CHP system showing
op-tions for heat recovery. [2] . . . 61 4.2.2 Schematic illustration of a SOFC micro-CHP system showing options
for heat recovery. . . 64 4.3.1 Schematic diagram of fuel cell micro-CHP design for a dwelling . . . 65 5.1.1 Daily prole of the occupancy ratio (reproduced from IES VE [87]) . 68 5.1.2 Daily prole showing the internal set-point temperature (reproduced
from IES VE [87]) . . . 68 5.1.3 Image showing the structure of the 3D model. This image is used
to illustrate the process of creating the structure of the model which is using series of rectangular blocks to develop the nal shape of the building. . . 70 5.1.4 Image showing the exterior of the 3D model . . . 70 5.2.1 Graph representing the 24-hour heat demand for DHW pattern for
the reference dwelling. The graph shows the relation between the occupancy, which is high in the morning and in the evening hours, and the DHW demand. . . 72 5.2.2 Graph representing the weekly electricity demand for House A. This
weekly electricity pattern repeats throughout the year and peaks in the weekends. . . 73 5.2.3 Graph representing the demand of the base case for House A served
by an underoor heating system . . . 74 5.2.4 Graph representing the winter space heating demand of the base case
for House A served by a underoor heating system on a 24-hour seg-ment of the complete annual dataset . . . 75 5.2.5 Graph representing the demand of the base case for House A served
5.2.6 Graph representing the winter heating demand of the base case for House A served by a radiator system on a 24-hour segment of the
complete 8760 hour dataset . . . 77
5.2.7 Graph representing the demand of the base case for House B served by an underoor heating system . . . 78
5.2.8 Annual variation of heating load for House B . . . 79
6.3.1 Basic structure of the model . . . 85
6.4.1 Thermal Storage Tank energy ows in model 1 . . . 88
6.5.1 Linearisation of the electrical eciency ηf c,ele(t)of an SOFC showing cutting points . . . 94
6.5.2 Linearisation of the thermal eciencyηf c,heat(t)of an SOFC showing cutting points . . . 94
6.6.1 Graph representing the load factor of the fuel cell micro-CHP and auxiliary boiler for Case 1 . . . 96
6.6.2 Graph representing the electrical and thermal eciencies of the fuel cell micro-CHP for Case 1 . . . 97
6.6.3 Graph representing the electricity output of the fuel cell micro-CHP and grid electricity for Case 1 . . . 98
6.6.4 Graph representing the heat output of the fuel cell micro-CHP and auxiliary gas boiler for Case 1 . . . 99
6.6.5 Graph representing the load factor of the fuel cell micro-CHP and auxiliary boiler for Case 2 . . . 100
6.6.6 Graph representing the electrical and thermal eciencies of the fuel cell micro-CHP and auxiliary boiler for Case 2 . . . 101
6.6.7 Graph representing the electricity output of the fuel cell micro-CHP and grid electricity for Case 2 . . . 101
6.6.8 Graph representing the heat output of the fuel cell micro-CHP and auxiliary boiler for Case 2 . . . 102
6.6.9 Graph representing the heat output from the thermal storage tank to the house for Case 2 . . . 103
6.6.10 Graph representing the heat content of the thermal storage tank for Case 2 . . . 104
6.6.11 Graph representing the load factor of the fuel cell micro-CHP and auxiliary boiler for Case 3 . . . 105 6.6.12 Graph representing the electrical and thermal eciencies of the fuel
cell micro-CHP for Case 3 . . . 106 6.6.13 Graph representing the electricity output of the fuel cell micro-CHP
and grid electricity for Case 3 . . . 107 6.6.14 Graph representing the heat output of the fuel cell micro-CHP and
auxiliary boiler for Case 3 . . . 108 6.6.15 Graph representing the load factor of the fuel cell micro-CHP and
auxiliary boiler for Case 4 . . . 109 6.6.16 Graph representing the electrical and thermal eciencies of the fuel
cell micro-CHP and auxiliary boiler for Case 4 . . . 110 6.6.17 Graph representing the electricity output of the fuel cell micro-CHP
and grid electricity for Case 4 . . . 111 6.6.18 Graph representing the heat output of the fuel cell micro-CHP and
auxiliary boiler for Case 4 . . . 112 6.6.19 Graph representing the heat output from the thermal storage tank
to the house for Case 4 . . . 113 6.6.20 Graph representing the heat content of the thermal storage tank for
Case 4 . . . 114 6.6.21 Graph representing the load factor of the fuel cell micro-CHP and
auxiliary boiler for Case 5 . . . 116 6.6.22 Graph representing the electrical and thermal eciencies of the fuel
cell micro-CHP for Case 5 . . . 117 6.6.23 Graph representing the electricity output of the fuel cell micro-CHP
and grid electricity for Case 5 . . . 117 6.6.24 Graph representing the heat output of the fuel cell micro-CHP and
auxiliary boiler for Case 5 . . . 118 6.6.25 Graph representing the load factor of the fuel cell micro-CHP and
auxiliary boiler for Case 6 . . . 119 6.6.26 Graph representing the electrical and thermal eciencies of the fuel
6.6.27 Graph representing the electricity output of the fuel cell micro-CHP and grid electricity for System 6 . . . 120 6.6.28 Graph representing the heat output of the fuel cell micro-CHP and
auxiliary boiler for Case 6 . . . 121 6.6.29 Graph representing the heat output from the thermal storage tank
to the house for Case 6 . . . 122 6.6.30 Graph representing the heat content of the thermal storage tank for
Case 6 . . . 123 6.6.31 Graph representing the CO2 emissions of all systems presented in
Chapter 6 . . . 124 7.3.1 PEMFC based micro-CHP model schematic diagram . . . 131 7.3.2 Schematic of the fuel cell stack showing mass and energy ows . . . . 132 7.3.3 Schematic of the reformer showing mass and energy ows . . . 134 7.3.4 Schematic of the afterburner showing mass and energy ows . . . 135 7.3.5 Natural Gas Boiler Schematic showing mass and energy ows . . . . 137 7.5.1 Schematic diagram representing the optimum design conguration for
case 1 . . . 149 7.5.2 Graph representing how the system satises heating demand utilising
heat from the two fuel cell heat exchangers and the natural gas boiler for Case 1 . . . 150 7.5.3 Graph representing how the system satises DHW demand utilising
heat from the two fuel cell heat exchangers and the natural gas boiler for Case 1 . . . 151 7.5.4 Graph showing the utilisation factor of hydrogen at the fuel cell for
Case 1. . . 152 7.5.5 Graph showing the available heat from the afterburner and the
re-covered heat at the reformer for Case 1 . . . 153 7.5.6 Graph showing the individual system temperatures over a winter 24
hour period for Case 1 . . . 154 7.5.7 Graph showing the nal space heating and DHW temperatures for
7.5.8 Graph showing the total water ow from the heating header to the UFH manifold for Case 1. The water ow is 0 in the summer months when space heating demand is 0. . . 155 7.5.9 Graph showing the fuel cell electricity generation and the electricity
from the grid for Case 1 . . . 156 7.5.10 Schematic diagram representing the optimum design conguration
for case 2 showing the TST in addition to the other units and its connections to the system . . . 157 7.5.11 Graph representing the electricity output of the fuel cell micro-CHP
for Case 2 . . . 158 7.5.12 Graph representing the heat extracted from the fuel cell and where
this heat is delivered in the dwelling on a winter day for Case 2 . . . 159 7.5.13 Graph representing the heat extracted from the fuel cell and where
this heat is delivered in the dwelling on a summer day for Case 2 . . 160 7.5.14 Graph representing the heat input and output of the TST for Case 2 161 7.5.15 Graph representing the variation of water temperature in the TST
for Case 2 . . . 162 7.5.16 Graph showing the individual system temperatures over a winter 24
hour period for Case 2 . . . 162 7.5.17 Graph showing the nal total system temperatures for space heating
and DHW over a 288 hour period for Case 2 . . . 163 7.5.18 Graph representing the variation of water temperature in the TST
for Case 2b . . . 165 7.5.19 Graph showing the total return system temperatures over a winter
24 hour period for Cases 1 and 2 . . . 167 7.5.20 Graph showing the total boiler operation over the whole year period
for Cases 1 and 2 . . . 168 7.5.21 Schematic diagram representing the optimum design conguration
for case 3 . . . 170 7.5.22 Graph showing the supply temperatures of the fuel cell cooling circuit
and afterburner heat exchangers over a period of 48 hours for Case 3. Additionally the heat output of each heat exchanger to space heating is shown on the right axis . . . 172
7.5.23 Graph showing the total system temperatures over the rst 48 hour period for Case 3. At times of 0 demand, the temperature variable takes also the 0 value as it can be seen for the space heating supply and return temperature. . . 173 7.5.24 Graph showing total water ow rates over the whole 288 hour period
for Case 3 . . . 174 7.5.25 Graph showing the load factor of the gas boiler over the whole 288
hour period for all cases after altering the minimum modulation limit 175 7.5.26 Graph representing the electricity generation of the fuel cell on a
winter and on a summer day for Case 4 . . . 177 7.5.27 Graph representing the heat extracted from the afterburner and the
heat recovered from the reformer for Case 4 . . . 178 7.5.28 Graph representing the heat output of each plant delivered to the
space heating circuit on an annual basis for Case 4. The graph shows the output of the gas boiler is supplementary to the fuel cell which is sized to cover most heat demand . . . 179 7.5.29 Graph representing the heat output of each plant delivered to the
DHW circuit on an annual basis for Case 4 . . . 180 7.5.30 Graph representing the heat extracted from the fuel cell and where
this heat is delivered in the dwelling on a winter day for Case 4 . . . 181 7.5.31 Graph representing the heat extracted from the fuel cell and where
this heat is delivered in the dwelling on a summer day for Case 4 . . 182 7.5.32 Graph representing the heat input and output of the TST for Case 4 183 7.5.33 Graph representing the variation of water temperature in the TST
for Case 4 . . . 184 7.5.34 Graph representing the supply temperature and heat released from
the fuel cell cooling circuit to the space heating pipe circuit for Case 4. 185 7.5.35 Graph representing the supply temperature and heat released from
the afterburner circuit to the space heating pipe circuit for Case 4. . 186 7.5.36 Breakdown of emissions caused by altering the limit of exported
electricity to the grid for case 5. Emissions reduce as the limit increases189 7.5.37 Graph representing the heat input and output of the TST for Case 6.190
7.5.38 Graph representing the heat output of each plant delivered to the space heating circuit on an annual basis for Case 7. The graph shows the output of the fuel cell is supplementary to the gas boiler which is sized to cover most heat demand. . . 192 7.5.39 Graph representing the heat output of each plant delivered to the
DHW on an annual basis for Case 7. . . 193 7.5.40 Graph representing the variation of water temperature in the TST
List of Tables
2.1 Comparison of Fuel Cell Technologies ([122]) . . . 36 2.2 Fuel Cell CHP 2014 cost estimates (source [78]) . . . 45 2.3 CHP 2012 cost estimates (source [110]) . . . 45 2.4 Recommended internal design temperatures for dwellings in the UK
as recommended by CIBSE ([37]) . . . 47 2.5 Comparison of common heating services design congurations. ([36,
38, 96] ) . . . 50 5.1 U Values of Houses A and B used as input in the building information
modelling software . . . 67 5.2 Internal temperatures for selected dwelling . . . 69 5.3 Reference Building emissions for House A as used in Model 1 . . . . 81 5.4 Reference Building emissions for Houses A and B as used in Model 2
for the 288-hour datasets . . . 81 6.1 Details of model's parameters. . . 90 6.2 Variable low and upper bounds for Model 1. . . 90 6.3 Optimisation variables for Case 1 and comparison with reference
build-ing . . . 96 6.4 Optimisation variables for Case 2 and comparison with reference
build-ing . . . 100 6.5 Optimisation variables for Case 3 and comparison with reference
build-ing . . . 105 6.6 Optimisation variables for Case 4 and comparison with reference
6.7 Optimisation variables for Case 5 and comparison with reference
build-ing . . . 115
6.8 Optimisation variables for Case 6 and comparison with reference build-ing . . . 118
6.9 Summary of CO2 emissions of all cases examined using model 1 . . 123
7.1 Parameters used in model 2 . . . 145
7.2 Bounds used for variables in model 2. When the symbol / is used the values for the dierent heating systems used in the analysis are indicated. . . 146
7.3 Annual heat contribution for each source for case 1 . . . 149
7.4 Annual heat contribution for each source for case 2 . . . 157
7.5 Annual heat contribution for each source for Case 2b . . . 164
7.6 Summary of results for cases l and 2 . . . 165
7.7 Overview of system characteristics for cases 1 and 2 . . . 166
7.8 Annual heat contribution for each source for case 3 . . . 171
7.9 CO2 emission of each system after altering the minimum modulation level of the gas boiler . . . 175
7.10 Annual heat contribution for each source for case 4 . . . 176
7.11 Summary of results for cases 3 and 4 . . . 187
7.12 Overview of system characteristics for cases 3 and 4 . . . 187
7.13 Overview of system characteristics for case 5 . . . 188
7.14 Overview of system characteristics for case 6 . . . 189
Symbols
Model 1
This section presents the symbols used in the model presented in Chapter 6.
Indices Description Units
t (1...T) Time Step
j (fc,gb) Plant type for model k (heat,ele) Energy demand type for model
p (1...n) Breakpoints for linearisation Parameters
Qreqk (t) Energy Demand at Timestep t kW
ra Fuel Cell Ramp Up Rate kW/sec
fg Natural Gas Emission Factor kg/kWh
fe Grid Electricity Emission Factor Kg/kWh
cp Specic Heat Capacity of Water kJ/KgK
ρ Water Density kg/m3
Tenv Environment Temperature oC
Variables
Pj Maximum capacity of plant j kW
rj(t) Load factor of plant
-Qj,k(t) Energy Output k from plant j kW
Qstout(t) Heat from TST to demand kW
ηj,k(t) Eciency k of plant j %
Eg(t) Grid electricity input kW
Vst TST Volume m3
Mf c CO2 emissions caused by fuel cell kg
Mgb CO2 emissions caused by gas boiler kg
Mel CO
2 emissions caused by grid electricity kg
z TotalCO2 emissions kg
Binary Variables
yj(t) 1 if plant j is on, 0 otherwise
-yp(t) 1 if interval
ξp, ξp+1is activated
-Model 2
This section presents the symbols used in the model presented in Chapter 7 .
Indices Description Units
s (CH4, H2, CO2) Species
-t (1,...,288) Timestep
-g (h,l) FC Heat Exchanger
-(FC Cooling Circuit or Afterburner)
j (Heat,dhw,sto,ele) Type of Energy Demand
-p (su-p,ret) Supply or Return position on pipework -Parameters
Qreqj (t) Dwelling Energy Demand kW
Tenv Environment Reference Temperature °C
Eth Theoretical fuel cell voltage V
ra Fuel cell ramp up kW/sec
qref Heat required for the reforming process kJ/mol iH2 Electrical current of fuel cell from hydrogen ow kAsec/mol
M Ws Molecular Weight of species s kg/mol
HHVs Higher Heating Value of species s kJ/mol
cp Specic Heat Capacity of Water kJ/kgK
fe Emissions factor for electricity grid kg/kWh
-Agbj Boiler Maximum Heat kW Output per demand j
Af cgj Fuel cell Maximum Heat kW
Output per demand j per heat exchanger g
Bjst Temperature constraint for demand j °C
δt Timestep sec
Variables
-nf cs (t) Molar Flow Rate of species s in fuel cell mol/sec at time t
mf cs (t) Mass Flow Rate of species s in fuel cell mol/sec at time t
ngbs (t) Molar Flow rate of species s in gas boiler mol/sec at time t
mgbs (t) Mass Flow rate of species s in gas boiler mol/sec at time t
Vst Storage Tank Volume m3
Vc(t) Fuel cell Voltage at time t V
Uf c(t) Hydrogen Utilisation at time t
-Factor
F Tp,j(t) System Temperature °C
at ow p, demand j at time t
Tgb(t) Boiler Temperature at time t °C
Tg(t) Heat Exchanger Temperature °C
at grade g at time t
Tst(t) TST Temperature °C
at time t
Eg(t) Grid Electricity kW
Ef c(t) Fuel Cell Electrical kW
Output at time t
Eexp(t) Exported Electricity kW
to the grid at time t
Qgbj (t) Boiler Output kW
at time t and demand j
rgb(t) Load factor of Gas Boiler
-Pgb Maximum capacity of Gas Boiler kW
exchanger at time t and demand j
Est(t) Heat stored in TST kJ
Qstoutj (t) TST Heat Output kW
at time t and demand j
Qbur(t) Heat generated kW
from hydrogen combustion at time t
Qref(t) Heat required for reforming kW
at time t
mtotalj (t) Total System Water Flow rate at kg/sec time t and demand j
mstoutj (t) TST Water Flow rate at kg/sec
time t and demand j
mgbj (t) Boiler Flow rate at kg/sec
time t and demand j
mgj(t) Flow rate at fuel cell grade g kg/sec
at time t and demand j
Mf c CO2 emissions caused by fuel cell kg
Mgb CO2 emissions caused by gas boiler kg
Mel CO2 emissions caused by grid electricity kg
Mexp CO2 emissions savings kg
by exporting electricity to the grid
z TotalCO2emissions kg
Binary Variables
ysj(t) 1 if temperature constraint is activated for -demand j, 0 otherwise
ygj(t) 1 if fuel cell heat source g releases heat to -demand j, 0 otherwise
yjgb(t) 1 if gas boiler releases heat to
-demand j, 0 otherwise
ystoutj (t) 1 if TST releases heat to
Chapter 1
Introduction
1.1 Introduction to the Project
Energy and environment are becoming key matters in the modern world. As world's population is increasing, cities are growing larger and energy demand is rising. The International Energy Outlook 2013 predicts that worldwide consumption of energy will rise 56% by 2040, a demand which will be caused primarily by developing coun-tries [121]. As fossil fuels reserves are depleting and nuclear power imposes a safety risk, a sustainable way of producing energy is required to ensure that the predicted increase in energy demand can be satised.
Energy consumption in buildings is about 45% of total energy in the UK and con-tributes signicantly to climate change [45]. Energy ecient technologies for micro-generation can reduce CO2 emissions and satisfy energy demand in buildings.
Re-newable technologies that have been used in buildings include PVs, solar thermal panels, small scale wind turbines, ground source heat pumps, biomass boilers and others. A technology that is suitable for dwelling applications and has seen signicant development in the recent years is Combined Heat and Power.
Combined Heat and Power (CHP) is the use of a single process to generate both electricity and heat. Cogeneration allows for primary energy savings to be made as the production of electricity (from power plants) and heat (from boilers) is separate. Many technologies can be used as prime movers for CHP systems such as internal combustion engines, micro-turbines and fuel cells. The EU and the UK government
consider CHP as an important technology: the potential of installing CHP in build-ings is assessed in the EU Directive on the Energy performance of buildbuild-ings, where it is stated that for any building above 1000m2 there is a requirement for the designers to evaluate the potential of installing a CHP system [60].
Energy demand in dwellings is usually covered by grid electricity and boilers. How-ever, micro-CHP systems based on fuel cells can serve domestic demand eciently. Fuel cells have higher electrical eciencies than heat engines and dierent power to hear ratio. Fuel cell micro-CHPs can be an ecient way of satisfying residential energy demand on the basis that cost targets can be met. It can improve energy security and contribute towards reduced peak electricity demandsas energy will be generated and used locally [75]. The design of fuel cell based micro-CHP systems is a complicated problem as various subcomponents are involved that need to work together to meet energy demand eciently. Residential energy demand uctuates on a day by day and seasonal basis. Similarly the fuel cell has operational constraints such as longer start up times compared to conventional systems or specic ramp up rates. It is therefore crucial to determine the control method of the fuel cell micro-CHP to satisfy building energy demands.
1.2 Project Motivation
The aim of this PhD project is to investigate the environmental and technical be-nets by optimising the design of a fuel cell based CHP for dwelling micro-generation. A holistic approach is used in the process considering the energy source and demand as part of one wider system. The focus is to identify ways of integration of the fuel cell micro-CHP system with the building energy system. This is achieved by combining building energy modelling and implementing mathematical models to apply optimisation techniques. A variety of models have been developed as part of the project, some simple and some more complex. The modelling procedure invest-igates ways that fuel cell micro-CHPs can be integrated into dwellings. The existing building stock comprises of various energy systems, so this will identify which para-meters are important when designing fuel cell micro-CHP systems and how energy savings can be achieved. The project aims to expand the understanding of building services and fuel cell micro-CHP design and operation, propose new methods to im-prove the integration of fuel cell micro-CHPs in dwellings to increase eciency and reduce total energy demand.
1.3 Outline of the Thesis
The rest of the thesis is divided in 7 chapters. Chapter 2 introduces the context of the project, the basics of fuel cells and dwelling energy demand.
Chapter 3 discusses the body of literature and previous work in fuel cell micro-CHP, environmental assessment and design optimisation. An overview of the dierent methods, models and techniques is presented.
Chapter 4 discusses the heat recovery choices in a fuel cell and the potential for integration with building services. It addresses the point that multiple heat streams are available in a fuel cell and discusses the need for an optimisation tool that can maximise the utilisation of these streams in a domestic environment.
Chapter 5 presents the reference buildings against which the designs produced by the models will be compared to. The reference buildings are modelled with building modelling software and are served by conventional heating and electricity systems. Chapter 6 describes the development of a mixed integer non-linear programming (MINLP) model for determining sizing and operational characteristics of a fuel cell micro-CHP. The model uses eciency equations to describe plant operation and the results provided by the model can be used for the evaluation of proposed designs. Three case studies are presented in this chapter that illustrate the application of the model on dierent weather data.
In Chapter 7 a MINLP model is presented that integrates the design of a fuel cell micro-CHP along with the design of the building services in a dwelling. It is system-atic design tool that can expand the understanding for fuel cell micro-CHP systems in houses by oering better knowledge of the temperature constraints in the plant-dwelling system. Four case studies are presented in this chapter examining dierent scenarios.
Finally, Chapter 8 summarises the main contributions of the thesis and provides suggestions for future work.
Chapter 2
Background
2.1 Overview of the UK Energy System
A short overview of the context of the project will help identify the drivers behind it. It will also show the relation of the presented work to the big picture of climate change and building energy demand.
In terms of primary energy the UK minimised energy imports following the develop-ment of the North Sea oil and natural gas reserves in the 70s and became an exporter of energy in the beginning of the 80s. By the end of the millennium, the UK became one of largest producers of natural gas in the world and exported oil. The produc-tion of gas and oil from the North Sea reserves peaked at the end of the previous millenium and then started declining, so the UK became an importer of energy in 2004. Figure 2.1.1 illustrates the production and consumption of primary fuels in 2013, whereas gure 2.1.2 shows the total energy consumption by fuel from 1970 to 2013. It can be seen that natural gas and petroleum fuels account for the largest proportion of fuel consumption in the UK. The depletion of oil and gas reserves in the North Sea therefore raises an energy security issue which additionally to climate change forces the UK to nd alternative ways for energy generation [44] .
Figure 2.1.1: Production and Consumption of Primary Fuels in the UK in 2013 ( [48])
Figure 2.1.2: Energy Consumption by fuel in the UK from 1970 to 2013 ( [49]) The Sankey diagram in Figure 2.1.3 shows the UK Energy system in 2013. From the diagram it can be seen that the domestic energy consumption is responsible for approximately 30% of the total UK energy consumption.
Gas Stocks Coal Stocks Product Stocks Crude Stocks 36.5 46.0 5.5 32.7 NATURAL GAS 82.5 COAL 40.7 ELECTRICITY 20.0 OTHER IMPORTS 2.2 3.0HYDRO & WIND
15.4 PETROLEUM 140.1 NUCLEAR 30.9 44.5 64.7 73.273.2 9.4 0.5 17.4 5.4 0.5 0.1 48.4 27.3 2.2 2.0 1.2 44.0 31.9 2.0 Primary Supply 213.5 Primary Demand 213.9 4.6 4.0 0.6 0.2 0.1 67.3 7.0 4.7 31.4 37.0 CoalGas OIL REFINERIES POWER STATIONS OTHER TRANSFORMATION 19.7 39.4 32.4 39.3 19.7 19.7 CONVERSION LOSSES 48.1 USE AND DISTRIBUTIONENERGY INDUSTRY
LOSSES 15.8 NON-ENERGY USE
7.6 EXPORTS AND MARINE BUNKERS 78.9
Primary demand 72.8
IRON & STEEL 1.3 OTHER INDUSTRY 22.9 TRANSPORT 53.4 DOMESTIC 43.8 7.6 4.3 1.4 0.9 52.0 0.4 29.6 0.5 2.8 0.3 0.9 10.3 1.2 OTHER FINAL CONSUMERS 21.0 0.5 0.5 Primary supply 72.5 5.6 FOOTNOTES:
1. Coal imports and exports include manufactured fuels. 3. Includes heat sold.
2. Bioenergy is renewable energy made from material of recent biological origin derived from plant or animal matter, known as biomass. 4. Includes non-energy use.
This flowchart has been produced using the style of balance and figures in the 2014 Digest of UK Energy Statistics, Table 1.1.
0.3 2.5 DEEP MINED 0.4 Electricity 0.3 BIOENERGY 9.0 IMPORTS 1.5 6.9 8.8 8.8 0.2 Bioenergy 0.6 1.1 0.3 2.9 5.8 Natural Gas IMPORTS Coal IMPORTS1 Electricity HYDRO, WIND, IMPORTS & SECONDARY ELECTRICITY
Manufactured Fuels3 Crude Oil and NGL
IMPORTS Refined Products IMPORTS Petroleum IMPORTS Bioenergy2
Energy Flow Chart 2013
(million tonnes of oil equivalent)
INDIGENOUS PRODU C TION AND IMPORTS 292.3 TO TA L FINA L CONSUMPTION 4 150.1 8.1 9.8 8.7
Figure 2.1.3: Sankey Diagram of UK Energy System in 2013 ([43])
UK energy policy concentrates on energy security as the country is now importing the majority of its energy. The priorities of the energy policy are to achieve the EU target of 20% reduction of the UK's energy consumption by 2020. This EU target is described in the European Commission's Emissions Trading System (EU ETS) and was rst introduced by Directive 2003/87/EC [61]. The UK has also introduced a more optimistic target which has been implemented into the legislation as the Climate Change Act 2008 and is an 80% reduction in CO2 emissions from 1990
levels by 2050 [82] . This will be achieved by implementing the measures dened within the EU Energy Eciency Action Plan in the following sectors: transport, improved eciency of equipment, changing citizens' energy behaviour, technology and energy savings in buildings [59].
2.2 Household Energy Demand
Household energy consumption was around a third of the nal energy consumption in the UK in 2010. This is an increase of approximately 30% and 20% compared to the 1970 and 1990 levels respectively. Some of this increase has been caused by the additional UK households constructed in this period and the increase in the population since 1990. The main fuel in dwellings has also drastically changed since the 70s when the primary fuel was coal, followed by natural gas; In 2010 coal represented only 1% of the total household energy consumption whereas natural gas covered the majority (69%) [49]. The fuel mix of residential buildings since 1970 is represented in Figure 2.2.1.
Figure 2.2.1: UK Domestic sector fuel mixture ([46])
Energy in domestic buildings is used primarily for space heating, domestic hot water (DHW), lighting, appliances and cooking. From 2007 the amount of energy consumed for lighting and appliances has increased signicantly as it can be seen in Figure 2.2.2. The reduction of the total space heating energy that occurs since, can be justied by the introduction of energy eciency measures in buildings and the increase in energy prices which led to a reduction in heating hours.
Figure 2.2.2: UK domestic nal energy consumption by end user since 1970 ([46]) 2.2.1 Energy Assessment of Buildings
The building energy policy is based on the European Energy Performance of Build-ings Directive (EPBD) which has now been integrated into the UK legislation [60]. Building Regulations dene the required energy eciency standards for space heating and domestic hot water systems. All new buildings and buildings under refurbish-ment should comply with Building Regulations Part L in terms of their overallCO2
emissions [81]. The document sets limiting targets for U values of all structural elements and air permeability values for the whole building. At the same time in-formation is given on equipment eciencies. The method of calculating total energy and CO2 emissions proposed in Part L is the National Calculation Method (NCM).
It suggests that for complying with the Building Regulations the annual energy consumption of a building should be compared with the energy consumption of a reference building.
The Standard Assessment Procedure (SAP) is a methodology that identies compli-ance with building regulations and its latest version was published in 2012 [26, 27]. SAP is a methodology for the evaluation of the energy performance of buildings and works on estimates of energy consumption for all services of a dwelling such as space heating, domestic hot water, lighting and ventilation.
Reg-ulations Part L is the Domestic Heating Compliance Guide (DHCG). The DHCG provides information on the various equipment that can be used in household heating and DHW, together with information on limiting seasonal eciencies [83].
2.3 Domestic Micro-CHP
Micro-generation refers to systems suitable to generate energy at a small scale for use in domestic or small commercial properties. EU's Co-generation directive denes micro-generation as any system that generates electricity below 50 kWe [62]. In the UK however micro-generation is limited to 3 kW electrical and 20 kW thermal output [72]. Micro-generation can be broadly categorised in the following:
1. Micro-CHP technologies
2. Photovoltaics, solar thermal and wind turbines 3. Heating using biomass boilers or heat pumps.
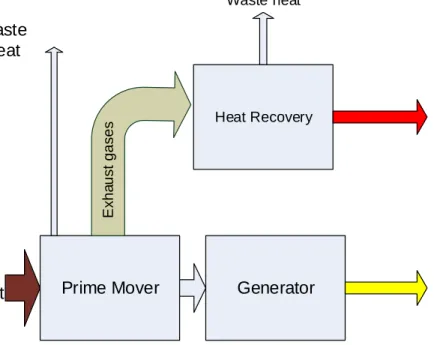
A CHP system comprises of a prime mover, a power generator and a heat exchanger that recovers heat from the exhaust gases. A simplied diagram of the process is shown in Figure 2.3.1. CHP systems can capture the heat that in conventional plants is wasted and therefore they can achieve eciency of up to 85% compared with 40-45% of conventional plants. In these systems, eciency is dened as the sum of useful heat and power generated to the chemical energy of the input fuel.
CHP systems can use several technologies for driving the electrical power generator. In micro-CHP systems these technologies could be internal combustion engines, fuel cells, Stirling engines and others.
Fuel Input Prime Mover Generator Electricity Waste Heat E x h a u s t g a s e s Heat Recovery Waste heat Heat
Figure 2.3.1: Simplied diagram of a CHP system showing energy ows
2.4 Fuel Cell Technology
2.4.1 Overview of Fuel Cell Technologies
The fuel cell generates electrical power using hydrogen supplied on the anode and oxygen on the cathode, which react within an electrolyte layer. Hydrogen on the anode splits into a proton and an electron. The proton travels via the electrolyte to bond with the electrons (which travel on an external circuit) and oxygen to form water.
Figure 2.4.1: Fuel Cell Basic Operation ( [65]) The overall fuel cell reaction is:
2H2+O2 →2H2O (2.4.1)
There are dierent types of fuel cells categorised by their electrolyte. The most important are:
Phosphoric Acid Fuels Cells (PAFC) Molten Carbonate Fuel Cells (MCFC)
Proton Exchange Membrane Fuel Cell (PEMFC) Solid Oxide Fuel Cells (SOFC)
Alkaline Fuel Cells (AFC) .
Table 2.1: Comparison of Fuel Cell Technologies ([122])
PEMFC PAFC MCFC SOFC
Charge H+ions H+ions CO=
3ions O=ions
Carrier
Polymeric Phosphoric Phosphoric Solid ceramic,
membrane acid acid Yttria stabilised
Electrolyte solutions (immobilised zirconia liquid)
Construction Plastic, metal Carbon, High Ceramic,
or Carbon porous temperature high
ceramics metals, temperature
porous metals
ceramic
Oxidant Air Air or Air Air
orO2 orO2enriched air
Fuel
Hydrocarbons Hydrocarbons Hydrogen, Natural gas
or or natural gas, or
methanol alcohols propane propane
Temperature 65-85 oC 150-200 oC 600-700 oC 700-1000 oC
Electrical 25-35 % 35-45 % 40-50 % 45-55 %
Eciency
Contaminants CO, sulfur CO, sulfur sulfur sulfur
SOFC and PEMFC have received more attention than the other types and there are many commercially available products for various stationary or mobile applications [10, 51, 122] .
2.4.2 Fuel Cell Operation
The open circuit voltage (OCV) of a fuel cell is given by the following equation:
Eocv =
−Δg
2F (2.4.2)
where ∆g is the Gibbs free energy and F the Faraday constant. This represents a no losses voltage and in practise is never achieved due to three main losses: Activation Losses
Activation losses are related to the speed of the reactions on the surface of the electrodes that move the electrons to or from the anode. These losses can be
calculated using the Tafel equation: ΔVact = RT 2aF ln i io (2.4.3) wherea is a constant called the charge transfer coecient. Its value depends on the reaction and the material of the electrode. For the hydrogen electrode, its value is about 0.5. For the oxygen electrode the charge transfer coecient is between 0.1 and 0.5. iοis called the exchange current density and is responsible
for the control of the performance of the electrode. T is the temperature,R is the gas constant andiis the current density [89].
Ohmic Losses
This voltage drop is caused by the resistance to the ow of electrons through the material of the electrodes and is proportional to current density. The ohmic losses are given by equation (2.4.4)
∆Vohm=ir (2.4.4)
where r is the area-specic resistance. Mass Transport or Concentration Losses
These result from the change in concentration of the reactants at the surface of the electrodes as the fuel is used. The voltage drop due to concentration losses is given by equation 2.4.5.
∆Vcon=−RT 2F ln 1− i i1 (2.4.5) Overall the voltage is given by subtracting all the losses from the OCV:
V =Eocv−∆Vact−ΔVohm−ΔVcon (2.4.6)
All the above equations provide an understanding of the processes that take place in the fuel cell and their eect on voltage. Figure 2.4.2 shows the relation of voltage against the current density while gure 2.4.3 shows the power against current density for a PEMFC fuel cell using average values for the parameters for each section of the losses. In Figure 2.4.2 the area below the polarisation curve represents the useful electrical work that the fuel cell can deliver and the area between the curve and the
open circuit voltage represents the thermal losses, part of which can be utilised from a CHP unit. 0.000 0.200 0.400 0.600 0.800 1.000 1.200 1.400 0.000 0.250 0.550 0.850 1.150 1.450 V o lt a g e ( V )
Current Density (A/cm2)
Open Circuit Voltage (OCV)
Activation Losses Ohmic Losses Transport Losses
Figure 2.4.2: Graph showing the voltage of an average PEMFC fuel cell against the current density, illustrating the energy losses that occur
0.000 0.100 0.200 0.300 0.400 0.500 0.600 0.700 0.000 0.250 0.550 0.850 1.150 1.450 P o w e r( k W )
Current Density (A/cm2)
Figure 2.4.3: Graph showing the power output of an average PEMFC fuel cell against the current density
2.4.3 Fuel Cell Eciency
Figure 2.4.4 illustrates the electrical, thermal and total eciency of a fuel cell in relation to the the load factor, which is dened as the ratio of the electricity output to the maximum rated capacity [73]. The electrical eciency represents the ratio of the DC power output of the fuel cell over the chemical energy contained in the fuel. The heat than can be recovered by the cooling medium over the energy in the fuel represents the thermal eciency, while the sum of the two provides the total fuel cell eciency. These graphs were generated from tted data from various eciencies at dierent load factors using the SOFC-CHP model developed by Hawkes et al. [73].
0 10 20 30 40 50 60 70 80 90 100 0 0.1 0.2 0.3 0.4 0.5 0.6 0.7 0.8 0.9 1
E
ff
ic
ie
n
c
y
(
%
)
Load FactorElectrical Efficiency Total Efficiency Thermal Efficiency
Figure 2.4.4: Graph showing the electrical, thermal and total eciency of an SOFC in relation to the load factor [73]
2.5 Fuel cell micro-CHP system design
A fuel cell micro-CHP comprises of many process systems that work in conjunction with the fuel cell in order to eectively utilise the energy in the fuel input, convert it to heat and power and deliver it to the load. The typical components of a fuel cell micro-CHP are:
a reformer to convert natural gas into hydrogen rich fuel mix.
a desulfuriser to remove the various impurities of the fuel mix such as sulphur compounds which can be harmful to fuel cells.
power conditioning such as transformers and inverters, to convert current from DC to AC and to transform the voltage to the required levels.
a heat management system to remove heat from the stack and distribute it to the other process units of the system.
a control system to regulate fuel input, power output and operation.
An example of a fuel cell micro-CHP with all the components and interconnections is shown in Figure 2.5.1.
Figure 2.5.1: Schematic Diagram of fuel cell micro-CHP components ([125]) 2.5.1 Fuel Processing
Hydrogen does not exist in nature as a fuel, therefore the use of carbon-based fuels such as natural gas is necessary. This requires the use of a reformer which provides a supply of hydrogen rich gas from the fuel source. The operating temperature of the fuel cell determines whether the reformer is internal or external. For the reformer to be internal, the operating temperature of the stack must be high. SOFCs operate at a high temperature and therefore reform internally avoiding the need of additional subsystems external to the fuel cell stack. However, a pre-reformer is sometimes used in medium temperature SOFCs.
The two main methods of reforming are endothermic steam reforming (SR) and exothermic partial oxidation reaction (POX). In the case of steam reforming, the fuel is combined with steam to produce CO andH2by vaporisation at high temperature.
CH4+H2O →CO+ 3H2 (2.5.1)
[ΔH = 206 kJ mol−1]
In the exothermic partial oxidation reaction, hydrocarbons and oxygen combine to form CO and H2.The methane partial oxidation reaction is shown below:
CH4+
1
2O2→CO+ 2H2 (2.5.2)
[ΔH = =247 kJ mol−1]
The subsequent CO generated by either process is converted into CO2 with the addition of water in a water-gas shift reaction. The gas shift reaction is shown below:
CO+H2O→CO2+H2 (2.5.3)
[ΔH = -41 kJ mol−1]
Natural gas reforming is endothermic, so heat needs to be supplied to the reformer at high temperature for a reasonable conversion rate to be achieved.
2.5.2 Electricity Conditioning
The fuel cell produces DC electricity which must be converted to AC. The use of inverters is therefore necessary. Transformers are also used to obtain the required voltage. In domestic systems, the electricity is converted to a single phase AC voltage. In addition, current, voltage and frequency are controlled to ensure the quality of electricity is maintained [89, 103, 128].
2.5.3 Heat Management
In order to use heat within the fuel cell micro-CHP, a management system is required that can capture and exchange heat through heat exchangers. Heat utilisation and management in fuel cell micro-CHP is discussed in detail in Chapter 4.
2.5.4 Controls
Fuel cells micro-CHPs are complex systems, so in order to perform well, a control system must be in place. The fact that so many process units operate together as one system makes the control of a micro-CHP a complicated task. A control system includes valves, actuators and control units. SOFC fuel cells have long start up times mainly due to their high operating temperature. Degradation of fuel cell's performance over time can aect the projected lifetime of a micro-CHP system and aect the investment in the technology. An appropriate control strategy can minimise the eects of stack degradation [88, 92, 118, 129, 131].
2.6 Fuel cell micro-CHP Products
In terms of product availability, there are many manufacturers that produce fuel cell units for various applications and sizes, and a number of them produce packaged fuel cell micro-CHP units that can be installed in domestic properties. Companies such as Ceramic Fuel Cells, BG MicroGen, EcoPower, WhispeGen, Sulzer Hexis and Baxi are producing micro-CHP systems of various technologies and capacities. Japan and generally Asia is a developed fuel cell market with strong government support. The global sales market share for the Asian region exceeds 60% and reaches $1.5 billion [66, 120]. Japan is active on production of fuel cell products with Kyocera, TOTO and Nippon Oil developing micro-CHP systems around the 1 kWe capacity group [51].
Ceramic Fuel Cells has developed a fuel cell micro-CHP product named BlueGen. It is based on a solid oxide fuel cell system with a heat to power ratio of 0.5 kWth to 1 kWe, aiming to achieve a high electrical eciency. An image of the BlueGen unit is shown in Figure 2.6.1a [34].
Sulzer Hexis produces the Galileo 1000N system which is based on a SOFC and generates 1 kW of electrical power and 2 kW of heat [113]. The unit includes an integrated 20 kW gas red condensing boiler which can be used to cover heating and DHW when the fuel cell thermal output is not sucient. An image of the unit is shown in Figure 2.6.1b.
(a) Ceramic Fuel Cells Blue Gen micro-CHP unit [34]
(b) Sulzer Hexis Galileo 1000N micro-CHP unit [113]
Figure 2.6.1: Images of fuel cell micro-CHP products [34, 113]
2.7 Fuel cell micro-CHP Cost
Despite the environmental benets of fuel cell CHPs, their future in the micro-generation market depends on costs and payback periods. Although more and more fuel cell based micro-CHP products become available and the capital cost is slowly reducing, generally the capital cost compared to engine based micro-CHPs is still higher. From discussions with Ceramic Fuel Cells in 2013 it was obtained that the price for their 1.5 kW BlueGen unit is ¿20,000. In 2010, the company sold 30 BlueGen units to the Australian Government for ¿30,000 per unit, a cost which can be decreased further with increased production [35]. The capital cost estimates
by the Environmental Protection Agency (EPA) for CHPs with larger capacities are shown in Table 2.2 [78]. These values are only for fuel cell stacks and are not representative of the total micro-CHP where the cost per kWe is higher but give an indication.
Table 2.2: Fuel Cell CHP 2014 cost estimates (source [78])
Installed System Costs System 1-PEMFC System 2-SOFC System 3-MCFC
Nominal Capacity (kW) 0.7 1.5 300
Total Plant Cost ($/kW) 22,000 23,000 10,000
A report released from Imperial College in 2012 gives information on sale prices of current micro-CHP systems [110]. Indicative prices reproduced from that report are shown in Table 2.3. The average price as of 2012 varies between $25,000-30,000 per kWe.
Table 2.3: CHP 2012 cost estimates (source [110])
System Technology Electrical Capacity (kW) Year Price was Set Price (USD)
Eneos PEMFC 0.7 2011 $21,800
Panasonic PEMFC 1.0 2009 $28,800
Kyocera SOFC 0.7 2012 $22,200
As there is no clear indication of the actual capital cost of fuel cell micro-CHPs many researchers have researched the problem, calculating a realistic capital cost for these systems in order to present a good investment for homeowners. Stael et al. estimated the cost target for a 1 kWe fuel cell at ¿280-500 per kW in order to compare with boiler technologies [111]. This is far from the current range of costs and until high production rates can be reached, such low prices are dicult to be achieved. A study that investigated the requirements for high market penetration of various micro-CHP technologies concluded that low capital and fuel cost prices would allow micro-CHPs with low heat-to-power ratio, such as fuel cell based units, to increase their market share [115]. A possible way for this is by government incentives and change in policy [51].
2.8 Policy and Field Trials
The policy with regard to micro-generation is outlined in the Micro-generation Strategy of the Department of Energy and Climate Change (DECC) in 2011 [47]. The purpose of the document is to attract investments in micro-generation by intro-ducing support schemes such as the Feed-in-Tari (FIT) and the Renewable Heat Incentive (RHI) which reward nancially every kWh of energy generated from re-newables or micro-CHPs. Technologies such as fuel cells are also featured in the document. The document concludes that the most suitable buildings for such tech-nology have to be determined. At the same time micro-CHP systems have to be established as exible enough systems to satisfy the variable heat loads of buildings. Heat storage is also mentioned in the document and is considered a method that combined with CHP units can reduceCO2 emissions.
Carbon Trust's report titled Micro CHP Accelerator demonstrates the benets of CHP eld trials [32]. The programme included the installation of 87 micro-CHP units based on internal combustion and Stirling engines in domestic and com-mercial applications in the UK. The report presents the energy and cost savings in the eld trials and concludes that the economics of micro-CHP systems can be im-proved further by increasing the electrical eciency of the systems. According to the report the micro-CHP - household system would perform better if the electrical e-ciency of the prime mover was higher and the electricity production similar to heat production. In addition, the report claims that with optimised controls, the car-bon savings by domestic micro-CHP systems could potentially be higher. The trials did not include any fuel cell micro-CHPs as the commercially available products at the period the project started were limited. However, based on the heat-to-power characteristics and higher electrical eciency, fuel cell based micro-CHPs may be more eective over other micro-CHP technologies which are based on thermal en-gines in terms of the potential to reduce energy consumption in buildings. Despite the benecial technical characteristics of fuel cells, there has been small interest by manufacturers in developing fuel cell micro-CHPs compared to engine based tech-nologies. The Energy Saving Trust places the fuel cell micro-CHP as an emerging technology in the energy market and suggests that this is due to the reason that the cost per kW of fuel cell is still much greater compared to established technologies such as the Stirling or internal combustion engines [56].
Ene.eld [54] is a fuel cell micro-CHP trial programme that runs in 11 countries in Europe and aims to install up to 1,000 systems. The programme is supported by several European micro-CHP manufacturers and the data will be used to inuence
policy support by demonstrating the cost and environmental benets of the techno-logy. However the reports [55] available on the programme's website do not present any results from the eld trials suggesting that performance data of installed fuel cell micro-CHPs are not yet available.
Ceramic Fuel Cells together with Crest Nicholson, a UK contractor, has installed a BlueGen 1.5 kWe unit in a four-bedroom family home in Epsom, Surrey. The building that the fuel cell micro-CHP unit is installed in, is a high insulation home with very low space heating demand. The BlueGen can then provide all the heat demand of the house without a need for an auxiliary boiler [40]. Following the installation there are no subsequent reports from the contractor or the manufacturer on the environmental or cost benets of this installation. This is to add to the overall lack of data from the eld with regard to fuel cell micro-CHP installations.
2.9 Thermal Comfort and Heating Systems
Buildings require heating to maintain comfortable conditions for the occupants. Thermal comfort varies between dierent people depending on their health, age, metabolic rate, clothing and other environmental factors such as temperature and humidity. Engineers that design heating systems work on a common reference when conducting their design calculations: the internal design temperature. Table 2.4 shows the recommended by CIBSE internal design temperature for UK houses [37].
Table 2.4: Recommended internal design temperatures for dwellings in the UK as recommended by CIBSE ([37]) Room Temperature (°C) bathrooms 2022 bedroom 1719 hall/stairs/landing 19-24 kitchen 17-19 living rooms 20-23 toilets 19-21
Dierent building types and locations will have dierent requirements and constraints for heating systems. The main elements of any heating system design are [30, 36, 80, 102]:
other sources of heat could be heat pumps [109], micro-CHP systems and solar thermal panels.
a heat distribution system. Heat could be delivered using water or air. A pipe or a duct network is commonly used. In the case of a pipe network, this is called a Low Temperature Hot Water (LTHW) pipe network and uses water at temperatures in the range of 30-90 °C.
a heat emitter. The radiator is the most popular heat emitter in UK houses. A temperature dierence (ΔT) of around 10 °C which sometimes can be extended
to 20 °C is maintained between the water temperature in the supply and re-turn pipework. Underoor heating despite being a more costly system is more ecient than radiators because of the lower operating temperature (30-50 °C). Figure 2.9.1 shows a radiator and an underoor heating system. Figure 2.9.3 shows a common system design used in dwellings with a separate hot water tank.
a control system that ensures that the heat source is operated at the correct output level. This usually requires a central controller with space temperature reading via a thermostat and in some cases secondary control on the heat emitters such as thermostatic radiator valves (TRV).
Figure 2.9.1: Images of Radiator and Underoor Heating System ([112],[124]) There are many design congurations: one option is the use of a gas red combina-tion boiler (combi) which can generate heating and DHW directly. Water is heated directly from the mains water supply eliminating the need for a water storage cyl-inder. An alternative option for DHW is the use of an indirect system with a hot water cylinder where hot water is generated indirectly from a heating coil which is connected to the boiler's heating pipework. For domestic applications the capacity of the hot water cylinder varies between 75-250 L, with a minimum recommended of 115 L per dwelling [30], depending on the number of occupants and number of hot water outlets. Other congurations include two individual gas red units, one for generating space heating and one gas red heater to generate hot water. De-tails on applications of these dierent designs is given in Table 2.5. Cogeneration for domestic applications is analysed in detail in the following chapters so it is not mentioned here.
Simplied schematics of the rst two congurations are shown in Figures 2.9.2 and 2.9.3 [39, 79].
Table 2.5: Comparison of common heating services design congurations. ([36, 38, 96] )
System Details Applications
Gas Fired Single combi boiler that Individual Flats,
Combi Boiler generates hot water Small Houses
for space heating and DHW
Gas Fired Single or multiple boilers which Individual Flats,
Boiler with serve heating and one indirectly Central Heating
DHW tank heated hot water cylinder
for DHW
Gas Fired Single boiler which serves Individual Flats
Boiler and space heating
Electric DHW and electric water heaters
installed locally on DHW outlets
Electric Space Electric heat emitters Remote Applications where
Heating and and electric water gas or oil supply
Electric DHW heaters installed locally is not available
on DHW outlets
Individual Gas Single Gas boiler serves only space Central Heating,
Fired Boiler and heating and separate gas Large Applications
and Gas Fired red water heater serves DHW
Water Heater
Figure 2.9.3: Simplied Schematic of Gas Fired Boiler and DHW Storage Tank In some designs, a low loss header is included. A header allows for circuits of dierent temperatures and ow rates to be connected to central plant via the header, ensuring that correct ow to central plant is maintained. A manufacturer's low loss header installation manual suggests that ...the low-loss header acts as hydraulic break, decoupling boiler and system circuits from each other. [123].
Low Loss Header Boiler Pum p Primary Flow Primary Return Secondary Flow Secondary Return
Figure 2.9.4: Schematic showing the operation of a low loss header illustrating primary and secondary circuits [2].
Chapter 3
Previous Work
3.1 Modelling Fuel Cell micro-CHPs for domestic
applic-ations
As eld data have been limited, many researchers have developed models to predict the performance of fuel cell micro-CHPs in dwellings [13, 15, 16, 21, 52, 70]. The use of models to examine various scenarios is natural as fuel cell micro-CHPs are an emerging and not an established technology. However, the potential benets of fuel cells and the increasing number of available products increase interest in modelling fuel cells for micro-generation [9]. Usually researchers estimate energy savings or cost reduction from the use of fuel cell systems. Some researchers use simulation methods to evaluate dierent scenarios: simulation can identify values for a specic characteristic of the system under examination over a period of time. Researchers also develop optimisation models of systems and use them to identify optimal values for their chosen design variables in relation to an objective function [7, 8, 10]. Optimisation can provide useful results as the fuel cell micro-CHPs and their design is currently under development, so optimisation techniques can identify ways of improving it. Many studies based on single objective optimisation have chosen total cost as the design objective. Techno-economic studies can identify trade-os between dierent characteristics such as cost and eciency or electrical power [74]. Hawkes et al., in a two-part report, calculated the additional capital cost for a fuel cell micro-CHP system compared to a conventional heating system and the impact of degradation of the fuel cell stack on the performance of the system [75, 76].
3.1.1 Modelling Processes and Methods
In the review of current fuel cell micro-CHP models in literature there were found two approaches:
Firstly, detailed fuel cell and sub-component models which may include thermody-namics and electrochemical kinetics or other characteristics but neglect the building that the fuel cell micro-CHP will be installed into and its energy demand. The main goal is usually the calculation or maximisation of the electrical eciency or the power delivered by the fuel cell. Studies that have selected this approach are included in references [13, 20, 97].
Arsalis et al. have developed a model for a residential micro-CHP system based on a PEMFC. The system covers electricity, DHW and space heating for a home in Denmark. A detailed fuel cell micro-CHP system is modelled . However the house side of the system with its varying electrical and heating demand proles is not equally considered but has been simplied into three time periods: winter, summer, and spring (autumn) [13]. Palazzi et al. have implemented a techno-economic model of a SOFC micro-CHP. They formulated the model as an MINLP problem assigning dierent fuel processing options to binary variables. Their model can identify the optimum solutions for system eciency and specic investment cost [97].
Secondly, there are fuel cell micro-CHP models which consider the interaction of the energy plant with the building and its energy characteristics. Usually each researcher would dene a typical house that will be determine the energy demand; a denition which varies from study to study. They often use real data taken from eld studies or use Building Modelling Software to generate their own. The most popular software for building modelling is TRNSYS, ESP-R, IES and TAS [58, 87, 116, 119]. In some cases researchers obtain data of energy demand from actual or simulated dwellings and use them to determine the capacities and operating patterns of fuel cell systems. These models describe the system more accurately without only focusing on the fuel cell system. Studies that have followed this approach are included in [21, 73, 95]. Hawkes et al. in order to investigate the impact of the house demand prole, ex-amined patterns of heat demand that favour SOFC based micro-CHP. They looked at dierent heat demand proles for a UK dwelling with their model and performed a techno-economic analysis. A similar study was performed by Barelli et al. who developed a residential micro-CHP model consisting of the fuel cell, the required balance of plant and an auxiliary hot water boiler. The purpose of the study was the evaluation of the performance of fuel cell based CHP systems under variable electrical and thermal loads. Oh et al. performed an economic analysis of a


![Crystal structure of poly[[hexaqua 1κ4O,2κ2O bis(μ3 pyridine 2,4 dicarboxylato 1κO2:2κ2N,O2′;1′κO4)cobalt(II)strontium(II)] dihydrate]](data:image/gif;base64,R0lGODlhAQABAIAAAP///wAAACH5BAEAAAAALAAAAAABAAEAAAICRAEAOw==)