Gender, Spatial Ability, and High-Stakes Testing
Teomara Rutherford ([email protected])Department of Education, 3200 Education Irvine, CA 92697-5500
David S. Lee ([email protected])
Department of Education, 3200 Education Irvine, CA 92697-5500
Michael E. Martinez ([email protected])
Department of Education, 3200 Education Irvine, CA 92697-5500
Abstract
Researchers disagree on the relationships between gender, spatial ability and math achievement. Varied results from studies using different measures and populations fuel the debate. The present study adds to the gender-spatial-math literature by examining this relationship in the context of high-stakes math testing. Results indicate no gender effect on spatial ability or math achievement, and a spatial/math relationship that is eliminated once ELA covariates are introduced.
Keywords: spatial ability, gender, math achievement, education.
Background
The area of gender differences in mathematics is a contested topic. Depending on the measures used and populations evaluated, researchers have found widely differing results (Friedman, 1995; Hyde, Fennema, & Lamon, 1990). Most gender differences are found among older children and with tests implicating higher-order mathematical thinking and are especially prominent among highly selective or academically advanced samples (Geary, 2000; Hyde, Fennema, & Lamon, 1990; Lachance & Mazzocco, 2006).
Among researchers that do find a gender difference in math achievement, the search for the root of this difference often leads them to the idea of a spatial ability mediator (e.g., Casey, Nutall, & Pezaris, 2001). This mediator model has been adopted by many in the policy community and is relied upon in calling for educators to utilize spatial thinking toward advancing learning outcomes (AAUW, 2010; Committee on Support for Thinking Spatially, 2006, NCTM, 2000). Much research has been done to illuminate the specifics of these relationships, but has been met with inconsistent results.
In considering which measures of spatial cognition were most related to gender, Linn and Petersen (1985) found that tests of mental rotation produced the largest male advantage. Friedman’s (1995) meta-analysis all but dismissed the gender-spatial-math relationship as folklore, but noted that spatial abilities may work differently for males and females, especially among higher-ability groups. Casey, Nutall and Pezaris (2001) attempted to tease apart the types of math
problems most related to spatial ability and gender, a proposition that other researchers have supported—many identifying more complex mathematical problem solving as displaying a male or high-spatial-performer advantage (Floyd, Evans, & McGrew, 2003; Geary, 2000).
Researchers such as Voyer and Sullivan (2003) have emphasized the need to consider relevant control variables to avoid the suppression of an effect on or of spatial ability. For example, Johnson and Meade (1987) note that female verbal precocity may mask a male advantage in spatial ability among younger children. The same call for relevant control variables is used to prevent the overestimation of spatial-gender or spatial-mathematics relationships (Floyd, Evans, & McGrew, 2003; Friedman, 1995). Failure to include variables measuring an underlying ability related to both spatial cognition and math achievement may indicate a false relationship.
In the above examples and others, exploring gender-spatial-math relationships has been done with grades (e.g., Voyer & Sullivan, 2003), non-classroom-related tests of math achievement, such as the Woodcock Johnson III (e.g., Taub, 2008), and adapted standardized tests (e.g., Casey, Nutall, & Pezaris, 2001). Within the current educational conscience, greater utility might be found from exploring these relationships among measures of achievement more relevant to today’s schools. Since the No Child Left Behind act of 2002, much of the emphasis in American classrooms has been on standardized tests. These exams have real-world consequences for students, teachers and schools. Strands within these assessments often address math problems thought to be directly (measurement, geometry) or indirectly related to spatial thinking (Committee on Support for Thinking Spatially, 2006). Policy-makers and educators rely on these exams to make important decisions and treat scores as representative of actual student math achievement.
The goal of this paper is to contribute to the research on gender, spatial ability, and mathematics by examining these relationships on a practical and “high-stakes" indicator, the California Standards Test (CSTs). To explore whether this relationship differs depending on type of problem, CST cluster scores relating to different strands of mathematical skills are also investigated.
Methods
ParticipantsParticipants in this study were drawn from a larger study on the effects of an interactive mathematics software (ST Math), which included all second through fifth graders in 52 schools across two treatment conditions. The schools were located in Orange County, California and were predominately Latino with large percentages of English Language Learners. The average percentage of students on free or reduced price lunch among the study schools was over 80%. Further information on the study design is available in Rutherford et al. (2010).
A sample of students was randomly selected from all grades and schools to participate in individual testing. 547 students ranging in age from 89 to 146 months were administered individual assessments (53% male, 77% Latino, 83% on free/reduced lunch, 58% English Language Learners, 17% identified as gifted/talented). One special education student was excluded from the present analysis because he took an alternative assessment for his state standardized test. Up to an additional 49 students were excluded from certain analyses because of missing data on one or more measure. These students do not differ significantly in any measured way from those that were included in the analyses.
Measures
Woodcock-Johnson Tests of Cognitive Abilities, Third Edition The Block Rotation subtest (Test 28) on the Diagnostic Supplement to the Woodcock-Johnson Test of Cognitive Abilities (WJ-III COG) was administered as a measure of spatial processing abilities. Block Rotation was chosen for its similarity to the Vandenberg and Kuse (1978) test that Linn and Petersen specified as most likely to have a relationship with gender (1985). The WJ-III is an individually administered, norm-referenced measure of cognitive processing, based on the Cattell-Horn-Carroll (CHC) theory of intelligence. The WJ-III Diagnostic Supplement was standardized on the same norming sample as the core battery of the WJ-III Tests of Cognitive Abilities, consisting of over 8800 individuals located in over 100 geographically diverse communities in the United States, with participants ranging in age from 24 months to 90 years (McGrew & Woodcock, 2001). Raw scores, standard score, and percentile ranks were obtained using the WJ-III Normative Update scoring software, which represents a recalculation of the original norms based on the 2000 U.S. census data. On this task, participants were asked to match two, rotated three-dimensional patterns from an array to a target picture. The reported alpha of Block Rotation is 0.84 (McGrew & Woodcock, 2001).
Among the students in our study, performance on this measure was comparable, but slightly higher than the publisher's norming sample (McGrew & Woodcock, 2001),
with a mean standardized score of 103.44 (SD= 14.53) and a
range from 39 to 149.
The California Standards Tests (CSTs) Administered to students in grades 2 through 11 attending California public schools, these tests are aligned to the state content standards and intended to measure math skills important for future mathematical success (California Standards, 2010). California chose its math content standards based on recommendations from the National Council of Teachers of Mathematics (2000)—recommendations used by many other states in crafting their own standards and assessments (e.g., Massachusetts, 2011), and the National Research Council (2010), which stresses abstract thinking and higher-order math problem solving. The math portion of the CSTs is divided into five different reporting/clustering strands, two of which are associated with Number Sense. The other three stands include Algebra and Functions, Measurement and Geometry, and Statistics, Data Analysis, and Probability.
The English-Language Arts portion of the CSTs consists of 65 questions spanning five reporting/clustering strands: Word Analysis, Reading Comprehension, Literary Response and Analysis, Writing Strategies, and Writing Conventions. Each domain of the CSTs yields an overall scaled score out of a possible 600 points, which is normed relative to grade level and percentage of problems correct for each of the clusters within the domain.
Student Demographics Information on gender, free lunch (as a measure of SES), English Learner and gifted status were collected and provided by the districts with the CST information.
Procedure
Each participant was escorted from their classroom during the school day to participate in individual testing. The purpose of the study was explained and students were given a chance to assent or decline to participate. Those who assented were given two math subtests within the WJ-III Test of Achievement along with block rotation and a measure of math motivation. Testing was conducted one-on-one by trained graduate and undergraduate students and lasted between 30 and 60 minutes. At the end of the testing session students were escorted back to their classrooms.
Results
No significant association between gender and spatial ability emerged within the data. Figure 1 displays mean spatial scores by gender across grade level. Although at each grade level there are slight differences in spatial ability between boys and girls, and it appears that after second grade girls decline in performance relative to boys, none of these differences are significant. Previous studies (see Hyde, Fennema, & Lamon, 1990; Lachance & Mazocco, 2006) have focused on the percentage differences between boys and girls among groups above/below the mean of spatial scores or in the highest vs lowest quartile. This analysis procedure may give a more interpretable result as to the capacity for advanced study in higher math and sciences.
With this in mind, Table 1 shows the percent of boys and girls by grade in the highest quartile of spatial ability. Results follow no obvious trend with respect to grade-level.
To test the hypothesis supported in Johnson and Meade (1987) and directly advanced by Voyer and Sullivan (2003) that spatial ability is more related to verbal ability than gender, regression analysis was performed. Spatial ability was regressed on gender, control covariates, and prior English Language Arts achievement score. Relationship between gender and spatial ability remained insignificant (regression results available on file with authors).
Figure 2 shows a gender comparison of math scores over grade. Scale scores provided by the California Department of Education were used to compare scores across grades. Boys transition from scoring below the mean score for girls to scoring above somewhere between third and fourth grade, but no differences are statistically significant.
80.00 90.00 100.00 110.00 120.00 2nd 3rd 4th 5th Sta n d a rd Sc o re Grade Level Block Rotation Female Block Rotation Male
Figure 1: Spatial scores by grade & gender. Error bars indicate one standard deviation within girls. Standard
deviation within boys is similar (+/- 2).
Table 1: Distribution of gender in top quartile of spatial ability.
Grade
2nd 3rd 4th 5th
Boys 24% 16% 23% 18%
Girls 40% 21% 14% 30% To determine associations between gender, spatial ability, and achievement test scores, correlations were computed as shown in Table 2. Scale scores were available only for composite math and ELA achievement scores, and raw scores available for each subtest varied between grade-level. To account for differences in numbers of items, z scores were created from raw scores within each grade for each subscore and for both composites. In this way, each student’s z score reflects their relative position to other students in their grade—only students taking the same test with the same items are compared. These z scores are used in the correlations shown and in subsequent regression analyses. 300.00 340.00 380.00 420.00 460.00 2nd 3rd 4th 5th M ean M a th CS T Sc ore Grade Level Girls Boys
Figure 2: Math achievement scores by grade & gender. Error bars indicate one standard deviation within girls. Standard
deviation within boys is larger (up to ten points).
Table 2: Correlations between spatial ability, gender & achievement test scores.
Spatial Male NS A&F M&G S&P ELA
Gender (Male) 0.024
Math Composite 0.142** -0.065
Number Sense 0.131** -0.079 0.956***
Algebra & Functions 0.132** -0.033 0.867*** 0.775***
Measurement & Geometry 0.129** 0.0049 0.855*** 0.736*** 0.696***
Statistics & Probability 0.080 -0.063 0.629*** 0.540*** 0.496*** 0.502***
ELA Composite 0.110* -0.107* 0.776*** 0.758*** 0.674*** 0.644*** 0.503***
Note. * p<0.05 ** p<0.01 ***p<0.001. Spatial ability is WJ III Block Rotation reported with standardized scores based on age. Math and ELA scores are z score rank by grade of California Standards Test. Spatial ability was not significantly correlated with English Language Learner status, use of ST Math software, free lunch status, grade level or age relative to grade-level peers, though was correlated with gifted status r(501) = .10, p < .05 Correlations of items with male gender status shown, correlations with female gender are the reverse.
Significant correlations exist between spatial ability and almost all achievement scores, including ELA scores. The one math subscore that did not show a relationship with spatial ability is the Statistics and Probability cluster, which involves the analysis and interpretation of data in various forms, including visual representations. As might be expected from the descriptive statistics and figures, gender (male) is not correlated with spatial or math scores within our sample, but is negatively correlated with the ELA composite score, suggesting a female advantage in the subject.
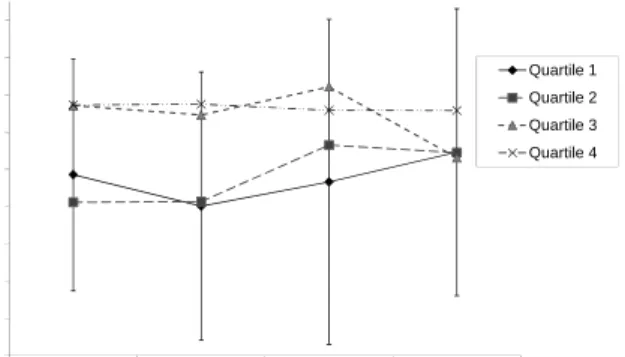
To further explore the relationship between spatial ability and mathematics achievement, student position in spatial ability quartile was compared with the CST composite math score. Figure 3 illustrates differences in math achievement between high and low performers on the spatial ability measure, but none of these differences reach significance, nor do the gaps widen with age as would be suggested from studies such as those reviewed in Hyde, Fennema, and Lamon (1990).
Zero-order correlations can under- or overestimate the relationship between two variables (Voyer & Sullivan, 2003). To determine a truer estimate of the relationship between spatial ability and different math clusters, regression analysis was employed. Separate regressions were run for math composite score and four CST math clusters for second through fifth graders. Because topics in clusters one and two, both labeled “Number Sense,” varied between grades, a composite one/two cluster was created from scores on both of these clusters and z scored as an aggregated unit for each grade. To account for differences between grades, grade-level fixed effects were employed so that coefficients represented the mean effect across grade. Standard errors were adjusted by clustering on school site.
Table 3 shows stepwise regression results for math composite score. Interactions of spatial ability with gender, grade, age relative to grade-level peers, ST Math use, gifted and English Language Learner statuses were tested with ANOVA and found to be non-significant and were therefore not included in these analyses. In the initial equation, spatial ability has a significant relationship with math composite score which diminishes as covariates are added to the model.
Once English Language Arts composite score is added to the model, the relationship between spatial ability and math score is reduced to insignificance and declines from an effect size of .14 to .08 (coefficient divided by RMSE for each model as specified in Brooksgunn, Liaw, & Klebanov, 1992). All other cluster scores behave similarly except for Statistics/Probability, which has a more modest relationship reduced to insignificance with the addition of only demographic covariates. Final models for each cluster group are shown in models five through eight in Table 3.
Discussion
Bolstering the idea that gender differences are not apparent in elementary-aged children, we failed to find any sex advantage for either spatial ability or math achievement. Researchers in the area of spatial abilities struggle with consistent definitions of constructs and uniformity of measures, and this no doubt has a great impact on the variability in results; however, that we found this null relationship with a test of mental rotation, the test thought to be most highly related to gender (Linn & Petersen, 1985), is an illuminating contribution. Our failure to find a difference between boys and girls can be interpreted in a number of ways. As other researchers have suggested, sex differences may be diminishing over generations (Lachance & Mazzocco, 2006), or may not appear or appear only inconsistently in younger populations (Hyde, Fennema, & Lamon, 1990). Our data indicate no gender differences as the participants approach 12, an age below that at which earlier studies had detected gender differences (e.g. Linn & Petersen, 1985).
Previous speculation has been controversial as to whether controlling for spatial ability would increase (Voyer & Sullivan, 2003) or decrease (Hyde, Geiringer, & Yen, 1975) the relationship between gender and mathematics. Within our data, adding a spatial ability control did little either way to the association between gender and mathematics. As with the gender and spatial ability results, the variation in measure may have contributed to this finding: different test items and testing conditions may no doubt display different relationships to gender. However, the use of a broad math measure incorporating varied levels and topics in mathematics adds validity to our findings.
280 300 320 340 360 380 400 420 440 460 2nd 3rd 4th 5th S cal e Sco re Grade Level Quartile 1 Quartile 2 Quartile 3 Quartile 4
Figure 3: Mean math scale score for each quartile of spatial ability and grade. Scale scores designed to be comparable across grades. Error bars represent one standard deviation
for Quartile 1 scores, which were the scores with the smallest standard deviation
Table 3: Math composite and cluster scores regressed on spatial ability and covariates. (1) (2) (3) (4) (5) (6) (7) (8) Math Comp Math Comp Math Comp Math Comp Number Sense Algebra & Functions Measure
& Geom Statistics
Spatial Ability 0.14 ** 0.10* 0.05 0.05 0.05 0.05 0.02 (0.05) (0.04) (0.03) (0.03) (0.03) (0.04) (0.03) Gender (Male) -0.13 -0.12 -0.11 0.06 0.02 0.10 0.12 -0.04 (0.09) (0.09) (0.08) (0.05) (0.06) (0.06) (0.07) (0.08) Uses ST Math 0.01 0.09 0.12 0.03 0.05 0.05 (0.11) (0.06) (0.06) (0.07) (0.08) (0.08) Is in Gifted Program 0.75*** 0.20** 0.14 0.31** 0.31** 0.12 (0.11) (0.07) (0.09) (0.09) (0.09) (0.09) ELL Status -0.36 *** 0.08 0.12 0.05 0.08 -0.06 (0.10) (0.06) (0.06) (0.08) (0.08) (0.08) Free Lunch Status -0.24* -0.12 -0.11 -0.16* -0.09 -0.02 (0.10) (0.07) (0.08) (0.07) (0.11) (0.09) ELA Composite Score 0.74*** 0.74*** 0.63*** 0.62*** 0.47*** (0.03) (0.04) (0.03) (0.03) (0.04) _cons 0.00 -0.01 0.34 *** 0.09 0.07 0.16** 0.10 0.04 (0.05) (0.05) (0.06) (0.05) (0.05) (0.05) (0.07) (0.06) N 543 503 502 502 501 501 497 497 R2 0.004 0.025 0.174 0.611 0.584 0.475 0.425 0.248
Note. Standard errors in parentheses, *p < 0.05, **p < 0.01, ***p < 0.001 Spatial Ability is WJ III Block Rotation, z score of standard score. Achievement test scores are z scores within each grade, 2-5. Fixed effects used for grade-level, standard errors clustered on school site. Age relative to same-grade peers not shown (zero coefficient). All reported demographics centered on zero, for interpretability of main coefficients.
Apart from the gender question, spatial ability itself has been thought to relate strongly to higher math and sciences and to be integral to the development of our nation’s 21st century competitive workforce (Committee on Support for Thinking Spatially, 2006). Drawing on these ideas, educators, researchers and those with influence on policy have called for the development of spatial thinking in our children, including those in elementary school (Committee on Support for Thinking Spatially, 2006; NCTM, 2000). The belief in a firm spatial/math connection at all ages supports these goals, but has been erratically demonstrated in the literature. While a more robust relationship has been found between spatial ability and older students, this relationship often pales when compared to the relationship between verbal and mathematical achievement (Friedman, 1995). Among the young students in the present study, the spatial/math relationship is all but completely attenuated by the addition of a verbal (ELA) control variable to the regression models. Granted, state standardized assessments such as the CSTs were not developed to test spatial ability or likely even those technical skills required in many spatially-related math and science careers. However, such high-stakes tests focus on the skills and areas policy-makers have deemed important to our developing workforce (Committee on Support for Thinking Spatially, 2006; NCLB, 2002), and these tests have been theorized to include clusters and problems related to spatial skills, even at the young ages included in this study (Committee on Support for Thinking Spatially, 2006).
If spatial abilities are not significantly related to skills assessed in high-stakes tests such as the CSTs, perhaps the tests themselves are flawed. If spatial thinking is a skill that is valuable and necessary for future innovation and competence in mathematics, it appears that state standardized tests are missing a critical assessment of our children’s progress toward contributing to our nation.
And what of the diminishing relationship of spatial ability and math once an ELA measure is included? The influence of spatial ability on math may be merely the result of an underlying academic skill such as following directions, attentional control, or working memory. As students age, perhaps these underlying abilities are parceled out and specialize into spatial and language-analytic components. Research using targeted measures and a wide range of student ages is better-suited to answer this question.
Looking forward, there may be analyses that can find the link between gender, spatial ability, and math within certain standardized test problems, such as those that target complex problem solving, an area more strongly associated with gender and spatial ability (Geary, 2000). Because the structure of the CSTs embeds problem solving within all five math clusters, it was difficult to isolate this skill. Our study presents initial evidence that both educational goals and assessments thought to invoke spatial ability may be off the mark, more focused research can indicate how and when these areas can be better aligned or can indicate other cognitive building blocks more highly related to math achievement.
Acknowledgments
The research reported here was supported by the Institute of Education Sciences, U.S. Department of Education, through Grant R305A090527 to the University of California, Irvine. The opinions expressed are those of the authors and do not represent views of the Institute or the U.S. Department of Education.
References
AAUW (2010). Why so Few? Women in Science,
Technology, Engineering, and Mathematics.
Washington, DC: AAUW. Retrieved from AAUW website: http://www.aauw.org/research/whysofew.cfm Brooksgunn, J., Liaw, F., & Klebanov, P. (1992). Effects of early intervention on cognitive function of low birth weight preterm infants†. The Journal of Pediatrics, 120(3), 350-359. doi:10.1016/S0022-3476(05)80896-0
California State Board of Education (2010). K-12
California's common core content standards for mathematics. Retrieved on April 28, 2011 from
http://www.scoe.net/castandards/agenda/2010/math_ccs_r ecommendations.pdf
Casey, M. B., Nuttall, R. L., & Pezaris, E. (2001). Spatial-mechanical reasoning skills versus mathematics self-confidence as mediators of gender differences on mathematics subtests using cross-national gender-based
items. Journal for Research in Mathematics Education,
32, 1, 28-57.
Committee on Support for Thinking Spatially. (2006).
Learning to think spatially: GIS as a support system in the K-12 curriculum. Washington, DC: National Academies Press.
Floyd, R. G., Evans, J. J., & McGrew, K. S. (2003). Relations between measures of Cattell-Horn-Carroll (CHC) cognitive abilities and mathematics achievement
across the school-age years. Psychology in the Schools,
40(2), 155-171.
Friedman, L. (1995). The Space Factor in Mathematics:
Gender Differences. Review of Educational Research,
65(1), 22 -50. doi:10.3102/00346543065001022 Geary, D. (2000). Sex differences in spatial cognition, computational fluency, and arithmetical reasoning, Journal of Experimental Child Psychology, 77(4), 337 353. doi:10.1006/jecp.2000.2594
Hyde, J., Fennema, E., & Lamon, S. (1990). Gender
differences in mathematics performance: a meta-analysis. Psychological bulletin, 107(2), 139-55.
Hyde, J. S., Geiringer, E. R., & Yen, W. M. (1975). On the Empirical Relation Between Spatial Ability and Sex Differences in Other Aspects of Cognitive Performance.
Multivariate Behavioral Research, 10(3), 289. Johnson, E., & Meade, A. C. (1987). Developmental
patterns of spatial ability: An early sex difference. Child Development, 58(3), 725.
Lachance, J., & Mazzocco, M. (2006). A longitudinal
analysis of sex differences in math and spatial skills in
primary school age children☆. Learning and Individual
Differences, 16(3), 195-216. doi:10.1016/j.lindif.2005.12.001
Linn, M. C., & Petersen, A. C. (1985). Emergence and characterization of sex differences in spatial ability: A meta-analysis. Child Development, 56(6), 1479-1498. Massachusetts Department of Elementary and Secondary
Education (2011). Massachusetts curriculum framework
for mathematics. Retrieved on April 28, 2011 from http://www.doe.mass.edu/frameworks/math/0111.pdf McGrew, K. S., & Woodcock, R. W. (2001). Technical manual. Woodcock-Johnson III. Itasca, IL:
Riverside Publishing.
National Research Council. (2001). Adding it up: Helping
children learn mathematics. Kilpatrick, J., Swafford, J., & Findell, B. (Eds.). Mathematics Learning Study
Committee, Center for Education, Division of Behavioral and Social Sciences and Education. Washington, DC: National Academy Press.
NCTM (2000). Principles and standards for school mathematics. Reston, Va.: National Council of Teachers of Mathematics.National Research Council.
No Child Left Behind Act of 2001, 20 U.S.C. § 1111 (2008).
Rutherford, T., Kibrick, M., Burchinal, M., Richland, L., Conley, A., Osborne, K.,…Martinez, M. E. (2010). Spatial Temporal Mathematics at Scale: An Innovative and Fully Developed Paradigm to Boost Math
Achievement Among All Learners. Available from ERIC database. (ED510612)
Taub, G. E., Keith, T. Z., Floyd, R. G., & Mcgrew, K. S. (2008). Effects of general and broad cognitive abilities on
mathematics achievement. School Psychology Quarterly,
23(2), 187-198. doi:10.1037/1045-3830.23.2.187 Voyer, D., & Sullivan, A. (2003). The relation between
spatial and mathematical abilities: Potential factors
underlying suppression. International Journal of
Psychology, 38(1), 11-23.