©
2004, Editrice Kurtis
ORIGINALRESEARCH PAPER
Key words: Teasing, body image, underweight. Correspondence to: Jennifer D. Lundgren, University at Albany-SUNY, Department of Psychology, Social Sciences 369, Albany, New York 12222, USA E-mail: [email protected]
Perception of teasing in underweight
persons: A modification of the
perception of teasing scale
J.D. Lundgren*, D.A. Anderson*, J.K. Thompson**, J.R. Shapiro*, and C.A. Paulosky*
*Department of Psychology, University at Albany, the State University of New York, Social Sciences 369, Albany, NY, and **Department of Psychology, University of South Florida, Tampa, FL, USA
ABSTRACT.The psychometric properties of the Perception of Teasing Scale-Underweight, a modified version of the Perception of Teasing Scale (1), were examined. One hundred eighty-three college students (81 male; 102 female; age range 17-57 years) completed questionnaires about underweight-related and competency-related teasing experiences, eating attitudes, body image, self-esteem, and mood. Factor analysis suggested the Perception of Teasing Scale-Underweight has a two-factor structure, measuring both underweight-related and com-petency-related teasing experiences. Significant correlations (p<0.05) were found between the Perception of Teasing Scale-Underweight, Beck Depression Inventory, Fear of Negative Appearance Evaluation Scale, Multidimentional Body-Self Relations Questionnaire-Appearance Scales, Multiaxial Eating Disorder Scale, Social Physique Anxiety Scale, and Rosenberg Self-Esteem Scale. The pattern of correlations differed between the entire sample and those with a body mass index <21. One-way analysis of variance analyses found signifi-cant differences (p<0.05) between those with body mass index (BMI) <21 and those with BMI >21 for the weight-related event and weight-related impact scales, indicating that the measure discriminates between those individuals most likely to have been underweight as adolescents versus those most likely to have been normal weight or overweight. This measure provides a sound psychometric tool for examining underweight-related and competency-related teasing experiences. The impact of appearance and competence related teasing in underweight per-sons is less well understood than in overweight samples; therefore, future work should be conducted with a more underweight sample to bridge this gap in the literature.
(Eating Weight Disord. 9: 139-146, 2004). ©2004, Editrice Kurtis
INTRODUCTION
A history of being teased about physical appearance has been associated with nega-tive body image, eating and exercise related disturbances, and low self-esteem (2-4). Thompson et al. (4) utilized structural equa-tion modeling and found that teasing influ-enced restrictive eating behavior, which in turn affected psychological functioning and bulimic symptomatology. The same study also found teasing history to meditate the relationship between level of obesity and body image, thereby suggesting that level of obesity does not have a direct influence on body image disturbance (4).
Faith et al. (2) examined the relationship between weight criticism encountered dur-ing physical activity and children’s exercise attitudes and behaviors. Results found that children who were criticized about weight
during physical activity were less likely to enjoy exercise or engage in mild-intensity physical activity. The relationship was mod-erated by the children’s coping strategies, but nonetheless suggested that weight-related criticism can have a negative impact on positive health behavior.
These findings highlight the importance of teasing in the development of negative health behaviors and psychopathology. To date, however, researchers have almost exclusively examined teasing experience in the context of being overweight or obese. The consequences of being teased because one is under a desired weight or does not have a desired muscle mass are less well understood.
Research suggests that being under-weight may also have negative psychosocial consequences. Harmatz et al. (5) examined the impact of being underweight in males
©
2004, Editrice Kurtis
on body image satisfaction and interpersonalfunctioning. They found that underweight men (defined as less than 10% of the average weight for their reference group determined by Metropolitan Life Insurance Tables) had body image dissatisfaction and dating/romantic con-cerns at levels similar to those for overweight females. Lox et al. (6) found social physique anxiety, body image dissatisfaction, depression, and self-esteem scores in underweight females [mean body mass index (BMI)= 17.97] compara-ble to those typically reported for overweight samples. Data such as these suggest that teas-ing history should be assessed in underweight individuals just as it has been in overweight samples.
Given that teasing about an elevated weight status in adolescence has been associated with increased negative body image and disordered eating behaviors in adulthood, there is a need to examine the impact of teasing in individuals who were underweight, especially those who are dissatisfied with their physique (7). It is possible that a history of teasing about under-weight poses a risk for social physique anxiety and muscle dysmorphia, as well as unhealthy behaviors such as steroid use and overeating. Currently, however, there are no scales avail-able to assess teasing history in underweight individuals.
Thompson et al. developed the Perception of Teasing Scale (POTS;1) to assess overweight-related teasing history and its consequences. This two-factor scale targets overweight-relat-ed teasing and competency relatoverweight-relat-ed teasing, and has been used to assess the impact of teasing about overweight on the development of nega-tive body image and disordered eating behav-iors (1). The purpose of the current study was to examine the psychometric properties of a modified POTS, the POTS-U, designed to assess the impact of teasing in persons who were underweight as adolescents. It was hypothesized that the POTS-U would have a factor structure similar to the original POTS. Correlational analyses were conducted between the POTS-U and measures of eating attitudes, body image, mood, and self-esteem to examine the measure’s convergent validity. It was hypothesized that the POTS-U would show convergent validity with these constructs. Additionally, one-way analysis of variance test-ed for differences in the POTS-U between the BMI categories low-average (BMI <21), average (BMI 22-24), and high (BMI >25). It was hypoth-esized that there would be statistically signifi-cant differences between the three BMI groups for the underweight-related event and impact scales.
METHOD
Participants
One hundred eighty-three undergraduate college students (81 male, 102 female) partici-pated in the study. Height and weight were measured by laboratory research assistants; shoes were not worn when obtaining the measurements. Table 1 shows anthropometric data for men and women separately. Because analyses were conducted on a sub-sample with BMI <21, anthropometric data for the sub-sample, separate for males and females, are presented in Table 1. The mean age of the total sample was 20.3±4.7 years. Fifty-eight percent of the total sample were Caucasian, 7% were African American, 10% were Asian, 8% were Hispanic, and 17% indicated other or did not respond.
Scale development
The POTS-U is a modification of the POTS (1). The scale was developed by modifying questions one through six of the original POTS to reflect underweight related teasing experiences. For each question one through six, the words “heavy,” “overweight,” and “fatso” were replaced with “thin,” “under-weight”, and “scrawny,” respectively. All other items remained as they were in the original scale. The scale is composed of event related and impact related questions (i.e., par-ticipants are asked if the event occurred, and if so, what impact the event had them). The appendix shows the final version of the POTS-U after factor analysis.
Additional measures
Beck Depression Inventory II (BDI-II)
The Beck Depression Inventory II (8) is a 21-item measure that assesses behavioral signs of depression. Internal consistency for the BDI-II is high (0.92); the measure has been shown to have a test-retest correlation of 0.93 (8).
TABLE 1
Anthropometric data for total sample and sub-sample with BMI <21. Height (Meters) Weight (Kg) BMI
Mean (SD) Mean (SD) Mean (SD) Total sample Men 1.77 (0.06) 79.42 (19.56) 25.2 (4.6) Women 1.63 (0.07) 62.77 (14.45) 23.5 (4.7) BMI <21 Men 1.91 (0.04) 64.99 (4.24) 19.7 (0.9) Women 1.63 (0.07) 51.57 (5.85) 19.3 (1.4) BMI= Body mass index.
©
2004, Editrice Kurtis
Body Image Assessment Obesity (BIA-O)The BIA-O (9) consists of eighteen silhouettes for both males and females that range from very thin to very obese. Body dissatisfaction is conceptualized as the difference between cur-rent and ideal body shape scores. Two week test-retest reliability for the current body shape score is 0.77 for males and 0.93 for females; test-retest reliability for ideal body shape is 0.81 for males and 0.77 for females (9). The body dissatisfaction score has been shown to have concurrent validity with other measures of body image dissatisfaction (9).
Fear of Negative Appearance Evaluation Scale (FNAES)
The FNAES (10) is a 6-item self-report mea-sure which assesses apprehension about appearance evaluation. The internal consisten-cy is high (0.94) and the measure has good con-vergent validity with measures of body image, eating disturbance, anxiety, and mood.
Multidimensional Body-Self Relations Questionnaire-Appearance Scales (MBSRQ-AS) The MBSRQ-AS (11) is comprised of five sub-scales, Appearance Evaluation, Appearance Orientation, Body Areas Satisfaction, Overweight Preoccupation, and Self-Classified Weight. Appearance Evaluation measures one’s feelings of physical attractiveness; Appearance Orien-tation measures the effort one devotes to appear-ance; Body Areas Satisfaction measures one’s satisfaction with specific aspects of the body; Overweight Preoccupation measures one’s con-cern with weight and dieting; Self Classified Weight measures one’s perception of weight ranging from very underweight to very over-weight (11). Cronbach’s alpha for the scales ranges from 0.70 (Self-Classified Weight; males) to 0.88 (Appearance Evaluation; males and females); test-retest correlations range from 0.81 (Appearance Evaluation; males) to 0.91 (Appearance Evaluation; females).
Multiaxial Eating Disorder Scale (MAEDS) The MAEDS (12) is a 52 item self-report inventory measuring depression, binge eating, purgative behavior, fear of fatness, restrictive eating, and avoidance of forbidden foods. Coefficient alphas for the sub-scales range from 0.80 (purgative behavior) to 0.92 (binge eating); test-retest correlations for the sub-scales range from 0.89 (binge eating) to 0.96 (restrictive eating).
Social Physique Anxiety Scale (SPAS)
The SPAS (13) measures anxiety about physique-related negative evaluation. Women
scoring high on the SPAS were found to weigh more and have higher percent body fat com-pared to women scoring low (13). The measure has been shown to have high internal consis-tency (coefficient alpha= 0.90) and test-retest reliability (r= 0.82).
Rosenberg Self-Esteem Inventory (RSE) The RSE (14) inventory is a 10-item report inventory measuring feelings of self-worth. It is a frequently used measure of gener-al self-esteem and has often been used in research in the areas of body image and eating disorders (15). Research has found the RSE to have a coefficient alpha of 0.89 (16).
Procedure
The study was approved by the University at Albany, State University of New York Institutional Review Board and conducted in accordance with current ethical guidelines. Students were recruited from the psychology department’s research participant pool via sign-up sheets posted in the department. Participants were undergraduate students enrolled in psy-chology courses at the University at Albany, State University of New York. Students received course credit for participating in the study. Upon obtaining informed consent for participation, students’ height and weight were measured and they were asked to complete the POTS-U and the aforementioned questionnaires assessing eating attitudes, body image, self-esteem, and mood.
RESULTS
Factor analysis
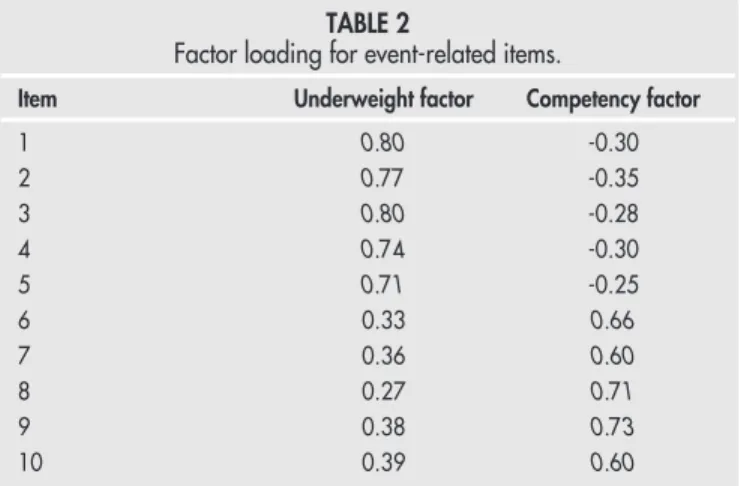
A principal components factor analysis was conducted using the entire sample (n=183) on the 11 event related POTS-U questions. Scree plot and eigenvalues (3.8 and 2.6) suggested there were two factors, similar to the weight related and competency related factors found in the original POTS analyses (1). The question, “People laughed at you for trying out for sports because you were too thin” did not load highly on either factor and was excluded from further analyses. Factor 1, underweight-related events, accounted for 34.5% of the variance; factor 2, competency-related events accounted for 23.8% of the variance. The correlation between the two factors was 0.12, p>0.05. Table 2 pre-sents the factor loadings for the 10 event items remaining after factor analysis.
The final measure consisted of four sub-scales: event, underweight-impact, event, and competency-impact. Descriptive analyses found the mean
©
2004, Editrice Kurtis
and standard deviation for each scale to be thefollowing: underweight-event=7.2 (3.6), under-weight-impact=6.9 (3.8), competency-event =10.9 (3.6), and competency-impact 10.5 (4.4). Forty-six percent of the sample endorsed underweight-related impact questions and 69% endorsed competency-related impact ques-tions. This suggests that nearly half of the sam-ple had no underweight-related experiences, whereas approximately only one third of the sample had no competency-related teasing experiences.
Reliability analyses
The final scale consisted of 10 event questions (five underweight-related and five competency-related) and the corresponding 10 impact ques-tions. Cronbach’s alpha for the underweight-related event factor was 0.87; Cronbach’s alpha for the competency-related event factor was 0.80. Table 3 shows item-total correlations for the final 10 event questions.
Validity analyses
Correlation analyses were conducted bet-ween the four POTS-U scales (Underweight-Event, Underweight-Impact, Competency-Event, Competency-Impact) and the previously mentioned measures for the entire sample and for those participants with a BMI of less than 21 (n=41). We chose to conduct additional cor-relational analyses on this group because they were most likely to have been underweight during adolescence and because this sample provided an adequate sample size for analyses. The same BMI cut-off was chosen for males and females because the BMI measurement is standardized across gender (e.g., a BMI of 25 or greater is considered overweight regardless TABLE 2
Factor loading for event-related items.
Item Underweight factor Competency factor
1 0.80 -0.30 2 0.77 -0.35 3 0.80 -0.28 4 0.74 -0.30 5 0.71 -0.25 6 0.33 0.66 7 0.36 0.60 8 0.27 0.71 9 0.38 0.73 10 0.39 0.60
Italicized numbers indicate the question loaded on that factor.
TABLE 3
Item-total correlations for event-related items. Item Underweight factor Competency factor
item-total item-total 1 0.88** -2 0.88** -3 0.85** -4 0.77** -5 0.71** -6 - 0.74** 7 - 0.69** 8 - 0.74** 9 - 0.82** 10 - 0.74** TABLE 4
Correlations among POTS-U scales and other measures for all participants.
Weight Weight Competency Competency
event impact event impact
(n= 183) (n=84) (n=183) (n=127) BDI 0.19* 0.08 0.39** 0.46** BIA-O Diss -0.15* -0.09 0.02 0.23* FNAES 0.05 0.12 0.33* 0.51** MBSRQ-AE 0.10 0.03 -0.09 -0.27** MBSRQ-AO 0.00 0.13 0.22** 0.29** MBSRQ-BAS 0.00 0.00 -0.15* -0.35** MBSRQ-OP -0.22** -0.09 0.16* 0.28** MSBRQ-SCW -0.33** -0.19 0.04 0.27** M-DEP 0.07 0.00 0.44** 0.50** M-BNG -0.02 -0.08 0.27** 0.43** M-PRG -0.07 -0.11 0.18* 0.28** M-FAT -0.01 0.03 0.24** 0.40** M-RST 0.00 0.00 0.20* 0.39** M-AVD -0.12 0.05 0.10 0.30** SPAS 0.00 0.10 0.26** 0.48** RSE 0.00 0.00 -0.23** -0.40**
BMI=Body mass index; Weight Event=POTS-U underweight-related teasing event scale; Weight Impact=POTS-U underweight-related teasing impact scale; Competency Event=POTS-U competency-related teasing event scale; Competency Impact=POTS-U competency-related teasing impact scale; BDI=Beck Depression Inventory; BIA-O Diss=Body Image Assessment for Obesity Current Body Shape minus Ideal Body Shape; MBSRQ-AE=Multidimensional Body-Self Relation Questionnaire-Appearance Evaluation Scale; MBSRQ-AO= Multidimensional Body-Self Relation Questionnaire-Appearance Orientation Scale; MBSRQ-BAS=Multidimensional Body-Self Relation Questionnaire-Body Areas Satisfaction Scale; MBSRQ-OP=Multidimensional Body-Self Relation Questionnaire-Overweight Preoccupation Scale; MBSRQ-SCW=Multidimensional Body-Self Relation Questionnaire- Self Classified Weight Scale; M-DEP=Multiaxial Eating Disorder Scale-Depression; M-BNG=Multiaxial Eating Disorder Scale- Binge Eating; PRG=Multiaxial Eating Disorder Scale-Purgative Behavior; M-FAT=Multiaxial Eating Disorder Scale-Fear of Fatness; M-RST=Multiaxial Eating Disorder Scale-Restraint; M-AVD=Multiaxial Eating Disorder Scale-Avoidance of Forbidden Foods; SPAS=Social Physique Anxiety Scale; RSE=Rosenberg Self-Esteem Scale; *p<0.05; **p<0.01.
©
2004, Editrice Kurtis
of gender (17). Results of the analyses can beseen in Tables 4 and 5.
Analyses revealed that the underweight-relat-ed scales (event and impact) had few significant correlations with measures of mood, eating atti-tude and behavior, and body image for either the entire sample or the sub-sample with BMI <21. When using the entire sample, analyses found significant negative correlations between the POTS-U underweight-related event scale and body image dissatisfaction (difference between current body shape score and ideal body shape score measured by the Body Image Assessment; r= -0.15) and the Overweight Preoccupation (r= -0.22) and Self-Classified Weight (r= -0.33) scales of the Multidimentional Body-Self
Relations Questionnaire. There was a significant positive correlation between the Beck Depression Inventory and the underweight-relat-ed event scale (r= 0.19). When examining those with BMI <21, only the Social Physique Anxiety Scale was significantly correlated with the POTS-U underweight-related event scale (r= 0.32).
Competency-related teasing experiences were found to correlate significantly with the other measures included in the study. When examining the entire sample, either one or both of the competency-related scales (i.e., event or impact) correlated significantly with all other measures (r ranged from -0.40, RSE to 0.51, FNAES).
In the BMI <21 sub-sample, analyses found a significant negative correlation between the competency-related event scale and the Body Areas Satisfaction sub-scale of the MBSRQ (r= -0.31). Significant positive correlations were found between the competency-related event scale and the SPAS (r=0.41), depression scale of the MAEDS (r= 0.42), binge eating sub-scale of the MAEDS (r= 0.31), FNAES (r= 0.49), and BDI (r= 0.48). When examining the compe-tency-related impact scale, one negative corre-lation was found with the RSE (r= -0.41). Significant positive correlations were found between the competency-related impact scale and the SPAS (r= 0.48), MBSRQ Overweight Preoccupation sub-scale (r= 0.41), MAEDS depression sub-scale (r= 0.52), MAEDS binge eating sub-scale (r= 0.44), MAEDS purgative behavior sub-scale (r=0.41), MAEDS dietary restraint sub-scale (r= 0.46), MAEDS avoidance of forbidden foods sub-scale (r=0.37), FNAES (r= 0.55), and BDI (r=0.63).
To determine if weight status led to differen-tial responding on the POTS-U, a one-way analysis of variance was conducted on the four POTS-U sub-scales between three levels of BMI. The categories low-average (BMI <21), average (BMI 22-24) and high (BMI >25) were compared. Results found significant omnibus differences for the underweight-related event sub-scale (F(2, 178)= 12.55; p <0.001) and under-weight-related impact sub-scale (F(2,80)= 3.19; p <0.05). No significant differences were found for the competency event or impact sub-scales.
Follow-up analyses of the underweight-relat-ed impact sub-scale found that the low-average BMI group (mean score= 9.4) reported more teasing frequency than the average BMI (mean score= 6.6) and the high BMI group (mean score= 6.3; p<0.001). Additionally, the low-aver-age BMI group (mean score= 8.4) had a higher level of underweight-related teasing impact than the average BMI group (mean score= 5.9; p<0.01). No significant differences in level of TABLE 5
Correlation between POTS-U scales and other measures for participants with BMI <21.
Weight Weight Competency Competency
event impact event impact
(n=42) (n=25) (n=42) (n=33) BDI 0.18 -0.02 0.48** 0.63** BIA-O Diss -0.15 0.00 0.04 0.21 FNAES 0.18 0.18 0.49** 0.55** MBSRQ-AE -0.17 -0.05 -0.20 -0.16 MBSRQ-AO -0.08 0.19 0.19 0.26 MBSRQ-BAS -0.25 -0.14 -0.31* -0.34 MBSRQ-OP 0.00 0.04 0.23 0.41* MSBRQ-SCW -0.26 -0.14 0.07 0.25 M-DEP -0.05 -0.14 0.42** 0.52** M-BNG 0.00 -0.34 0.31* 0.44* M-PRG -0.08 -0.29 0.16 0.41* M-FAT 0.08 0.22 0.19 0.33 M-RST 0.00 -0.03 0.27 0.46** M-AVD -0.03 0.22 0.10 0.37* SPAS 0.32* 0.25 0.41* 0.48** RSE -0.05 0.10 -0.30 -0.41*
Weight Event=POTS-U underweight-related teasing event scale; Weight Impact=POTS-U underweight-related teasing impact scale; Competency Event=POTS-U competency-related teasing event scale; Competency Impact=POTS-U competency-related teasing impact scale; BDI=Beck Depression Inventory; BIA-O Diss=Body Image Assessment for Obesity Current Body Shape minus Ideal Body Shape; MBSRQ-AE=Multidimensional Body-Self Relation Questionnaire-Appearance Evaluation Scale; MBSRQ-AO=Multidimensional Body-Self Relation Questionnaire-Appearance Orientation Scale; MBSRQ-BAS=Multidimensional Body-Self Relation Questionnaire-Body Areas Satisfaction Scale; MBSRQ-OP=Multidimensional Body-Self Relation Questionnaire-Overweight Preoccupation Scale; MBSRQ-SCW=Multidimensional Body-Self Relation Questionnaire- Self Classified Weight Scale; M-DEP=Multiaxial Eating Disorder Scale-Depression; M-BNG=Multiaxial Eating Disorder Scale- Binge Eating; PRG= Multiaxial Eating Disorder Scale-Purgative Behavior; M-FAT=Multiaxial Eating Disorder Scale-Fear of Fatness; M-RST=Multiaxial Eating Disorder Scale-Restraint; M-AVD=Multiaxial Eating Disorder Scale-Avoidance of Forbidden Foods; SPAS=Social Physique Anxiety Scale; RSE= Rosenberg Self-Esteem Scale; *p<0.05; **p<0.01.
©
2004, Editrice Kurtis
impact were found between the low-averageBMI group and the high BMI group (mean score= 6.6; p= 0.09 ).
DISCUSSION
The purpose of the current study was the development of a new measure of under-weight related teasing, the POTS-U. Factor analyses revealed that this measure has a two-factor structure, underweight-related teasing and competency-related teasing. This factor structure is identical to the original POTS. Reliability analyses suggested that internal consistency was slightly higher for the weight-related event scale than the com-petency-related event scale, however both scales had an acceptable reliability.
Correlational analyses with the entire sample revealed significant negative correlations between the weight-related event sub-scale, body image dissatisfaction, overweight preoc-cupation, and self-classified weight and a posi-tive correlation between the weight-related event sub-scale and depression. This pattern of correlations supports the convergent validity of the underweight-related event sub-scale. No significant correlations were found between the weight-related impact sub-scale and the other measures.
In those most likely to have been under-weight during adolescence (BMI <21), only social physique anxiety was correlated with the underweight-related event sub-scale. Similar to the results utilizing the entire sample, no signif-icant correlations were found between the underweight-related impact sub-scale and the other measures included in the study. The limit-ed relationship between the underweight-relat-ed sub-scales with the other measures could be due to a variety of factors. First, the number of subjects included in these analyses was fewer than when using the entire sample, which could have resulted in lowered power to detect significant correlations. Second, the frequency of underweight-related teasing experiences may occur so infrequently that there is little variability in the responses, thereby limiting the ability of the scale to correlate with other measures. Finally, it may be the case that the underweight-related teasing experiences do not correlate with these variables, but with other variables that have yet to be examined (e.g., exercise behavior or muscle building sup-plement use).
Convergence with other measures was higher for the competency-related scales than the underweight-related scales. Interestingly, the
competency-related POTS-U scales (i.e., event and impact) correlated significantly not only with measures of mood and self-esteem, but also with measures of eating behavior, eating atti-tude, and body image anxiety. It may be the case that these measures are correlated because of a third, unmeasured variable (e.g., general dis-tress). Nonetheless, competency-related teasing does appear to be correlated with measures that are known to assess risk for mood, body image, and eating related pathology. These findings suggest that competency-related teasing should be examined (e.g., covary competency-related teasing from weight related teasing) when assessing the impact of teasing experience on the development of eating and body image pathology. Additionally, the findings are indica-tive of a strong connection between competency teasing and many of the measures of distur-bance in the current study suggest that a fruitful arena of future investigation would be to exam-ine the construct of competency teasing in greater detail.
Overall, interpretation of the correlational analyses was limited in two respects. First, the experience of teasing because one is under-weight may occur infrequently, thereby creat-ing a floor effect in the responses (i.e., many “never” responses). The limited variability of responses thus limits the ability of the scale to correlate with other measures. Second, the number of persons responding to event-related questions was greater than those responding to impact-related questions. This could have reduced the power to detect correlations with the impact scales.
Analysis of variance analyses provided sup-port for the POTS-U’s ability to differentiate between those of low-average, average, and high BMI classification when measuring under-weight-related teasing. This provided support for the validity of the weight-related teasing scales. Significant differences were not found between the three BMI categories for the com-petency related teasing experiences, providing further support that the scale measures two different constructs (i.e., underweight and com-petency related teasing).
Results of this study suggest that the POTS-U has good psychometric characteristics, and has the potential to be useful in studies examining risk for social physique anxiety, muscle dys-morphia, and unhealthy behaviors such as steroid use and overeating. However, future research should examine this measure with truly underweight or muscle dysmorphic popu-lations, possibly increasing the variability of participant responses. Doing so would allow for continued examination of the concurrent
©
2004, Editrice Kurtis
and predictive validity of the measure, andwould fill a gap in the literature assessing the impact underweight has on the development of psychopathology.
APPENDIX
POTS-U
Directions: The following questions should be answered with respect to the period of time when you were growing up (ages 5-16). First rate how often you think you have been the object of such behavior (using the scale provid-ed, never to very often). Second, unless you responded never to a particular question, rate how upset you were by the teasing (not upset to very upset).
1. People made fun of you because you were too thin.
Never Sometimes Very often 1 2 3 4 5
1a. How upset were you?
Not upset Somewhat upset Very upset 1 2 3 4 5
2. People made jokes about you being too thin.
Never Sometimes Very often 1 2 3 4 5
2a. How upset were you?
Not upset Somewhat upset Very upset 1 2 3 4 5
3. People called you names like “scrawny.”
Never Sometimes Very often 1 2 3 4 5
3a. How upset were you?
Not upset Somewhat upset Very upset 1 2 3 4 5
4. People pointed at you because you were too thin.
Never Sometimes Very often 1 2 3 4 5
4a. How upset were you?
Not upset Somewhat upset Very upset 1 2 3 4 5
5. People snickered about your thinness when you walked into a room.
Never Sometimes Very often 1 2 3 4 5
5a. How upset were you?
Not upset Somewhat upset Very upset 1 2 3 4 5
6. People made fun of you by repeating something that you said because they thought it was dumb.
Never Sometimes Very often 1 2 3 4 5
6a. How upset were you?
Not upset Somewhat upset Very upset 1 2 3 4 5
7. People made fun of you because you were afraid to do something.
Never Sometimes Very often 1 2 3 4 5
7a. How upset were you?
Not upset Somewhat upset Very upset 1 2 3 4 5
8. People said you acted dumb.
Never Sometimes Very often 1 2 3 4 5
8a. How upset were you?
Not upset Somewhat upset Very upset 1 2 3 4 5
9. People laughed at you because you didn’t understand something.
Never Sometimes Very often 1 2 3 4 5
9a. How upset were you?
Not upset Somewhat upset Very upset 1 2 3 4 5
10. People teased you because you didn’t get a joke.
Never Sometimes Very often 1 2 3 4 5
10a. How upset were you?
Not upset Somewhat upset Very upset 1 2 3 4 5
REFERENCES
1. Thompson J.K., Cattarin J., Fowler B., Fisher E.: The perception of teasing scale (POTS): A revision and extension of the physical appearance related teasing scale (PARTS). J. Person. Assess., 65, 146-157, 1995. 2. Faith M.S., Leone M.A., Ayers T.S., Heo M., Pietrobelli
A.: Weight criticism during physical activity, coping skills, and reported physical activity in children. Pediatrics, 110, 23, 2002.
3. Grilo C.M., Wilfley D.E., Brownell K.D., Rodin J.: Teasing, body image, and self-esteem in a clinical sample of obese women. Addict. Behav., 19, 443-450, 1994.
4. Thompson J.K., Coovert M.D., Richards K.J., Johnson S., Cattarin J.: Development of body image, eating dis-turbance, and general psychological functioning in female adolescents: Covariance structure modeling
©
2004, Editrice Kurtis
and longitudinal investigations. Int. J. Eat. Disord., 18, 221-236, 1995.
5. Harmatz M.G., Gronendyke B.A., Thomas B.A.: The underweight male: The unrecognized problem group in body image research. J. Obes. Weight Reg., 4, 258-267, 1985.
6. Lox C.L., Osborn M.C., Pellett T.L.: Body image and affective experiences of subjectively underweight females: Implications for Exercise Behavior. J. Appl. Biobehav. Res., 3, 110-118, 1998.
7. Thompson J.K., Heinberg L.J., Altabe M., Tantleff-Dunn S.: Exacting beauty: Theory, assessment and treatment of body image disturbance. Washington, DC, American Psychological Association, 1999. 8. Beck A.T.: The Beck Depression Inventory II. San
Antonio, Harcort Brace Company, 1996.
9. Williamson D.A., Womble L.G., Zucker N.L., Reas D.L., White, M.A., Blouin D.C., Greenway F.: Body image assessment for obesity (BIA-O): Development of a new procedure. Int. J. Obes., 24, 1326-1332, 2000.
10. Lundgren J.D., Anderson D.A., Thompson J.K.: Fear of negative appearance evaluation scale: Psychometric properties and validation. Eat. Behav., 5, 75-84, 2004.
11. Cash T.F.: The Multidimensional Body-Self Relationship Questionnaire: Users’ manual, 3rd ed., 2000. Available from the author at www.body-images.com.
12. Anderson D.A., Williamson D.A., Duchmann E.G., Gleaves D.H., Barbin J.M.: Development and validation of a multifactorial treatment outcome measure for eat-ing disorders. Assessment, 6, 7-20, 1999.
13. Hart E.A., Leary M.R., Rejeski W.J.: The measurement of social physique anxiety. J. Sport Exerc. Psychol., 11, 94-104, 1989.
14. Rosenberg M.: Society and the adolescent self-image. Princeton, Princeton University Press, 1965.
15. Demo D.H.: The measurement of self-esteem: Refining our methods. J. Person. Soc. Psychol., 48, 1490-1502, 1985.
16. Van den Berg P., Thompson J.K., Obremski-Brandon K., Coovert M.: The tripartite model of body image and eating disturbance: A covariance structure modeling investigation testing the mediational role of appear-ance comparison. J. Psychom. Res., 53, 1007-1020, 2002.
17. World Health Organization. Obesity: Preventing and managing a global epidemic. Geneva, Switzerland, 1996.