A Methodology for Integrating and Exploiting Data Mining Techniques in the
Design of Data Warehouses
Muhammad Usman
School of Computing and Mathematical Sciences Auckland University of Technology
Auckland, New Zealand [email protected]
Russel Pears
School of Computing and Mathematical Sciences Auckland University of Technology
Auckland, New Zealand [email protected]
Abstract—Data Warehousing and Data Mining are two mature disciplines in their own right. Yet, they have developed largely separate from each other, despite the fact that techniques developed for pattern recognition such as Clustering and Visualization in the Data Mining discipline have much to offer in the design of Data Warehouses. This is somewhat surprising, given that the two disciplines have broadly the same set of objectives, although the techniques that they employ are admittedly quite different from each other. This may be due to the lack of a suitable methodology for integrating methods such as clustering and pattern visualization into data warehousing design. In this research, we propose such a methodology and report on its application to two case studies involving real world data taken from the UCI Machine Learning repository. We demonstrate how data clustering and visualization methods, working in conjunction with each other can be used to gain new insights and build more meaningful dimensions which may not be obvious to human data warehouse designers.
Keywords- Automatic Schema; Clustering; Data Mining; Multidimensional Analyis;Warehouseing
I. INTRODUCTION
The extensive use of computers and information technology has led to the creation of extensive data repositories from a very wide variety of application areas [1]. Such vast data repositories can contribute significantly towards future decision making provided appropriate knowledge discovery mechanisms are applied for extracting hidden, but potentially useful information embedded in the data [2]. One of the main mechanisms of knowledge discovery is the efficient analysis of data using modern analytical techniques. A difficult barrier to the efficient analysis of data is the presence of a mixture of numeric and nominal variables in real-world data sets. Well developed algorithms and techniques have been proposed in the literature for the analysis of numeric data but little research has been carried out to tackle the problem of mixed numeric and nominal data analysis. Traditional methodologies assume variables are numeric, but as application areas have grown from the scientific and engineering domains to the biological, engineering, and social domains, one has to deal with features, such as country, color, shape, and type of disease, that are nominal valued [1]. In addition to the problem of efficient analysis of mixed data, high cardinality nominal variables with large number of distinct values such
as product codes, country names and model types are not only difficult to analyze but also require effective visual exploration methods [3]. Visualization techniques are becoming increasingly important for the analysis and exploration of large multidimensional data sets [4]. However, the effectiveness of visualization techniques such as parallel coordinates [5, 6] are determined by the order in which attributes are displayed [7]. Moreover, accurate spacing among the attribute values is mandatory to recognize the semantic inter-relations that exist in the underlying data.
The major focus of this research is the seamless integration of data mining techniques into the design of data warehouses. The two disciplines, namely data warehousing and data mining are both mature in their own right but little research has been carried out in integrating these two strands of research. The key problem is that for the integration to occur in a seamless manner, the data has to be modeled in a data warehouse schema. Data warehouse modeling is a complex task, which involves knowledge of business processes of the domain of discourse, understanding the structural and behavioral system’s conceptual model, and familiarity with data warehouse technologies [8].Given the sheer volume of data normally involved in the building of a data warehouse, a case can be made for automated support in the construction of the warehouse schema in order to capture the patterns and trends that are needed in schema construction. The human data warehouse designer, with his/her knowledge of the domain can supply some of these patterns, but there will always be cases when such knowledge has to be augmented with automatic pattern generation methods.
To overcome the problems mentioned above we propose a novel methodology for the seamless integration of data mining techniques into data warehousing design. In this methodology we employed hierarchical clustering and parallel coordinates techniques to aid the automatic design of well known STAR schema. The proposed methodology has been implemented and case studies are performed using two real world data sets namely Automobile[9] and Adult[10]. For Hierarchical clustering we utilized the Hierarchical Clustering Explorertool [11], and for visualization we used the XmdvTool[12]. Microsoft Analysis Services [13] was used for the construction of data cube from the automatically generated STARschema. Experimental results indicate that the proposed methodology allows efficient analysis (nominal and numeric), effective visualization and an effective method
for enhancing the design of a human generated data warehouse schema. Moreover, the resultant schema allows users to perform analysis based on the natural groupings present in the underlying dataset. To the best of our knowledge, the proposed methodology is significant as there is no other methodology reported in the literature that incorporates efficient data analysis (nominal and numeric), effective data visualization, and support for the automation of schema generation.
The rest of the paper is organized as follows: Section 2 presents an overview of prior work relevant to our research objectives. In Section 3, we present the details of the proposed methodology. Section 4 presents the implementation detail. Our case study results are discussed in Section 5 and in Section 6 we conclude the paper with a summary of the achievements of the research and discuss some possible directions for future research.
II. RELATED WORK
Real world data sets consist of a mix of numeric and nominal data. Efficient analysis of mixed data using data mining techniques such as clustering is related to our work. Besides the abundance of clustering algorithms for numerical data, minute efforts have been directed at clustering nominal data. Several clustering algorithms were proposed in the past to touch mixed data analysis problem. For scalable clustering of mixed data, orthogonal partitioning clustering algorithm [14] was introduced which was later extended by the authors in [15] for the purpose of clustering large databases with numeric and nominal values using orthogonal projections. To achieve the similar objective, fuzzy clustering algorithm [16] based on probabilistic distance feature, an agglomerative algorithm based on distinctness heuristics and Evidence based spectral clustering (EBSC) algorithm [17] based on evidence accumulation were introduced in the recent past. On the other hand, authors in [18] introduced three different distance measure functions based on Mahalanobis-typedistance measure for the efficient analysis of mixed data. Another distance measure, using the cost function based on co-occurrence of categorical values was offered to overcome the limitations of the traditional k-means algorithm and to support mixed data analysis [2]. Hierarchical clustering has also been employed by the authors in [19] for mixed data based on distance hierarchy. The distance between the categorical values was expressed through a hierarchical data structure.
Our work is similar in terms of efficient analysis of mixed data but the proposed work is neither proposing a new algorithm nor a fresh distance measure to conquer mixed data analysis problem. We are employing hierarchical clustering technique as an initial step of the proposed methodology to produce natural clusters from the data based on numeric variables. For the nominal data, especially the variable having high cardinality, we intend to use a visualization technique known as parallel coordinates to identify and analyze the nominal variables within each data cluster. The Parallel coordinates technique has been used by in the past for the effective visualization of data. Authors in
[5] used this technique with the help of some extensions for the effective exploration of complex data sets. Similarly, another efficient approach to construct frequency and density plots from parallel coordinates was introduced [20]. In parallel coordinates technique, order and spacing among the variables on the coordinates play a vital role for the extraction of useful information. Meaningful spacing among high cardinality values helps in interpretation of results and in recognition of meaningful patterns from the underlying data values. A major limitation of parallel coordinates technique is that it is suitable for small number of dimensions or variables. Its effectiveness is inversely proportional to the number of variables. In our proposed methodology, we use this technique only to visualize the nominal data present in a data cluster. This is an effective strategy as there is less number of nominal variables in the data clusters as compared to numeric variables. Furthermore, we do not visualize the ordinal variables because the basic reason for using this visualization technique is to identify natural grouping among the categorical values for each nominal variable. For instance, we visualize variables such as Countrywhich has more distinct values as compared to an ordinal variable Sex which has only two distinct values namely male or female.
Another source of related work is the automatic generation of warehouse schema. A Model-transformation architecture has been proposed in order to facilitate the automatic schema generation process [21]. The implementation of their work has been done in an open source development platform to automatically generate schema from conceptual multidimensional model. Likewise, an Object-process-based Data Warehouse Construction (ODWC) method was suggested for the purpose of automatic schema construction [8]. The authors in [22], proposed a technique that takes a list of database schema in the form of entity-relationship(ER) model as input and produce a schema as output. Another similar approach using ER diagrams was presented a few years later using a prototype system known as SAMSTAR[23].This research shares the same objective of automatic schema generation as we use hierarchical clustering and parallel coordinates techniques in conjunction with each other to identify the various dimensional groupings or hierarchies and measure within a data cluster. These natural groupings based on the underlying dataset can assist the schema design and generation process.
Finally, we discuss the work relevant to the utilization of hierarchical clustering technique in data warehouse environment. Recently, a conceptual model was proposed for combining enhanced OLAP and data mining system [24]. However, the proposed model was not integrated with automatic generation of schema and lacked experimental evaluation as well. Another architecture was proposed by the authors in [25] to extend the work of [26] and provided a way of integrated enhancement of warehouse schema using self-organizing neural networks. In this paper, we present a methodology which integrates hierarchical clustering and data visualization techniques to automatically produce warehouse schema based on the dimensional hierarchies and
groupings which are based on the underlying dataset and are not obvious to the human data warehouse designer.
III. PROPOSED METHODOLOGY
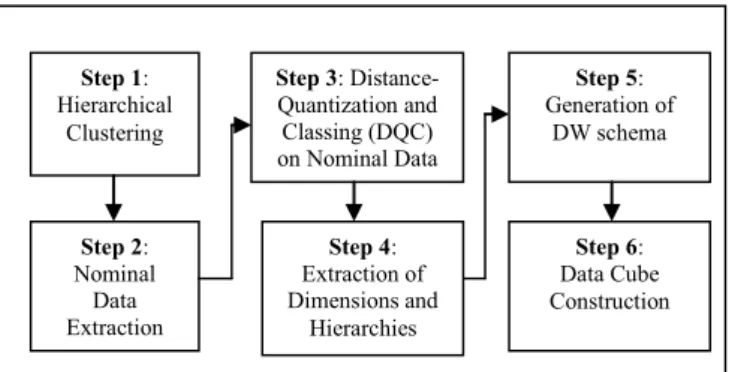
In this section, we propose a methodology for the seamless integration of data mining and data warehousing. Figure 1 gives the overview of the proposed methodology.
Figure 1: Overview of proposed methodology
For its introduction, we present the motivation of the proposed methodology. The question arises, what role does data mining play in enhancing the design of data warehouses?To answer this important question, we begin the explanation starting with the overview of the previous section of literature review. It is evident from the literature review that none of the previous work done in the past has addressed the efficient analysis of numeric and high cardinality nominal variables, effective visualization, automatic schema generation and integration of ware housing and mining in a single framework.
Several works [24-31] suggested that with the integration of data mining with the warehousing system a number of benefits can be achieved. In this paper, we have used the hierarchical clustering technique for the efficient analysis of data as a pre-processing step of data mining. In addition to this, we use the Distance-Quantization-Classing (DQC)[3] approach for the effective visualization of the high cardinality nominal variables. Moreover, we utilize the natural grouping in each nominal variable along with the numerical values in each cluster to aid the automatic schema generator by providing a natural dimensional hierarchy that has been mined from the data to build a warehouse schema. Most of the previous work for automatic schema generation used ER diagram or conceptual graphical models to automate the process. To our knowledge, none of the work reported in the literature used effective visualization results based on the underlying dataset to find the natural grouping within the high cardinality nominal variables, and to aid the schema generation process. There is a strong requirement for the development of advanced integrated data mining and warehousing methodologies, frameworks and algorithms to support decision making [32]. To fulfill the growing requirements and to overcome the existing limitations, a novel methodology for the integration of data mining and warehousing is required.
The proposed methodology consists of a series of steps to meet its objective of integrating data mining with warehousing. The description of each step involved in the methodology is explained below.
A. Hierarchical Clustering of Numeric Data
In this step, the hierarchical clustering technique is applied to the data set to generate clusters based on a similarity measure. The most common similarity measures include complete-linkage, average-linkage, and single-linkage. The reason for choosing hierarchical clustering is that it tends to produce natural clusters instead of performing unnecessary merges and splits like other clustering approaches. Furthermore, it allows users to set parameters to determine the proper number of clusters. As most of the clustering algorithms works well on numeric variables, in this step, we target the numeric variables in order to get the optimal results.
B. Extraction of Numerical Facts/Measures
In step 2, the numerical data present within each cluster is being extracted. The reason for this extraction is that these numerical values are the facts or measures within the data which forms the input to the automatic schema generation process. In data warehouses the numerical attributes represent core potential measures which the analysts want to visualize from different dimensional perspectives.
C. Application of Distance-Quantification-Classing (DQC) technique on Nominal data
After getting the hierarchical clusters and extracting the numerical values, DQC approach is applied on each cluster, for the mapping of nominal data into numeric data for effective visualization. The purpose of this application is that in real-world data sets there typically exist a number of nominal variables which have high cardinality. For example country names and produce codes are typical examples of the high cardinality nominal variables. The DQC approach maps the nominal values in to numeric values for effective visualization. Additionally, the approach assigns order and spacing among the variable values in a manner that conveys relationships and associations in the data items. For instance, the DQC approach can group the product codes or country names that are closer to each other based on the other variables in the underlying data set. This assignment of order and spacing is done in such a way that the distance between the two values in the nominal space is preserved in the numeric space.
D. Extraction of Dimensions and Hierarchy
Following step 3, the mapped nominal to numeric values are extracted. These values are responsible for defining the groups in each dimension and the dimensional hierarchy. These extracted values are to be fed into the automatic schema generator to model the dimensional hierarchy in the data warehouse schema.
Step 1: Hierarchical Clustering Step 2: Nominal Data Extraction Step 3: Distance-Quantization and Classing (DQC) on Nominal Data Step 4: Extraction of Dimensions and Hierarchies Step 5: Generation of DW schema Step 6: Data Cube Construction
E. Data Warehouse Schema Generation
In step 4, the extracted values from the previous step 2 and step 4, become the input to the automatic schema generator. Automatic schema generator first reads the input dimensions and measures. Secondly, handles the dimensional hierarchies. Schema generator module identify the natural groupings of the values within each dimension and name the group i.e. Group 1, Group 2 to Group N.Each of the groups created by the schema generator is then assigned the values which are closer to each other in the mapped numeric space (details are discussed in the case study).Thirdly, creates a fact table and manages the relationships among the fact and dimension tables. As an output, this step gives a star schema and also populates the data in the corresponding dimension and fact tables using automatically generated queries.
F. Data Cube Construction
Finally, when the schema has been generated, the data cube is being constructed to allow various data warehouse operations such as drill-down, roll-up, slicing and dicing and pivoting. The construction of data cube allows the flexibility to add/remove the dimensions and to control the granularity of the warehouse analysis.
IV. IMPLEMENTATION DETAILS
In this section, based on our implementation, we discuss details of the implementation steps of the proposed methodology. We have performed case studies on two real world data set from the UCL machine learning repository, namely Automobileand Adult dataset to validate the results of our proposed methodology. However, due to lack of space we discuss only one case study in this paper. The results of case study on Automobile data set are in line with the case study performed on Adult data set.
A. Case Study- Adult Data Set
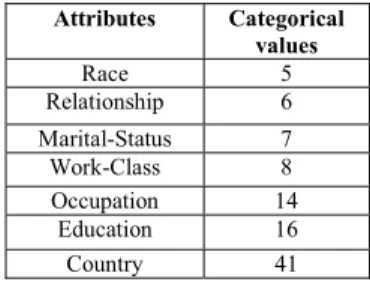
We performed case study by using a relatively large Adult data set. The data set contain 48842 records with 9 nominal and 6 numeric variables. The distribution of the high cardinality variables present in the data set is given in Table 1. As done in the previous study, we have used the HCE tool to generate hierarchical clusters from this data set using the numeric attributes. The same hierarchical clustering parameters of Euclidean distance and complete linkage were defined to guide the clustering process.
TABLE I. HIGH CARDINALITY NOMINAL VARIABLES IN ADULT
DATASET Attributes Categorical values Race 5 Relationship 6 Marital-Status 7 Work-Class 8 Occupation 14 Education 16 Country 41
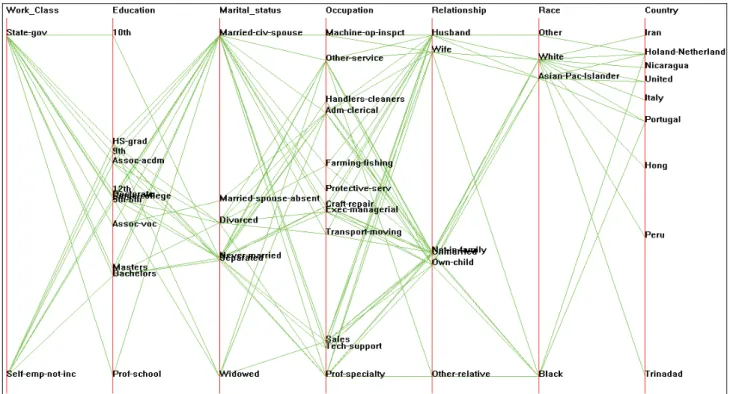
At the similarity value of 0.59, three clusters were produced, each having their individual hierarchy. In the next step, we extracted the numeric values from each cluster and stored them in an Excel file. After the extraction of numeric facts, we applied DQC to the nominal attributes. Using Xmdvtool, we visualize the nominal variables along with the assigned grouping and ordering with the help of parallel coordinates visualization technique. Figure 2 displays the resultant of cluster 1 of the mapped data. As done in the previous study, we have used the HCE tool to generate hierarchical clusters from this data set using the numeric attributes. The same hierarchical clustering parameters of Euclidean distance and complete linkage were defined to guide the clustering process. At the similarity value of 0.59, three clusters were produced, each having their individual hierarchy.
It is clear that the groupings of the high cardinality values can easily be visualized with the help of parallel coordinates display. It can be seen that for the Education variable, there are three well defined groups. Group1 is comprised of HS-Grad, 9t.h and Assoc-acdm. While, Group 2 contains 12t.h, Doctorate, Some-college and 5th-6th and the third consists of Masters & Bachelors. The Xmdvtool uses mapped numeric values for the nominal variables. These values numeric values along with the attribute names are exported in XML format. Figure 3 shows the structure of the XML file exported for the purpose of identifying possible dimensions and dimensional grouping. It can be seen from the file that the names within each variable which are close to each other are actually the ones who have very close values as indicated by the circled values.
The exported XML file and the Excel file having the numeric facts in the cluster are input to the automatic schema builder to generate data warehouse schema in the same way as discussed in the previous case study. The automatically generated schema contained six dimensions namely Dim_Education, Dim_MaritalStatus, Dim_Occupat,Dim_Education,Dim_MaritalStatus,Dim_Rel
ationship, Dim_Race and Dim_Country. The measures in the generated fact table are capital-gain, capital-loss, hours-per-week and final-weight. From these dimensions and measures, in the final step of our proposed methodology, we construct the data cube. In the next section will highlight the results and discussions.
V. RESULTS AND DISSCUSSION
The results of the studies are discussed pertaining to the Adult data set which characterizes an example of large size and complexity. This section is divided into four subdivisions. We discuss the results with respect to each of our objectives that we aimed to achieve in our proposed methodology. One of the important aspects of the proposed methodology is the efficient analysis of mixed numeric and nominal data. Most of the clustering algorithms work well on the numeric data only but fail to produce meaningful clusters when mixed data is provided. In order to achieve efficient
analysis of mixed data we applied a series of different methods. We first cluster the data set with respect to the numeric attributes and obtain hierarchical clusters. On the basis of numeric attribute clustering, HCE tool provided us 3 clusters at the top level for Adult data set. The resulting clusters were based on the distance measure and which works well for numeric data. However, the problem is that for the efficient analysis we cannot rely on the clustering result based on numeric data only. After obtaining the initial clustering we applied DQC approach on the nominal data of each of the three clusters to identify the grouping and correlation among each variable within each cluster. With the application of DQC approach effective visualization has been achieved. Parallel coordinates of the XmdvTool highlighted the natural groupings of the underlying data set within each cluster.
For the sake of discussion, we compare the grouping among some high cardinality nominal variables of the two clusters, Cluster1and Cluster2produced from the Adult data set. We compared four variables namely Education, Marital-Status, Occupation, and Country.It has been observed that the number of groups for a given variable in Cluster1 and the values within each group are different when compared with Cluster2. For instance, in Cluster1 result, Education has 1 group that contains (12t.h, Doctorate,5-6,some-college). In Cluster2 the same variable has no group containing (Doctorate) and furthermore (5-6) is totally absent in the variable values. This shows that each cluster has its own groupings or relationships based on the underlying data set. In our proposed methodology, we use these variables as dimensions and the groupings within each variable as possible dimensional hierarchy levels. The Parallel Coordinates technique helps the user to visualize these grouping among the nominal values which improves the effectiveness of the visual display. Furthermore, the numeric facts and the dimensions and hierarchy levels are fed into the automatic schema generator to give a star schema as an output. As discussed in the case study, the schema generator produced a schema on using the Adultdata Cluster 1 with 6 dimension and 4 measures. All the numeric values extracted from each cluster become potential measures and the high cardinality nominal variables become the dimensions. With these dimensions and measures a multi-dimensional data cube was generated.
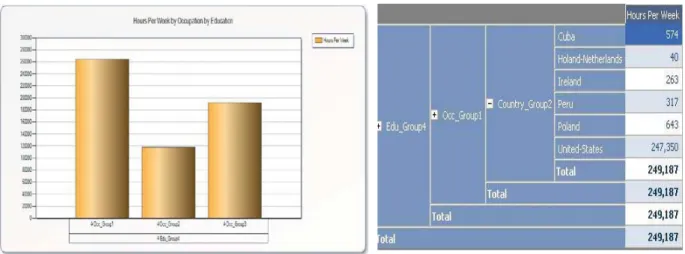
We show a few results with the help of some OLAP operations how the data cube in Cluster1 can facilitate warehouse analysis for the end-user. Suppose the analyst poses the query: Which particular country, with what occupation, with which group of education has the highest number of work hours in Cluster1.First, we see the desired measure (hours-per-week) with education dimension and find out which group has the maximum hours-per-week numeric value. Figure 4 depicts the result using our developed prototype for cube data visualization. In this case, Group 4 of education has the highest value. We select Group 4 and then select the occupation dimension. Within the occupation dimension we identify that Group 1 has the highest value among all as shown in Figure 5. We move forward and select Country as an additional dimension and
drill down into the individual country names and can easily find out that in Cluster 1 of the Adultdata set United States is the country with highest number of hours per work as shown in Figure 6. In addition to this we also identified the two groups, Group 2 of education having (12, Doctorate, some-college) and Group1 of occupation having ( Machine-operator, Adm-clerical, other-services) are the two groups from education and occupation dimension which has the highest values. Finally, the proposed methodology integrates the data mining technique of hierarchical clustering with data warehousing. Efficient analysis of data, effective visualization and the automation in schema generation are the added advantages of the proposed methodology.
VI. CONCLUSION AND FUTURE WORK
In this paper, we proposed a novel methodology for the integration of data mining with data warehousing. The focus of this work is to overcome the existing limitation identified in the literature and to accomplish the ever growing requirement of modern analytical systems. We used hierarchical clustering and automated the warehouse schema generation process. Additionally, we demonstrated that efficient analysis and effective visualization of mixed nominal and numeric data is a very important but often neglected task. We have validated the methodology by performing case studies on two real world datasets. Results show that with the seamless integration of data mining and warehousing, the analytical capabilities of the modern analytical system can be enhanced remarkably. The proposed methodology is significant as it incorporates efficient data analysis, effective data visualization and automation of schema generation.
In future we intend to incorporate more sophisticated visualization techniques for the exploration of clustered data. In addition to this, we are working on the overall improvement of the proposed methodology to make it more effective, efficient and suitable for large and complex data sets.
REFERENCES
[1] C. Li, and G. Biswas, “Unsupervised learning with mixed numeric and nominal data,” IEEE Transactions on Knowledge and Data Engineering,vol. 14, no. 4, pp. 673-690, 2002. [2] A. Ahmad, and L. Dey, “A k-mean clustering algorithm for
mixed numeric and categorical data,” Data & Knowledge Engineering,vol. 63, no. 2, pp. 503-527, 2007.
[3] G. E. Rosario, E. A. Rundensteiner, D. C. Brown et al., “Mapping nominal values to numbers for effective visualization,” Information Visualization,vol. 3, no. 2, pp. 80-95, 2004.
[4] M. Ankerst, S. Berchtold, and D. A. Keim, “Similarity clustering of dimensions for an enhanced visualization of multidimensional data,” in Proceedings of the IEEE Symposium on Information Visualization(InfoVis), 1998, pp. 52.
[5] Y. H. Fua, M. O. Ward, and E. A. Rundensteiner, "Hierarchical parallel coordinates for exploration of large datasets." pp. 43-50. [6] J. X. Chen, and S. Wang, “Data visualization: parallel
coordinates and dimension reduction,” Computing in Science & Engineering,vol. 3, no. 5, pp. 110-112, 2001.
[7] A. O. Artero, M. C. F. de Oliveira, and H. Levkowitz, "Enhanced high dimensional data visualization through dimension reduction and attribute arrangement." pp. 707-712.
[8] D. Dori, R. Feldman, and A. Sturm, “From conceptual models to schemata: An object-process-based data warehouse construction method,” Information Systems,vol. 33, no. 6, pp. 567-593, 2008. [9] J. C. Schlimmer. "UCI repository of machine learning databases,
"http://archive.ics.uci.edu/ml/datasets/Automobile"," 20-May-2010, 2010; http://archive.ics.uci.edu/ml/datasets/Automobile. [10] Kohavi. R, and Becker. B. "UCI repository of machine learning
databases,"http://archive.ics.uci.edu/ml/datasets/Adult"," 20 May, 2010; http://archive.ics.uci.edu/ml/datasets/Adult.
[11] J. Seo, M. Bakay, P. Zhaoet al., "Interactive color mosaic and dendrogram displays for signal/noise optimization in microarray data analysis." pp. 461-464.
[12] M. O. Ward, "Xmdvtool: Integrating multiple methods for visualizing multivariate data." pp. 326-333.
[13] S. Soni, and W. Kurtz, “Analysis Services: optimizing cube performance using Microsoft SQL server 2000 Analysis Services,” Microsoft SQL Server 2000 Technical Articles, 2001. [14] B. L. Milenova, and M. M. Campos, "O-cluster: scalable
clustering of large high dimensional data sets." pp. 290–297. [15] B. L. Milenova, and M. M. Campos, "Clustering large databases
with numeric and nominal values using orthogonal projections." [16] C. Doring, C. Borgelt, and R. Kruse, "Fuzzy clustering of
quantitative and qualitative data." pp. 84-89.
[17] H. Luo, F. Kong, and Y. Li, “Clustering mixed data based on evidence accumulation,” Advanced Data Mining and Applications,vol. 4093, pp. 348-355, 2006.
[18] B. McCane, and M. Albert, “Distance functions for categorical and mixed variables,” Pattern Recognition Letters,vol. 29, no. 7, pp. 986-993, 2008.
[19] C. C. Hsu, C. L. Chen, and Y. W. Su, “Hierarchical clustering of mixed data based on distance hierarchy,” Information Sciences, vol. 177, no. 20, pp. 4474-4492, 2007.
[20] A. O. Artero, M. C. F. de Oliveira, and H. Levkowitz, “Uncovering clusters in crowded parallel coordinates
visualizations,” in Proceedings of the IEEE Symposium on Information Visualization(InfoVis), 2004, pp. 81-88.
[21] J. Pardillo, and J. N. Mazón, “Designing OLAP schemata for data warehouses from conceptual models with MDA,” Decision Support Systems, 2010, 2010.
[22] L. Palopoli, L. Pontieri, G. Terracinaet al., “A novel three-level architecture for large data warehouses* 1,” Journal of Systems Architecture,vol. 47, no. 11, pp. 937-958, 2002.
[23] I. Y. Song, R. Khare, Y. Anet al., "Samstar: An automatic tool for generating star schemas from an entity-relationship diagram." pp. 522-523.
[24] M. Usman, S. Asghar, and S. Fong, "A Conceptual Model for Combining Enhanced OLAP and Data Mining Systems." pp. 1958-1963.
[25] M. Usman, S. Asghar, and S. Fong, “Integrated Performance and Visualization Enhancement of OLAP Using Growing Self Organizing Neural Networks,” Journal of Advances in Information Technology,vol. 1, no. 1, pp. 26-37, 2010.
[26] S. Asghar, D. Alahakoon, and A. Hsu, “Enhancing OLAP functionality using self-organizing neural networks,” Neural, Parallel & Scientific Computations, vol. 12, no. 1, pp. 1-20, 2004.
[27] S. Goil, and A. Choudhary, “PARSIMONY: An infrastructure for parallel multidimensional analysis and data mining,” Journal of parallel and distributed computing,vol. 61, no. 3, pp. 285-321, 2001.
[28] R. B. Messaoud, O. Boussaid, and S. Rabaséda, "A new OLAP aggregation based on the AHC technique." pp. 65-72.
[29] H. Zhu, “On-line analytical mining of association rules,” Department of Computer Science, Simon Fraser, 1998.
[30] J. Fong, H. K. Wong, and A. Fong, “Online analytical mining web-pages tick sequences,” Journal of Data Warehousing,vol. 5, no. 4, pp. 59-67, 2000.
[31] J. Han, “Towards on-line analytical mining in large databases,” ACM Sigmod Record,vol. 27, no. 1, pp. 97-107, 1998.
[32] T. Piton, J. Blanchard, H. Briandet al., "Domain driven data mining to improve promotional campaign ROI and select marketing channels." pp. 1057-1066.
Figure 3. Structure of the exported XML file
Figure 4. Result of Cluster 1 data showing 1 measure (hours-per-week) with Education groups