RED-GENE: An Evolutionary Game
Theoretic Approach to Adaptive Data
Stream Classification
HOSSEIN GHOMESHI1, MOHAMED MEDHAT GABER2, AND YEVGENIYA KOVALCHUK.3
1
School of Computing and Digital Technology, Birmingham City University, Birmingham, United Kingdom (e-mail: [email protected])
2
School of Computing and Digital Technology, Birmingham City University, Birmingham, United Kingdom (e-mail: [email protected])
3
School of Computing and Digital Technology, Birmingham City University, Birmingham, United Kingdom (e-mail: [email protected]) Corresponding author: Hossein Ghomeshi (e-mail: [email protected]).
ABSTRACT The extensive growth of digital technologies such as the Internet of Things (IoT), social media networks and forecasting systems has led to new challenges regarding computational complexity and big data mining. The classification task in such applications is not trivial due to the high volume of related data and limited time available for the task. It is particularly difficult when dealing with data streams, where each instance of data is typically processed once on its arrival (i.e. online) while the underlying data distribution often changes due to the changing environment. In this paper, we propose a novel ensemble-based framework called Replicator Dynamics & Genetic Algorithms Approach (RED-GENE) for effective data stream classification in the context of changing environment leading to concept drifts (i.e. evolution of data streams). RED-GENE employs three novel Replicator Dynamics (RD) strategies along with a Genetic Algorithm (GA) optimisation technique to flexibly adapt to different types of concept drifts when performing data stream classification tasks. The proposed framework works as follows. First, a set of random feature combinations is drawn from a given pool of features of the target data stream to create different classificationtypes. Next, RD is used to allow the classificationtypesachieving higher classification accuracy to grow and those with lower accuracy to shrink. A modified version of the classic GA is then employed to optimise the randomly drawn combinations of features in each classificationtype. The proposed framework was tested using nine data streams (including both real-world and synthetic datasets) to investigate different variations of the proposed framework and compare its performance to other state-of-the-art algorithms using immediate and delayed prequential evaluation methods. The results demonstrated that the proposed framework can provide the best accuracy on average when comparing to five other state-of-the-art algorithms.
INDEX TERMS Concept Drifts, Data Stream Mining, Ensemble Learning, Evolutionary Algorithms, Non-stationary Environment.
I. INTRODUCTION
I
N many modern-world applications such as sensor net-works analysis, traffic monitoring, weather forecasting, spam filtering systems, fraud/intrusion detection, health-care systems, web searches and fault diagnosis/detection, data come mostly in the form of data streams that require online processing. This motivates researchers to focus on data stream-related tasks, especially classification in non-stationary environments [1], where the main challenge is adapting to unforeseen concept drifts. A concept drift is a change in the distribution of data that can be caused by different factors such as time, an incident, change inbe-haviour or data attributes. Different types of concept drifts can be divided into four general categories: abrupt (sudden), gradual, incremental and recurrent (reoccurring) [1].
the given context (i.e. over the most recent data instances) allows to achieve a better overall performance, the extensive range of real-world problems and their conditions make the task of tuning weights very challenging.
An ideal method for data stream classification should satisfy the following conditions. (1) Accuracy: the main challenge in all classification problems is to maintain the highest possible accuracy, or in other words, to achieve the lowest misclassification rate. (2)Efficiency: in many modern applications, there are time and memory constraints; hence, the computational complexity of an ideal method should be minimised. (3)Adaptation: once a concept drift occurs, the accuracy achieved by a classifier decreases due to the changes in the data distribution and target concept; hence, the rate of misclassification and time of recovery upon different types of concept drifts should be minimised.
Currently, there is a lack of a comprehensive approach able to satisfy all these conditions in different environments. The majority of the state-of-the-art ensemble methods for data stream classification are focused on either a specific type of concept drifts or a specific type of applications. In this paper, we propose a novel ensemble learning framework called RED-GENE that performs well regardless of the concept drift type or application. The proposed framework employs three new evolutionary game theoretic strategies based on Replicator Dynamics (RD) and Genetic Algorithm (GA) optimisation techniques to retain the classification accuracy upon different concept drifts. According to the RED-GENE approach, an ensemble of different classification types is initially generated based on random combinations of features of the target data stream. Several RD variations are then used to grow and shrink the relative contribution of eachtypeto the ensemble. The randomly selectedtypesare further optimised using a specially designed GA enabling them to cope with different concept drifts over time.
This research builds upon a novel method called Evo-lutionary Adaptation to Concept Drifts (EACD) proposed by the same authors [4]. Both the EACD and RED-GENE methods employ the same approach to creating different clas-sificationtypesand a GA optimisation technique. However, only the most basic modified version of Replicator Dynamics in streaming data was used in EACD. This study improves the EACD method and offers the following further contributions: (1) we propose three different modified versions of Repli-cator Dynamics to accelerate the concept drift adaptation process; (2) we improve the classification accuracy for the majority of the considered experimental cases; and (3) we reduce the running time of the algorithm by generating a lower number oftypeswhile improving the total accuracy.
The rest of this paper is organised as follows. Section 2 overviews related research. Section 3 details our pro-posed method. Section 4 outlines the experimental setup and presents the results of comparing the proposed approach to related state-of-the-art methods. Conclusions and future work are provided in Section 5.
II. RELATED WORK
The overwhelming majority of the existing data stream clas-sification algorithms for evolving environments use ensemble learning techniques due to their flexibility and versatility compared to single classifier techniques [1] [2] [3] [5]. Different ensemble learning methods contributing to this research area are discussed briefly below.
A large number of the state-of-the-art ensemble learning algorithms are adapted versions of bagging [6] and boost-ing [7] algorithms. OzaBag [8] is an online version of the standard bagging. According to this algorithm, when a new instance is presented to the system, each classifier chooses the exampleK ∼P oisson(1)times and updates its model accordingly. OzaBoost [8] is an online version of the standard boosting algorithm. OzaBoost is similar to OzaBag except that classifiers are trained incrementally. Hence, when a classifier misclassifies an instance, the Poisson parameter (λ) for that instance increases before introducing it to the next classifier. Otherwise, theλparameter decreases. OSBoost [9] uses a similar approach to that of the OzaBoost algorithm. In addition, it combines different weak learners by producing a connection between the batch boosting and online boosting algorithms.
Dynamic Weighted Majority (DWM) [10] uses three basic mechanisms to adapt to different concept drifts: (1) weight-ing classifiers based on their performance, (2) removweight-ing old classifiers when their performance drops below a predeter-mined threshold, and (3) adding new classifiers based on the overall performance of the ensemble.
Accuracy Updated Ensemble (AUE) [11] extends Accu-racy Weighted Ensemble (AWE) [12] by updating online component classifiers according to the current distribution of data. AUE trains all old classifiers incrementally and assign weights to them based on their error at a specific time. OAUE [13] is an online version of AUE.
RED-PSO [14] is an implicit approach that couples the Replicator Dynamics with a modification of Particle Swarm Optimisation algorithm to seamlessly adapt to different con-cept drifts. In this approach, different classificationtypesact as particles in PSO algorithms and the aim is to move the particles towards the global and local optimal solutions in each iteration of the algorithm.
The aforementioned methods are categorised as implicit methods as they do not possess an explicit concept drift detector. They try to adapt to concept drifts implicitly by up-dating the state of the ensemble according to its performance. As a result, the adaptation procedure in implicit methods may take long time since concept drifts are not detected immediately. This is opposed to explicit methods that use a concept drift detector to detect concept drifts and react to them immediately.
detector has detected a drift, all weights of the classifiers inside the ensemble are reset to one.
Adwin Bagging (AdwinBag) [16] is an approach similar to Aboost except it uses the online bagging algorithm as its learning mechanism and couples it with a concept drift detector called ADaptive WINdowing (ADWIN) [17]. When a concept drift is detected, a new classifier is added to the ensemble. Leveraging Bagging (LevBag) [18] is an extension of AdwinBag, where the amount of re-sampling is increased in the bagging technique.
Recurring Concept Drift (RCD) [19] is another explicit approach that employs a buffer to keep the context of each data type in the stream. When its concept drift detector signals ’warning’, a new classifier is generated and trained in the ensemble alongside with a new buffer. If the detector then signals ’drift’, meaning that the suspected concept drift has been approved, the system searches for a similar data type in the buffer keeping previous concepts. If a similar concept is found, the system uses it, otherwise it uses the newly created classifier.
Adaptive Random Forest (ARF) [20] algorithm, which is another explicit approach, attempts to cope with concept drifts by proposing a modification of random forest algorithm for data stream learning. ARF uses a re-sampling method along with adaptive operators to propose an efficient way of concept drift detection in non-stationary data stream classifi-cation tasks.
The main challenge with explicit methods is that they have a sudden reaction to concept drifts, which makes them sensitive to false alarms and noise. A wrongly detected con-cept drift can lead to a series of unnecessary procedures and eventually a reduced performance. Furthermore, designing a good drift detection mechanism able to detect different types of concept drifts is still a problem to address [1]. In this scenario, RD offers a smooth yet effective way to improve the performance of an ensemble by growing and shirking classi-ficationtypes. On the other hand, the main issue with implicit methods is their slow reaction to concept drifts. Using a drift detection mechanism along with a GA can initiate an immediate reaction to concept drifts and the optimisation of feature combinations in thetypes. In summary, it is feasible to have the advantages of both explicit and implicit methods by combining RD with a concept drift detection mechanism and a GA.
At the same time, evolutionary algorithms cannot be ap-plied to streaming data in their original form since the entire set of instances is not accessible to the system. Hence, we propose modified versions of classic RD and GA to make them work in online environments over data streams.
III. REPLICATOR DYNAMICS & GENETIC ALGORITHMS (RED-GENE) FRAMEWORK
This paper introduces a novel ensemble learning framework for data stream classification tasks in non-stationary envi-ronments. The proposed framework comprises two layers, the base layer and optimisation layer, described in
Sec-tions III-B and III-C, respectively. In thebase layer, several classification typesare created based on randomly selected features (subspaces) of the target data stream to form an ensemble. These classification types are trained using one of the three proposed RD strategies (see Section III-B). The combination of features inside each typesis then optimised in theoptimisation layerusing a modified GA technique.
More specifically, RD is applied to seamlessly update the ensemble according to the most recent types of data contexts. RD allows the number of well-performing classifiers to grow and that of those achieving a lower than average performance to shrink in size. As the original RD is designed specifically for static data sets, we modified it to be compatible with streaming data. As a result, we propose three new RD strate-gies to be used in our framework.
The randomly selected classificationtypesare then further optimised using a GA to enable the framework cope with different types of concept drifts. This allows the ensemble to optimise the combination of randomly selected classification
types to form a set of more efficient types according to the current concept. According to the proposed method, the training of classifiers is performed on sequential data blocks received from the data stream.
In summary, the proposed solution employs two different evolutionary-based techniques to deal with different types of concept drifts. RD is used to continuously detecting the good and poorly performingtypesto extend or shrink them accordingly. GA is used to generate new improved classifica-tiontypesout of the existing ones by iterating over the most recently received data.
A. OVERVIEW
The proposed framework employs RD and GA, an overview of which is provided in the following sub-sections.
1) Replicator Dynamics
RD is a simple model of evolution and prestige-biased learn-ing in game theory [21] [22]. It was originally designed for symmetric games with many strategies. This model as-sumes a large number of replicators (types). Each replicator is assigned a payoff value according to the interaction of different replicators and their fitness in the population. The
payoff for each replicator is then compared to an expected value (expected payoff) to determine whether a replicator is performing better or worse than the expected value. The main idea in this model is that replicators with a performance higher than the average fitness of the population increase their share in the population, while those with a performance lower than the average fitness decrease their share in the population.
The Replicator Equationis represented by the following formula:
˙
xi =xi[(W x)i−xTW x], (1)
In the proposed framework, a classification type com-prising randomly selected features of data acts as a single replicator in the replicator equation. The expected payoff for each replicator is set to the average accuracy of all replicators (classification types), while a replicator’s payoff is the average accuracy of the classifiers that are built using the same classificationtype.
2) Genetic Algorithm
GA is a well-known optimisation algorithm simulating the process of biological evolution. It is mainly used to produce optimised solutions in search problems. GA uses biologically inspired operators such asselection,crossoverandmutation
to generate a new set of solutions optimising the current set of solutions. In this study, GA is used to optimise the combination of classificationtypesin an ensemble. The rea-son for choosing GA as an optimisation technique for the proposed framework is its superiority in solving other search problems, especially when there is a large number of local optima [23], which is the case in our problem of optimising classification types. Furthermore, a similar modification of GA was successfully applied in our previous work on data stream classification [4].
The original version of GA is designed to work in a static environment, where all data are accessible at once for iterat-ing different populations of solutions over the same data and calculating the fitness of these solutions for each iteration. However, this is not the case in online environments, where data come as streams and are not available all at once.
In the proposed version of GA, the initial population is a subspace of features (types) selected randomly from a given pool of features of the target data stream, and the evaluation is performed by computing the average accuracy of each classification type. The specifics on how the proposed GA works are provided in section III-C, after detailing other elements of RED-GENE in section III-B.
B. BASE LAYER
As a first step of the RED-GENE framework, p percent of data features (attributes) are randomly selected from a pool of features of the target data stream: n = 100p ×f, whereprepresents the percentage of the attributes(features) to be selected randomly (p ∈ (0,100)),f denotes the total number of attributes of the target dataset andndenotes the total number of attributes to be chosen in this stage. Each iteration of this step creates a single classificationtypein the ensemble. Hence, it should be repeatedmtimes to generate m different classification types, each having n randomly selected attributes. In the proposed framework, m is a pa-rameter representing the maximum number of classification
typesto be selected for the ensemble and should be chosen based on the total number of attributes in eachtype.
In this study, we assume that data received by the system are in the form of data blocks of 100 instances. After receiv-ing the true labels of all instances inside each data block,m new classifiers (decision trees in this case, one for eachtype)
are trained. These classifiers are then used to classify the next instances inside the data stream. In particular, the majority voting is conducted, and the class with the biggest number of votes is considered as the final output of thebase layerof the ensemble.
Every classificationtypeis evaluated once the true labels of instances in a specific data block are available. The accuracy of each classificationtypeis assumed to be the average accu-racy of all classifiers built using the same set of features (i.e. classification type):ai = cdbi, where ci denotes the number of correctly classified instances in theithdata block anddb denotes the total number of instances in each data block. To allow the typesto reach a maturity level, the classifiers are not evaluated during the first max2 data blocks, where max denotes the maximum number of classifiers allowed in each classificationtype.
Next, the replicator dynamics step is applied (see Algo-rithm 1), where eachtype’saccuracy is taken into consider-ation and assessed with an expected payoff (as explained in Section III-A1):
a(ti)≥
Pm
i=1a(ti)
m ⇒grow
a(ti)<
Pm
i=1a(ti)
m ⇒shrink,
(2)
wherea(ti)denotes the accuracy ofithtypeandmdenotes the total number oftypes.
Once the growing and shrinkingtypesare identified using the replicator dynamics step, the pool of classifiers is re-formed based on one of the proposed strategies. In particular, the following three novel RD-based strategies are proposed in this study.
1) RD1: Weighted trees
In the original RD, the number of trees to be added to to the ensemble or to be removed from it is specified dynamically as
Ta(i) =b(a(ti)−
Pm
i=1a(ti)
m )×Tn(i)c,
Tr(i) =b(
Pm
i=1a(ti)
m −a(ti))×Tn(i)c,
(3)
whereTa(i)denotes the number of trees to add,Tr(i)denotes the number of trees to remove,a(ti)denotes the accuracy of subspace i being processed,m denotes the total number of
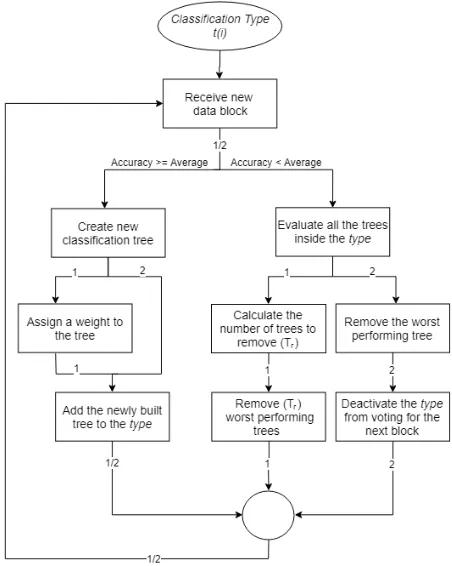
in equation 3 whenTa(i)specifies the weight to be assigned to the newly built classifier. Hence, when a classifier has a weight = k, this means in the voting mechanism the same classifier has k votes instead of only one. The removing mechanism in this strategy is similar to the original RD and is based on the performance; e.g. when the number of trees to remove isk, thekleast accurate trees (in the last data block) are removed from the ensemble. Path 1 in Figure 1 depicts the flowchart of this strategy.
2) RD2: Not considering the shrinkingtypes
According to this strategy, when a subspace is recognised as shrinking (based on its accuracy), it is temporarily elim-inated from the ensemble’s voting mechanism. The evalu-ation of such subspaces continues as normal and they are re-activated once they start to grow again. Furthermore, the number of trees to be added or removed is fixed to
Ta(i) = 1 and Tr(i) = 1, respectively. Therefore, in
case of growing/shrinking, only one tree is supposed to be added/removed. Path 2 in Figure 1 shows the flowchart of RD2.
3) RD3: Weighted trees + Not considering the shrinkingtypes
(RD1 + RD2)
This strategy combines the first two strategies (RD1 and RD2). Hence, the number of trees to add or remove is set dynamically based on Equation 3, and the shrinking oftypes
does not take place in the ensemble’s voting system unless they start to grow again. Figure 1 depicts the flowchart of this strategy.
Note that all the classifiers inside the ensemble get updated (retrained) using all the incoming data blocks. This can lead to a faster adaptation to concept drifts in the evolving data stream.
To restrict the size of the ensemble and avoid adding overhead to the system, an upper bound is assigned to the number of classifiers of classificationtype. In this paper, the upper bound is set to an arbitrary value ofmax= 20. Hence, when the maximum size of a classificationtypeis exceeded, a classifier should be removed from the same type before adding a new classifier. This is done by removing the least accurate classifier in the last data block. Furthermore, a lower bound for eachtypeis set tomin= 1to prevent thetypesto be completely removed. Hence, when only one decision tree related to a type remains, it is not being removed upon a poor performance.
C. OPTIMISATION LAYER
In this paper, we use GA to optimise the combination of attributes in each classification type (subspace) using the existing types that have been drawn randomly in the first phase of the proposed algorithm. Features in our framework act as individuals or Genes and the Classificationtypesact as chromosomes in the Genetic Algorithm. Therefore, in each iteration of the GA, the related operations (Selection, Crossover and Mutation) is applied to the population and
FIGURE 1. Illustration of different strategies of implementing Replicator Dynamics; RD1: Path 1, RD2: Path 2, RD3: Paths 1 and 2.
the fitness (of eachtype) is calculated over a fixed data that is embedded to this framework. Mentioned buffer act as a search space for the GA and stores the most recent data that is received by the system to perform the most up-to-date evaluation. Note that the buffer is kept fixed during each generation of the GA iterations.
GA is performed to all the randomly drawn classification
types(from the base layer) and perform the optimisation once a drift detector verifies a concept drift. Theoptimisation layer
is different from thebase layeronly in this part (i.e. recom-bining types upon concept drifts), while the classification, training and updating mechanisms are the same as explained for thebase layer(see Section III-B).
Algorithm 2 outlines the process of theoptimisation layer.
Selection stage:selection of chromosomes (classification
types) in this stage is based on the performance of them over the search space (data inside the buffer). The types
with higher accuracy than the overall average accuracy are selected as the candidates for the crossover stage. This stage is referred by Algorithm 2 as ”Selection()” function.
Crossover stage:The classification typesselected previ-ously in Selection stage are now get paired with each other to produce new offsprings. In other words, the attributes (Genes) of good performingtypes(Chromosomes) get mixed with each other to produce newtypes. This stage is called by Algorithm 2 using “Crossover()” function.
Algorithm 1:PROPOSEDRD STRATEGIES
Input:Continuous block of data DB={db1,db2,. . . ,dbn}
n: number of features to be selected in eachtype m: total number oftypes
max: maximum number of classifiers in eachtype.
Output:Classified samples
1 i:= 1
2 fort:= 1tot:=mdo 3 Randomly selectnfeatures
4 whiledata stream is not emptydo
5 ifi≤ max2 then 6 Classify(dbi)
7 Grow(T) for alltypes
8 else
9 Classify(dbi)
10 Evaluate()
11 ifa(tj)≥
Pn j=1a(tj)
m then
12 Grow(tj) /* Based on the strategy */
13 else
14 Shrink(tj) /* Based on the strategy */
15 Train()
16 i:=i+ 1
applied during the breeding procedure. For this purpose, the mutation rate is set to the arbitrary value of 5%. Note this value is a parameter of the framework and can be changed. The “Mutation()” function in Algorithm 2 refers to this stage. The proposed GA modification is iterated over the fixed data inside the buffer until the maximum number of gener-ations are produced. Then the resulting classification types
are set to grow by training new classifiers over the incoming data blocks. The set of newly built classifiers are then get evaluated over the incoming data. Once their average per-formance is reached the average accuracy of the ensemble those classifiers are then set to get involved in the voting mechanism of the ensemble.
In the proposed method, all classifiers inside thebase layer
are given the initial weight of one (Wb = 1), while those inside theoptimisation layer– two (Wg= 2). This intensifies the effect of theoptimisation layeron the algorithm, given the optimality of thetypes.
In general, the proposed RED-GENE method works as fol-low. all the instances inside a new data block get classified by classifiers inside both layers of the ensemble (base layer and optimisation layer). The predictions of active classifiers are then summarised by the decision making part of the ensemble according to their weight and output. In this paper, a concept drift detection mechanism is employed to determine when to start/restart the GA procedure. When GA is due to start its procedure, the classifiers inside its layer (optimisation layer) are removed from the ensemble to make room for the new
collection of classificationtypesdue to be built.
Once the concept drift detector confirms a drift inside the data stream, GA starts to iterate the necessary operations over the fixed data inside the buffer. We use the Early Drift De-tection Method (EDDM) [24], which is specifically designed to improve the detection in the presence of gradual concept drifts. Note that the EDDM method is specially chosen for the experimental part of the RED-GENE framework, hence, any other drift detection methods can be employed as desired. When the concept drift detector signals warning, the buffer starts storing the incoming data to the system. Once the drift is confirmed by the detector (signalling drift), the GA step starts its procedures and all data inside the buffer get fixed for fitness calculation process. The Concept Drift Detection stage of the proposed algorithm is called by Algorithm 2 using “DriftDetector()” function.
As mentioned earlier, using concept drift detectors can sometimes lead to false positives and false negatives resulting in accuracy drop in the classification process. A false positive (when the concept drift detector wrongly signals a drift) should not negatively affect the accuracy in our proposed framework since the new set of classification types is based on the most recent data, and only an extra overhead would occur to perform additional GA optimisation. A false nega-tive that does not trigger the optimisation layer can lead to a delay in adapting to a concept drift only if the concept drift is abrupt and significant. On the other hand, the base layer always grows good performing types and shrinks badly performing types according to the most recent data, which would help the system to adapt to the concept drift even if it is not detected.
Algorithm 2:GA OPTIMISATION
Input:Buffer
g: Maximum number of generations Resetting mechanism: [implicit/explicit]
Randomly drawn subspaces (types) from the base layer,TB={t1,t2,..,tm}
Output:New set oftypes,TG={t10,t20,..,tm0}
1 fori:= 1toi:=gdo 2 Selection()
3 Crossover()
4 Mutation()
5 repeat
6 DriftDetector()
7 untilDriftDetector()=Drift /*When the detector signals a drift*/
8 Reset(GA) /*Clear genetic layer and restart GA*/
IV. EXPERIMENTAL STUDY
In the first set of experiments, different variations of the proposed framework are compared to theEACDExpmethod [4] that uses a basic RD variation with a similar optimisation mechanism. This helps better understand the impact of em-ploying the proposed RD modifications in this paper.
In the second set of experiments, The proposed method is compared to the existing state-of-the-art methods that have shown good performance and liable results in non-stationary data stream classification [13] [20] including Dy-namic Weighted Majority (DWM) [10], Online Accuracy Updated Ensemble(OAUE) [13], OSBoost [9], Leveraging Bag (LevBag) [18] and Adaptive Random Forest (ARF) [20]. We developed our framework using Java programming language Version 8. All considered methods were executed using the Massive Online Analysis (MOA) [25], which is an open source framework for data stream mining in evolving environments. When running LevBag, ARF, DWM, OAUE and OSBoost, their default parameters as implemented in MOA were used, while the parameters of our proposed algorithms are listed in Section IV-B. To ensure a thorough set of experiments with precise results, ten different variants (seeds) were generated for every synthetic data stream, and each method was tested on all variants. The variants were generated by changing different parameters in all synthetic streams, as specified in Section IV-A. For every real-world data stream, each experiment was repeated ten times over the same data stream.
We performed two different evaluation runs for each ex-periment. The first run involved passing one of the chosen datasets through a specific algorithm using the prequential evaluation technique with immediate access to the real labels of the instances labelled by the system. This evaluation run is called immediate setting. The second run also involved passing each dataset through a specific algorithm in the form of prequential evaluation; however, the real labels of the instances labelled by the system were accessed with a delay. This evaluation technique, calleddelayed setting, can lead to more realistic experiments since actual labels of streaming data are usually not immediately available in the real world. For the delayed setting, the parameter of delay was set to an arbitrary value of 1,000; hence, the label of each instance was revealed after passing 1,000 instances. For both the immediate and delayed settings, the window size (width) was set to 1,000. The experiments were performed on a machine equipped with an Intel Core i7-4702MQ CPU @ 2.20 GHz and 8.00 GB of installed memory (RAM).
A. DATASETS
1) Synthetic Data Streams
SEA Generatoris a popular data stream generator [26] that simulates different concept drifts by generating random drifts in a three-dimensional feature space where only two of the features are relevant to the target class. For the experimental study of RED-GENE framework, ten different variations of this concept drift detector is generated. For the first five vari-ants, two abrupt concept drifts with a width (of the concept
drift change) of 1 were added at instances 200K and 400K, and two recurrent concept drifts with the same width were added at instances 600K and 800K. For the remaining five variants, two gradual concept drifts with a width of 10,000 were added at instances 200K and 400K, and two recurrent concept drifts with the same width were added at instances 600K and 800K.
Hyperplane Generatoris a synthetic data stream genera-tor [27] that simulates concept drifts by moving the location of a rotating hyperplane. For the experimental part of this paper, the number of classes is set to 2 and the total number of features is set to 10. Furthermore, the number of drifting attributes was changed from 2 to 6, and the magnitude of changes was set to 0.01 or 0.02 in each variant (total of ten generated variants).
Random Tree Generator (RTG) is another widely-used data stream generator [28] that simulated concept drifts by building different decision trees and selecting random fea-tures as their split nodes and allocating random classes to them. In our experiments, to generate ten different variations of RTG, the number of classes for the decision trees set from 2 to 6 and the number of features ranged from 10 to 18.
LED Generatoris another popular data stream generator [29]. The target in this generator is to predict the digit shown on a 7-segment LED display. This generator contains 24 Boolean features, 17 of which are irrelevant and the remain-ing seven correspond to each segment of the 7-segment LED display. The ten variants used in this study simulates concept drifts by swapping four of its features. Furthermore, for the first five variations of this generator, the number of drifting attributes were selected to be 1 to 5 respectively and for the next five variations, only the random seed were changed, while the drifting attributes were the same as in the first five variations.
2) Real-World Data Streams
Forest Cover-type Data Stream is a real-world dataset in the UCI Machine Learning Repository 1. The aim in this
dataset is to predict forest cover type from the cartographi-cal variables. this dataset consists of 581,012 instances, 54 attributes and 7 classes.
Electricity is a widely-used dataset [30] from the Aus-tralian New South Wales electricity market. The aim in this dataset is to predict whether the electricity price goes up or down based on the average consumption over the last 24 hours. It contains 45,312 instances with eight features.
Airlines is another popular dataset2. The challenge in this dataset is to predict whether or not a flight will be delayed given the scheduled departure information such as the operating airline, time, destination and etc. This dataset contains 539,383 records with seven attributes.
Poker-Hand dataset from the UCI Machine Learning Repository3 is another dataset used for the experimental
1https://archive.ics.uci.edu/ml/datasets/covertype 2http://kt.ijs.si/elenaikonomovska/data.html
study of this paper. The target in this dataset is to predict the poker hand consisting of five card. This dataset containes 1,000,000 instances and 11 attributes.
KDDcup99 is a dataset used in the “Third International Knowledge Discovery and Data Mining Tools Competition”, which includes a wide variety of intrusions simulated in a military network environment and contains 41 attributes and 23 classes [31].
B. RED-GENE VARIATIONS
We compared the following nine variations of RED-GENE to evaluate the effects of the proposed RD strategies and their parameters:
RD1uses RD with weighted trees (see Section III-B1) and the following parameters:p= 60%andm= 0.6×f;
RD2 uses RD and does not consider shrinking types as explained in Section III-B2 withp= 60%,m= 0.6×f;
RD3 uses RD with weighted trees and does not consider shrinking types (Section III-B3) withp= 60%,m= 0.6×f;
RD1Liteis a lite version of RD1 withp= 40%,m= 0.4×f;
RD2Liteis a lite version of RD2 withp= 40%,m= 0.4×f;
RD3Liteis a lite version of RD3 withp= 40%,m= 0.4×f;
RD1+GAis a version of RD1 optimised using GA with the number of generations (g) set to 15 and the mutation rate set to 5% (other parameters:p= 60%,m= 0.6×f);
RD2+GAis a version of RD2 optimised using GA with the number of generations (g) set to 15 and the mutation rate set to 5% (other parameters:p= 60%,m= 0.6×f);
RD3+GAis a version of RD3 optimised using GA with the number of generations (g) set to 15 and the mutation rate set to 5% (other parameters:p= 60%,m= 0.6×f).
C. RESULTS AND DISCUSSION
The considered algorithms are compared based on standard criteria, including the classification accuracy and overall time of evaluation involving testing and training the framework. Tables 1 and 2 list the average accuracies for all variations of the proposed RED-GENE framework, along with our own EACD [4] method over the nine datasets in the im-mediate and delayed settings. The GA-optimised variations (RD1+GA, RD2+GA, RD3+GA and EACD) perform better than the RD-only variations (RD1, RD2 and RD3) and signif-icantly better than the RDLite variations (RD1Lite, RD2Lite and RD3Lite). This is because the former variations include a concept drift detection mechanism enabling the system to optimise the combination of features in every type of the ensemble, especially upon concept drifts. RD3+GA has the best average accuracy over seven out of nine datasets in the immediate setting, five out of nine datasets in the delayed setting and the best overall average accuracy in both the immediate and delayed settings. Furthermore, since the same parameters were employed for both the EACD method and RD3+GA variation, we can analyse the impact of applying the proposed RD variations in this study. Consequently, it is evident that the newly proposed RD strategies improve the
classification accuracy compared to the basic RD variation used in EACD [4].
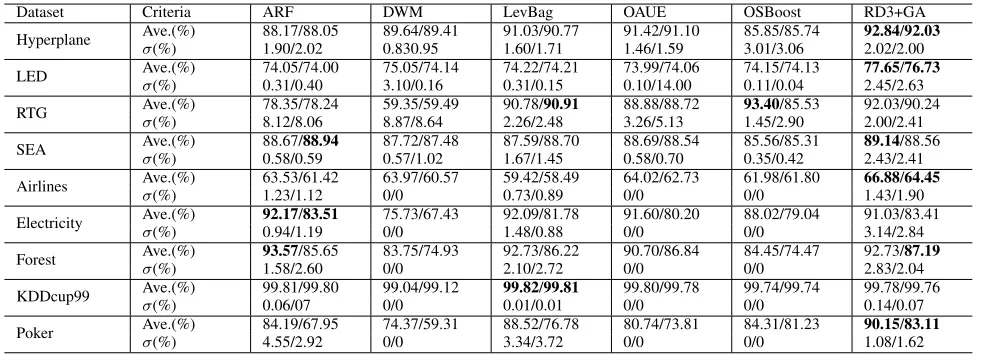
Table 3 lists the average accuracies along with standard deviation, minimum and maximum values of the RD3+GA variation compared to the considered state-of-the-art meth-ods. It can be noticed that RD3+GA has the best average accuracy over Hyperplane, LED, SEA, Airlines, Electricity and Poker-Hand datasets, as well as the best overall average accuracy in both the immediate and delayed settings. It can also be noticed that DWM, OAUE and OSBoost have the same standard deviation of zero for all real-world data sets, while RD3+GA, LevBag and ARF have different standard deviation values. This is because the latter algorithms use randomisation in their procedures, while the former do not.
Figure 2 demonstrates the overall evaluation time of RED-GENE variations and EACDExp method in seconds. It is clear that the variations without GA optimisation are faster than the ones with it due to the time complexity of GA. Furthermore, all RDLite variations are faster than the other variations as they have fewertypesand features in eachtype. Figure 3 illustrates the overall evaluation time of the pro-posed RED-GENE method compared to the other considered state-of-the-art methods. DWM and OSBoost algorithms have the shortest evaluation time by far for the majority of the datasets (DWM over SEA, Airlines, Electricity and Poker-Hand datasets, and OSBoost over Hyperplane, LED and Forest Cover-type datasets), while the proposed RED-GENE RD3+GA variation has the longest evaluation time in most cases.
In summary, the main advantage of RED-GENE is its accuracy providing the best average rank compared to the state-of-the-art methods and robust performance in evolving environments with concept drifts.In addition, the RD strategies proposed in this paper are more efficient than the basic RD strategy used in our previously proposed EACD method. The main drawback of the best performing RD3+GA variation of RED-GENE is its longest evaluation time over six out of nine datasets, which is due to the employment of two different evolutionary algorithms (RD and GA), along with a concept drift detection method (EDDM). At the same time, the RD1, RD2 and RD3 variations of RED-GENE offer slightly shorter evaluation times and significantly shorter times in theirliteversions (RD1Lite, RD2Lite and RD3Lite) while maintaining a high accuracy in many cases.
D. STATISTICAL ANALYSIS
We performed the Friedman [32] and Nemenyi [33] statistical tests to further analyse the results of our experiments regard-ing the RD3+GA variation of the proposed framework, along with the considered state-of-the-art methods.
Table 4 shows the average rank and its squared value for each algorithm in our experiments with k = 6 and N = 18. Providing that the value of Friedman test statistic
isχ2F = 31.80with 5 (k−1) degrees of freedom, and the
TABLE 1. Average accuracy (%) in the immediate setting of the RED-GENE variations andEACDExpmethod over multiple variants of different datasets.
RD3+GA achieves the highest average accuracy.
Dataset RD1 RD2 RD3 RD1Lite RD2Lite RD3Lite RD1+GA RD2+GA RD3+GA EACD
Hyperplane 87.21 87.84 89.26 79.46 78.27 81.20 91.15 90.84 92.84 90.59
LED 74.83 75.69 76.23 70.24 70.16 71.54 76.04 77.24 77.65 75.45
RTG 88.06 88.42 89.05 81.43 82.08 81.93 91.67 91.63 92.03 91.42
SEA 89.30 89.34 89.54 79.21 78.36 79.83 89.23 89.71 89.14 90.08
Airlines 64.32 63.63 64.39 62.81 61.06 61.45 66.89 66.45 66.88 66.61
Electricity 86.91 88.06 89.14 78.35 76.32 79.34 88.45 90.56 91.03 92.14
Forest 85.61 86.43 87.45 75.32 77.02 76.13 89.78 91.03 92.73 91.73
KDDcup99 99.72 99.71 99.75 99.45 99.51 99.19 99.75 99.78 99.78 99.78
Poker 87.49 88.24 87.82 79.24 80.74 81.51 89.65 90.05 90.15 86.21
Overall Ave. 84.83 85.26 85.85 78.39 78.16 79.12 86.84 87.25 87.98 87.11
TABLE 2. Average accuracy (%) in the delayed setting of the RED-GENE variations andEACDExpmethod over multiple variants of different datasets. RD3+GA
achieves the highest average accuracy over five out of nine data sets.
Dataset RD1 RD2 RD3 RD1Lite RD2Lite RD3Lite RD1+GA RD2+GA RD3+GA EACD
Hyperplane 86.94 87.23 88.86 79.53 78.14 80.04 90.52 90.92 92.03 90.02
LED 75.15 75.69 75.23 71.34 70.25 70.93 76.01 76.54 76.73 75.26
RTG 88.06 87.42 87.05 81.30 81.54 81.32 89.44 89.08 90.24 91.05
SEA 87.30 88.34 87.52 78.46 78.03 79.24 88.34 89.24 88.54 89.22
Airlines 63.85 62.03 62.39 61.67 60.78 61.06 65.49 64.34 64.45 63.35
Electricity 81.91 81.20 81.42 75.35 74.20 77.25 83.56 82.90 83.41 85.03
Forest 84.61 85.43 85.83 75.19 76.24 75.50 86.42 86.50 87.19 84.83
KDDcup99 99.73 99.72 99.73 99.46 99.49 99.50 99.74 99.73 99.76 99.76
Poker 80.49 79.53 80.56 77.16 78.42 78.92 82.65 82.10 83.11 80.21
Overall Ave. 83.12 82.95 83.18 77.71 77.45 78.19 84.69 84.58 85.05 84.30
TABLE 3. Average accuracy (%) in the immediate/delayed settings of RED-GENE compared to the state-of-the-art methods. RD3+GA achieves the highest average accuracy over nine out of 18 experiments in both the immediate and delayed settings.
Dataset Criteria ARF DWM LevBag OAUE OSBoost RD3+GA
Hyperplane Ave.(%)σ 88.17/88.05 89.64/89.41 91.03/90.77 91.42/91.10 85.85/85.74 92.84/92.03 (%) 1.90/2.02 0.830.95 1.60/1.71 1.46/1.59 3.01/3.06 2.02/2.00 LED Ave.(%) 74.05/74.00 75.05/74.14 74.22/74.21 73.99/74.06 74.15/74.13 77.65/76.73
σ(%) 0.31/0.40 3.10/0.16 0.31/0.15 0.10/14.00 0.11/0.04 2.45/2.63 RTG Ave.(%)σ 78.35/78.24 59.35/59.49 90.78/90.91 88.88/88.72 93.40/85.53 92.03/90.24
(%) 8.12/8.06 8.87/8.64 2.26/2.48 3.26/5.13 1.45/2.90 2.00/2.41 SEA Ave.(%) 88.67/88.94 87.72/87.48 87.59/88.70 88.69/88.54 85.56/85.31 89.14/88.56
σ(%) 0.58/0.59 0.57/1.02 1.67/1.45 0.58/0.70 0.35/0.42 2.43/2.41 Airlines Ave.(%)σ 63.53/61.42 63.97/60.57 59.42/58.49 64.02/62.73 61.98/61.80 66.88/64.45
(%) 1.23/1.12 0/0 0.73/0.89 0/0 0/0 1.43/1.90
Electricity Ave.(%) 92.17/83.51 75.73/67.43 92.09/81.78 91.60/80.20 88.02/79.04 91.03/83.41
σ(%) 0.94/1.19 0/0 1.48/0.88 0/0 0/0 3.14/2.84
Forest Ave.(%)σ 93.57/85.65 83.75/74.93 92.73/86.22 90.70/86.84 84.45/74.47 92.73/87.19
(%) 1.58/2.60 0/0 2.10/2.72 0/0 0/0 2.83/2.04
KDDcup99 Ave.(%) 99.81/99.80 99.04/99.12 99.82/99.81 99.80/99.78 99.74/99.74 99.78/99.76
σ(%) 0.06/07 0/0 0.01/0.01 0/0 0/0 0.14/0.07
Poker Ave.(%)σ 84.19/67.95 74.37/59.31 88.52/76.78 80.74/73.81 84.31/81.23 90.15/83.11
(%) 4.55/2.92 0/0 3.34/3.72 0/0 0/0 1.08/1.62
the accuracy values of the studied methods are significantly different (31.80is greater than14.63).
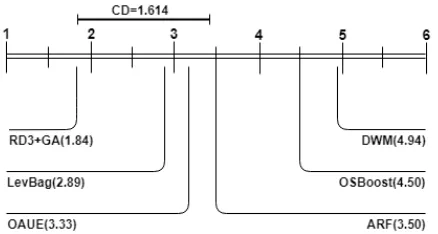
Now that the Null-hypothesis is rejected, we can proceed with a post-hoc test. The Nemenyi test [33] can be used for comparing classifiers to each other [34]. The performance of two classifiers is significantly different if the corresponding average ranks differ by at least the critical difference (CD).
The critical value in our experiments with k = 6 and
α = 0.10 is q0.10 = 1.614. As a result, the accuracy of
the proposed RD3 +GA method is significantly different from ARF, DWM, and OSBoost methods, while it is not significantly different from LevBag and OAUE methods.
Fig-ure 4 graphically represents the comparison of the different methods employed in our experiments based on the Nemenyi test.
V. CONCLUSION AND FUTURE WORK
In this paper, we proposed a framework called RED-GENE to cope with different concept drifts in data stream classification tasks. The proposed framework offer three novel strategies of Replicator Dynamics (RD) along with a Genetic Algorithm (GA) optimisation technique. RD was used to grow and shrink a randomly drawn set of subspaces (classification
FIGURE 2. Average evaluation time (in seconds) of executing RED-GENE variants and EACD method over different data streams in the immediate setting.
FIGURE 3. Average evaluation time (in seconds) of executing RED-GENE and other state-of-the-art methods over different data streams in the immediate setting.
TABLE 4. Average rank of the methods considered in the experiments according to the Friedman test.
Dataset ARF DWM LevBag OAUE OSBoost RD3+GA
Rj 3.500 4.944 2.888 3.333 4.500 1.833
R2
j 12.250 24.447 8.346 11.111 20.250 3.361
of the data stream. GA was employed to optimise the com-bination of features of the typeswhen a concept drift was detected by the Early Drift Detection Method (EDDM).
To test the proposed framework, a set of experiments was conducted with four synthetic and five real-world data streams. Nine different variations of RED-GENE were im-plemented to examine different strategies of adopting RD in online learning and assess the effect of selecting different parameters. In addition, RED-GENE was compared to the existing state-of-the-art methods and our previously proposed EACD method. The results of the comparison demonstrated that RED-GENE had the highest average accuracy and best
average rank among all compared methods in two different settings (immediate and delayed). However, the overall eval-uation time of RED-GENE was the longest over the majority of considered datasets.
Eventually, using the Friedman statistical test, it was shown that the performance of the studied methods in the experiments were significantly different. Furthermore, using the Nemenyi test, it was proved that the performance of RED-GENE was significantly better that ARF, DWM and OSBoost, while it was not significantly better than LevBag and OAUE algorithms.
FIGURE 4. Comparison of all methods using the Nemenyi test atα= 0.10.
implement and analyse the following ideas: (1) Propose a novel concept drift detection algorithm by conducting a behavioural analysis of the classification typesin the base layer of the proposed framework (using RD to grow and shrink thetypes); (2) use a dynamic weighting mechanism for both layers of the proposed framework. This can potentially improve the performance of the proposed framework; and (3) apply other bio-inspired techniques in the optimisation layer of the proposed framework.
REFERENCES
[1] J. Gama, I. Žliobait˙e, A. Bifet, M. Pechenizkiy, and A. Bouchachia, “A survey on concept drift adaptation,” ACM Computing Surveys (CSUR), vol. 46, no. 4, p. 44, 2014.
[2] H. M. Gomes, J. P. Barddal, F. Enembreck, and A. Bifet, “A survey on ensemble learning for data stream classification,” ACM Computing Surveys (CSUR), vol. 50, no. 2, p. 23, 2017.
[3] B. Krawczyk, L. L. Minku, J. Gama, J. Stefanowski, and M. Wo´zniak, “Ensemble learning for data stream analysis: a survey,” Information Fu-sion, vol. 37, pp. 132–156, 2017.
[4] H. Ghomeshi, M. M. Gaber, and Y. Kovalchuk, “Eacd: evolutionary adaptation to concept drifts in data streams,” Data Mining and Knowledge Discovery, Feb 2019.
[5] F. Chu and C. Zaniolo, “Fast and light boosting for adaptive mining of data streams,” in Pacific-Asia Conference on Knowledge Discovery and Data Mining, pp. 282–292, Springer, 2004.
[6] L. Breiman, “Bagging predictors,” Machine learning, vol. 24, no. 2, pp. 123–140, 1996.
[7] Y. Freund and R. E. Schapire, “A decisitheoretic generalization of on-line learning and an application to boosting,” Journal of computer and system sciences, vol. 55, no. 1, pp. 119–139, 1997.
[8] N. C. Oza, “Online bagging and boosting,” in Systems, man and cybernet-ics, 2005 IEEE international conference on, vol. 3, pp. 2340–2345, IEEE, 2005.
[9] S.-T. Chen, H.-T. Lin, and C.-J. Lu, “An online boosting algorithm with theoretical justifications,” arXiv preprint arXiv:1206.6422, 2012. [10] J. Z. Kolter and M. A. Maloof, “Dynamic weighted majority: An ensemble
method for drifting concepts,” Journal of Machine Learning Research, vol. 8, no. Dec, pp. 2755–2790, 2007.
[11] D. Brzezinski and J. Stefanowski, “Reacting to different types of concept drift: The accuracy updated ensemble algorithm,” IEEE Transactions on Neural Networks and Learning Systems, vol. 25, no. 1, pp. 81–94, 2014. [12] H. Wang, W. Fan, P. S. Yu, and J. Han, “Mining concept-drifting data
streams using ensemble classifiers,” in Proceedings of the ninth ACM SIGKDD international conference on Knowledge discovery and data mining, pp. 226–235, AcM, 2003.
[13] D. Brzezinski and J. Stefanowski, “Combining block-based and online methods in learning ensembles from concept drifting data streams,” In-formation Sciences, vol. 265, pp. 50–67, 2014.
[14] H. Ghomeshi, M. M. Gaber, and Y. Kovalchuk, “A non-canonical hybrid metaheuristic approach to adaptive data stream classification,” Future Generation Computer Systems, vol. 102, pp. 127–139, 2020.
[15] F. Chu and C. Zaniolo, “Fast and light boosting for adaptive mining of data streams,” in Pacific-Asia Conference on Knowledge Discovery and Data Mining, pp. 282–292, Springer, 2004.
[16] A. Bifet, G. Holmes, B. Pfahringer, R. Kirkby, and R. Gavaldà, “New ensemble methods for evolving data streams,” in Proceedings of the 15th ACM SIGKDD international conference on Knowledge discovery and data mining, pp. 139–148, ACM, 2009.
[17] A. Bifet and R. Gavalda, “Learning from time-changing data with adaptive windowing,” in Proceedings of the 2007 SIAM International Conference on Data Mining, pp. 443–448, SIAM, 2007.
[18] A. Bifet, G. Holmes, and B. Pfahringer, “Leveraging bagging for evolving data streams,” Machine Learning and Knowledge Discovery in Databases, pp. 135–150, 2010.
[19] P. M. Gonçalves Jr and R. S. M. De Barros, “Rcd: A recurring concept drift framework,” Pattern Recognition Letters, vol. 34, no. 9, pp. 1018– 1025, 2013.
[20] H. M. Gomes, A. Bifet, J. Read, J. P. Barddal, F. Enembreck, B. Pfharinger, G. Holmes, and T. Abdessalem, “Adaptive random forests for evolving data stream classification,” Machine Learning, pp. 1–27, 2017.
[21] I. M. Bomze, “Lotka-volterra equation and replicator dynamics: a two-dimensional classification,” Biological cybernetics, vol. 48, no. 3, pp. 201– 211, 1983.
[22] J. Hofbauer and K. Sigmund, “Evolutionary game dynamics,” Bulletin of the American Mathematical Society, vol. 40, no. 4, pp. 479–519, 2003. [23] A. Mantri, S. N. S. Kendra, G. Kumar, and S. Kumar, High
Per-formance Architecture and Grid Computing: International Conference, HPAGC 2011, Chandigarh, India, July 19-20, 2011. Proceedings, vol. 169. Springer, 2011.
[24] M. Baena-García, J. del Campo-Ávila, R. Fidalgo, A. Bifet, R. Gavaldà, and R. Morales-Bueno, “Early drift detection method,” 2006.
[25] A. Bifet, G. Holmes, R. Kirkby, and B. Pfahringer, “Moa: Massive on-line analysis,” Journal of Machine Learning Research, vol. 11, no. May, pp. 1601–1604, 2010.
[26] W. N. Street and Y. Kim, “A streaming ensemble algorithm (sea) for large-scale classification,” in Proceedings of the seventh ACM SIGKDD interna-tional conference on Knowledge discovery and data mining, pp. 377–382, ACM, 2001.
[27] G. Hulten, L. Spencer, and P. Domingos, “Mining time-changing data streams,” in Proceedings of the seventh ACM SIGKDD international conference on Knowledge discovery and data mining, pp. 97–106, ACM, 2001.
[28] P. Domingos and G. Hulten, “Mining high-speed data streams,” in Pro-ceedings of the sixth ACM SIGKDD international conference on Knowl-edge discovery and data mining, pp. 71–80, ACM, 2000.
[29] L. Breiman, J. Friedman, C. J. Stone, and R. A. Olshen, Classification and regression trees. CRC press, 1984.
[30] M. Harries and N. S. Wales, “Splice-2 comparative evaluation: Electricity pricing,” 1999.
[31] K. Cup, “Data (1999),” URL: http://kdd. ics. uci. edu/databases/kddcup99/kddcup99. html, 1999.
[32] M. Friedman, “A comparison of alternative tests of significance for the problem of m rankings,” The Annals of Mathematical Statistics, vol. 11, no. 1, pp. 86–92, 1940.
[33] P. Nemenyi, “Distribution-free multiple comparisons,” in Biometrics, vol. 18, p. 263, INTERNATIONAL BIOMETRIC SOC 1441 I ST, NW, SUITE 700, WASHINGTON, DC 20005-2210, 1962.
HOSSEIN GHOMESHIis a Ph.D. student and a Visiting Lecturer in the School of Computing and Digital Technology, Birmingham City University, UK. His research interests are in the area of data analytics, big data and machine learning. Hossein holds a M.Sc. degree in computer engineering from the University of Tehran, Iran, where his thesis looked into developing a framework for tag-based social image search tag-based on textual and visual features. He also holds a B.Sc. computer engineering degree from Shahid Chamran University of Ahvaz, Iran. Prior to his Ph.D. study, Hossein has worked as a senior technical engineer in the telecommunication industry.
MOHAMED GABERis a Professor in Data An-alytics in the School of Computing and Digi-tal Technology, Birmingham City University, UK. Mohamed received his Ph.D. from Monash Uni-versity, Australia. He has published over 200 pa-pers, co-authored 3 monograph-style books, and edited/co-edited 6 books on data mining and knowledge discovery.
His work has attracted well over four thousand citations, with an h-index of 35. Mohamed has served in the program committees of major conferences related to data min-ing, including ICDM, PAKDD, ECML/PKDD and ICML. He has also co-chaired numerous scientific events on various data mining topics. Professor Gaber is recognised as a Fellow of the British Higher Education Academy (HEA). He is also a member of the International Panel of Expert Advisers for the Australasian Data Mining Conferences. In 2007, he was awarded the CSIRO teamwork award.
YEVGENIYA KOVALCHUKis a Senior Lecturer in Computer Science in the School of Computing and Digital Technology, Birmingham City Univer-sity, UK. She received an M.Sc. in Economic Cy-bernetics from the National Technical University of Ukraine and Ph.D. in Computer Science from the University of Essex, UK.