182
International Journal of Pharmaceutical Sciences and Drug Research
2016; 8(3): 182-188
Research Article
CODEN (USA): IJPSPP
ISSN: 0975-248X
Compatibility Studies of Atorvastatin Calcium with Selected Excipients By
Means of Thermal and FT-IR Spectroscopic Methods for the Development of
Immediate Release Tablet
Bipul Nath
*, Tushar Kanti Roy
Girijananda Chowdhury Institute of Pharmaceutical Science, Azara, Guwahati-781017, Kamrup, Assam, India (Affiliated to Assam Science and Technology University, Jalukbari, Guwahati, Assam, India)
ABSTRACT
The objectives of present investigation is to evaluate the compatibility of Atorvastatin calcium with immediate release excipients and to optimize the tablet which release is best comparable with innovator product by varying different super disintegrants. Various excipients used were sodium starch glycollate, cross carmellose sodium, cross-povidone, lactose, micro crystalline cellulose, mannitol, sodium lauryl sulfate, magnesium stearate, and stearic acid. Thermal characterization of the drug was done by DSC and FT-IR. From the DSC studies, the excipients such as microcrystalline cellulose (Avicel 101), magnesium stearate, mannitol, sodium lauryl sulfate were found to have physical interactions with Atorvastatin. Immediate release tablet was prepared by direct compression method and its release profile was compared with the marketed IR tablet. The prepared tablet have conform the pharmacopoeial limit for hardness, thickness, friability, weight variation and content uniformity. Formulation F11 containing two super disintegrants have shown the disintegration time less than 25 sec and better dissolution than all other formulations releasing more than 80% of the drug after 20 minutes. Kinetic data reveals that the drug release follows best order by Higuchi model, followed by korsemeyer peppas, zero order and first order mechanisms. The results of accelerated stability studies as per ICH guidelines indicated that the tablet was stable as there were no any significant physical changes after the study.
Keywords: Compatibility, DSC, Immediate, Atorvastatin, mannitol, Higuchi.
INTRODUCTION
Excipients present in solid dosage forms are composed of mixture of adjuvant, such as diluents, binders, disintegrants, lubricants, glidants, and surfactants. They permit the efficient manufacturing of capsules and tablets and affect the physical and chemical
*Corresponding author: Dr. Bipul Nath,
Department of Pharmaceutics, Girijananda Chowdhury Institute of Pharmaceutical Science, Azara, Guwahati-781017, Kamrup, Assam, India; Tel.: +91-9854063470;
E-mail: [email protected]
Received: 11 May, 2016; Accepted: 24 May, 2016
characteristics of the active ingredients as well as its bioavailability. The incompatibility between drugs and excipients can alter the physicochemical properties of drugs and hence, can have an effect on its efficacy and safety profile. Therefore, drug-excipients interaction study at the initial stage of a formulation development should be treated as an imperative exercise to ensure correct selection of excipients and hereby, increasing the possibility of developing a successful dosage form.
[1-2] In particular, the cost and time constraints
Int. J. Pharm. Sci. Drug Res. May-June, 2016, Vol 8, Issue 3 (182-188)
calorimetry (DSC) has been widely used to assess incompatibility between formulation components, because the method is fast and versatile, and requires only a small quantity of sample. [1-6] However, caution
needs to be exercised if the results of DSC alone are interpreted. Whenever possible, other techniques such as infrared spectroscopy (IR) and quantitative analysis after storage under stressed conditions should be utilized in conjunction with DSC. [6] As the
thermo-analytical methods do not yield direct chemical information, Fourier transform infrared spectroscopic (FT-IR) investigations were used in this work. Oral drug delivery remains the preferred route of administration in the discovery and development of new drug candidates. The popularity of oral route is attributed to patient acceptance, ease of administration, accurate dosing, cost effective manufacturing methods and generally improve the shelf life of the product. Immediate release tablets are those which disintegrate rapidly and get dissolved to release the medicaments. Immediate release may be designed by appropriate pharmaceutically acceptable diluents or carrier, which gives rapid rate of drug release and absorption. [3-4] The
basic approach used in development of such tablets is the use of superdisintegrants like cross linked poly vinyl pyrrolidone or cross povidone (polyplasdone), sodium starch glycollate (SSG), cross carmellose sodium (CCS) etc. As a drug entity reaches the end of its patent life, it is common for pharmaceutical manufacturers to develop a given drug entity in a new and improved dosage form. A new dosage form allows a manufacturer to extend market exclusivity, while offering its patient population a more convenient dosage form or dosing regimen.
Atorvastatin (ATV), a HMG CoA reductase inhibitor, lipid lowering agent given in the dose ranging from 10-80 mg/day by oral route. After oral administration alone, ATV is rapidly absorbed; maximum plasma concentrations occur within 1 to 2 hours. Extent of absorption increases in proportion to atorvastatin dose. The absolute bioavailability of atorvastatin (parent drug) is approximately 14% and the systemic availability of HMG-CoA reductase inhibitory activity is approximately 30%. The low systemic availability is attributed to pre-systemic clearance in gastrointestinal mucosa and/or hepatic first-pass metabolism. Atorvastatin, a drug with low solubility and high permeability belongs to the Class II in the biopharmaceutics classification system (BCS), in which, dissolution process is the rate-limiting step for the absorption. [6- 7] Hence, it is important to evaluate drug
features, such as the presence of polymorphism, stability, and compatibility of the pharmaceutical formulation, since any changes can directly influence its bioavailability. Hence, the objectives of present investigation is to evaluate the compatibility of Atorvastatin with immediate release excipients and to optimize the tablet which release is best comparable
with innovator product by varying different super disintegrants.
MATERIALS AND METHODS
Atorvastatin calcium was a given sample from Unichem Ltd, Ahmedabad. SSG, CCS, CP, lactose, mannitol, SLS, MCC, Magnesium stearate, Stearic acid were procured from Loba chemie pvt. Ltd. Mumbai respectively. All other chemicals used were of analytical grade.
Preparation of products and storage conditions
Binary component mixtures in 1:1 mass ratio were prepared in a porcelain mortar. The original components were investigated by means of DSC and FT-IR methods. The mixtures were investigated immediately after the preparation and after accelerated storage period (40°C/75% RH/ 3 months). The composition of various binary mixtures for drug-excipients compatibility studies were as follows: ATV Calcium; ATV Calcium: SSG 1:1; ATV: CCS 1:1; ATV: CP 1:1; ATV Calcium: Lactose 1:1; ATV Calcium: MCC 1:1; ATV: Sodium lauryl sulfate 1:3; ATV Calcium: Mannitol 1:1; ATV Calcium: Magnesium stearate 1:0.5; ATV Calcium: Stearic acid 1:1.
Differential scanning calorimetry study
A Mettler Toledo DSC thermal analysis system (Mettler Inc., Schwerzenbach, Switzerland) was used for thermal analysis of the drug-excipient mixtures. Approximately 2-5 mg of ATV and excipient or their binary mixture was examined in the temperature range between 40°C and 300°C, in a normal covered Aluminium crucible (three pin holes were applied in the cover). The heating rate was 10°C min-1. Nitrogen
was used as carrier gas at a flow rate of 10 Lh-1 during
the DSC investigation [6-15]
Fourier transform infrared spectroscopy study
FT-IR spectra of the ATV and its binary mixtures were recorded in the interval 4000–400 cm-1 with a
Schimadzu FT-IR instrument (Japan), at 4 cm-1 optical
resolution. Standard KBr pellets were prepared from IR grade KBr and 0.5 mg of ATV, or 1.0 mg of binary mixture. The spectra were recorded with the use of software, and all spectral interpretations were done. [7, 15]
Preparation of Immediate release tablet of ATV by direct compression
The weighed quantity of ATV was screened through sieve no. #40. The various excipients were accurately weighed and screened separately using sieve no. 40. The immediate release tablets were prepared by direct compression method using the formula shown in Table 1. Different ratios of superdisintegrants, fixed amount of diluents, glidants were passed through sieve no. 60 and mixed in mortar with a pestle to obtain uniform mixing. The blended powder was compressed into tablets weighing appprox. 150 mg on a single punch tablet machine (Cadmach, Ahmadabad) using a flat-faced non-beveled punch and die set of 8 mm diameter.
Int. J. Pharm. Sci. Drug Res. May-June, 2016, Vol 8, Issue 3 (182-188)
Pre compression parameters Bulk density
It is a ratio of mass of powder to bulk volume. It is expressed in g/ml and is given by the formula [8, 10]:
Bulk density=M/Vo
Where, M = mass of the powder, Vo = bulk volume of the powder
Tapped density
It is a ratio of mass of powder to tapped volume. Ten gram of powder was introduced into a clean, dry 100 ml measuring cylinder. The cylinder was then tapped 100 times from a constant height and the tapped volume was read. It is expressed in g/ml and is given by [8, 10]:
Tapped density=M/Vt Where, M = mass of the powder
Vt = final tapping volume of the powder
Angle of repose (θ)
It is defined as the maximum angle possible between the surface of the pile of the powder and the horizontal plane. The angle of repose was then calculated using following equation [5, 10]:
Angle of repose ɵ = tan-1(h/r)
Where, h=height of the pile r=radius of the pile
Compressibilty index (Carr’s index)
Compressibility index is used as an important parameter to determine the flow behaviour of the powder. It is indirectly related to the relative flow property rate, cohesiveness and particle size. It is simple, fast and popular method for predicting flow characteristics. Carr’s index is determined by employing following formula [5]:
Carr’s Index= [(TD-BD)x100]/ TD
Hausner’s Ratio
The Hausner’s ratio is a number that is correlated to the flow ability of a powder or granular material. [5, 15]
Hausner’s ratio = TD/BD
Physical evaluation of the matrix tablets
The thickness, hardness, weight uniformity and friability were determined in a similar manner as stated for conventional oral tablets in the accredited pharmacopoeia. [8, 13]
Determination of Drug Content
20 tablets from each formulation were finely powdered and a portion equal to 10 mg ATV was transferred to a 100 ml volumetric flask, dissolved in phosphate buffer (pH 6.8). Then the volume was made up with buffer and shaken for 10 minutes to ensure complete solubility of drug. The mixture was centrifuged and 10 mL of the supernatant liquid was diluted 20 times with buffer and the absorbance was determined spectrophotometrically using a UV spectrometer (UV-Visible, Perkin-Elmer, USA) at 243 nm. [15]
Disintegration test
Disintegration is evaluated to ensure that the drug substance is fully available for dissolution and absorption from the gastrointestinal tract. Disintegration test was carried out using tablet
disintegration test apparatus (Electrolab, India) using distilled water without disk at room temperature (37±2°C). The time in second taken for complete disintegration of the tablet with no palable mass remaining in the apparatus was measured in seconds.
[10, 15]
In-vitro drug release studies
In vitro dissolution studies for all the tablets were carried out using USP type II Dissolution apparatus (Electrolab, Mumbai, India). The dissolution medium used was 900 ml, mixture of phosphate buffer solution pH 6.8 and water (1:1) used as dissolution medium. The tablets containing 20 mg of ATV were weighed and then introduced into the dissolution medium. 1 ml aliquots were withdrawn at every 1 hour and replaced by 1 ml of fresh dissolution media (37°C). The medium was stirred at 50 rpm using paddle at 37±0.5°C. The samples were collected, filtered through Whatman filter paper (0.45µm) and analyzed after suitable dilution (if required) at 243 nm using UV‐visible spectrophotometer against phosphate buffer (pH 6.8) as blank. [13-14]
Kinetic evaluation of release data
The dissolution data from various batches of tablets were subjected to release kinetic study by fitting in to various postulated kinetic models. Drug dissolution from solid dosage form has been described by kinetic models in which the dissolved amount of drug (Q) is compared to the drug content (%) function of the test time (t). The analytical and kinetic models of the Q versus t commonly used are Zero order, First order, Higuchi and Korsmeyer-Peppas model to study the possible release mechanism. [14, 16]
Stability studies
The stability studies were conducted by storing the optimized tablets at 40 ± 2ºC/75 ± 5% RH in stability chamber for 45 days. The samples were withdrawn after 45 days and analyzed for various physical tests and drug release study. [5, 15]
RESULTS AND DISCUSSION Thermal characterization of ATV
DSC curve of ATV shows an endothermic event whose melting Tonset was 153.05°C and Tpeak was 132.97°C
(ΔH 93.674 J g-1). Then another endothermic event is observed which can be attributed to a phase transition characteristic of this polymorph with the following decomposition there of around 190-250°C. The melting peak of ATV according to Zhang (2009) happened to 158.8°C and enthalpy of 86.85 J g-1. [9] The melting peak
of atorvastatin when disappeared, or decreased in intensity in drug-excipients binary mixtures, it was confirmed to be physical interaction. DSC curve of Atorvastatin + lactose shows only the characteristic endothermic peaks of lactose. According to the literature [9], lactose melting at 144°C prior to the
Int. J. Pharm. Sci. Drug Res. May-June, 2016, Vol 8, Issue 3 (182-188)
interaction with lactose. DSC curve of ATV + mannitol cause the disappearance of the melting peak characteristic of ATV or appearance of only peak of the excipients. Thus, it suggests interactions which may be physical or chemical. This was further reconfirmed by FT-IR studies. From the DSC studies, the excipients such as microcrystalline cellulose, magnesium stearate, mannitol, sodium lauryl sulfate were found to have physical interactions with ATV as shown in the Fig. 1.
Fig. 1: DSC studies of ATV with various immediate release excipients
FT-IR study
The principal infra-red absorption peaks of pure ATV calcium shows characteristics peaks belonging at 1577.77, 1649, 1550, 1217.38, 1317.0, 3363 cm-1
corresponding to aromatic secondary N-H vibrations, C=O, C=C, C-O, C-N and O-H stretching of aromatic ring respectively (Fig. 2). The identical peaks of N-H vibrations, C==O, C=C, C-O, C-N and O-H stretching were also appeared in the spectra of physical mixture of drug with SLS, mannitol, magnesium stearate , and all other excipients found compatible in DSC studies.
FT-IR-spectra of drug and its physical mixture with above excipients are exactly same, and there is no shift of peaks or disappearance of principle peaks or modification of the principle peaks indicating that there is no interaction between the drug and excipients.
Fig. 2: FT-IR spectrum of pure ATV and drug-excipients physical mixtures
Evaluation of pre-compression properties
Int. J. Pharm. Sci. Drug Res. May-June, 2016, Vol 8, Issue 3 (182-188)
which indicated good flow of the powder. The Carr’s index was found to be in the range of 22 to 30 indicating moderate to fairer compressibility of the tablet blend. The Hausner ratio lays in the range 0.758 to 0.814 confirming good flow characteristics for direct compression tablets.
Evaluation of post-compression properties
All the batches of tablets (F1-F12) were evaluated for various post compression properties such as hardness, thickness, friability, weight variation, content uniformity as shown in Table 3. The tablets were compressed at the average weight of 150 mg. The weight variation of all batches in the ranges of 147±0.34 to 154±0.34 mg. The pharmacopoeial limit for percent deviation in weight variation for 100 mg tablet is ±7.5%. The average percent deviation for all tablets was found to be within the limit and hence it passes the weight variation test. The tablets thickness was 3.5±0.03 to 3.8±0.03 mm. The tablets hardness was 3.5±0.15 to 4.1±0.13 kg/cm2.
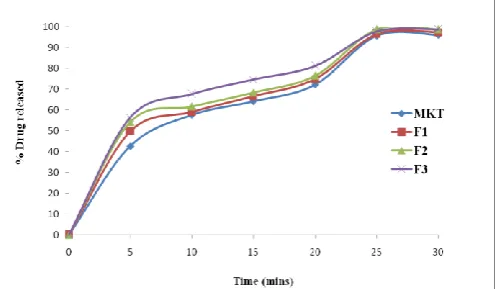
In-vitro drug release behavior of prepared tablets
The in-vitro dissolution profiles of all formulations are depicted in Figure 3 (a), (b), (c) and (d). Release a data revealed that formulation F1, F2 and F3 released 72.3%, 74.37% and 76.50% drug respectively within 20 minutes. Formulation F4, F5 and F6 released 71.2%, 73.37% and 74.7% drug respectively within 20 minutes. Formulation F7, F8 and F9 released 67.17%, 69.30% and 71.21% drug respectively within 20 minutes. Results also reveals that the batches F10, F11 and F12 released 72.4%, 82.7%, 77.8% and 72.4% of drug within 20 minutes demonstrating the immediate release pattern. Among all the formulations F3 containing cross carmellose sodium, F6 containing sodium starch glycollate and F12 containing 1:1 ratio of CCS:SSG, F11 containing 1:1 ratio of CCS: cross povidone have shown increased drug release in 20 minutes as compared to CP. Formulation F11 have shown the disintegration time less than 25 sec and better dissolution than all other formulations. Hence, formulation F11 is considered to be the best formulation among the other formulations containing mixture of two super disintegrants.
Fig. 3 (a): In vitro drug release rate curve for different immediate release tablets containing different proportion of super disintegrants. Marketed (-♦-), F1 (-■-), F2 (-▲-), F3 (-¥-) showing release of drug from prepared formulations.
Fig. 3 (b): In vitro drug release rate curve for different immediate release tablets containing different proportion of super disintegrants. Marketed (-♦-), F4 (-■-), F5 (-▲-), F6 (-¥-) showing release of drug from prepared formulations.
Fig. 3 (c): In vitro drug release rate curve for different immediate release tablets containing different proportion of super disintegrants. Marketed (-♦-), F7 (-■-), F8 (-▲-), F9 (-¥-) showing release of drug from prepared formulations.
Fig. 3 (d): In vitro drug release rate curve for different immediate release tablets containing different proportion of super disintegrants. Marketed (-□-), F10 (-■-), F11 (-●-), F12 (-▲-) showing release of drug from prepared formulations.
Drug Release mechanism
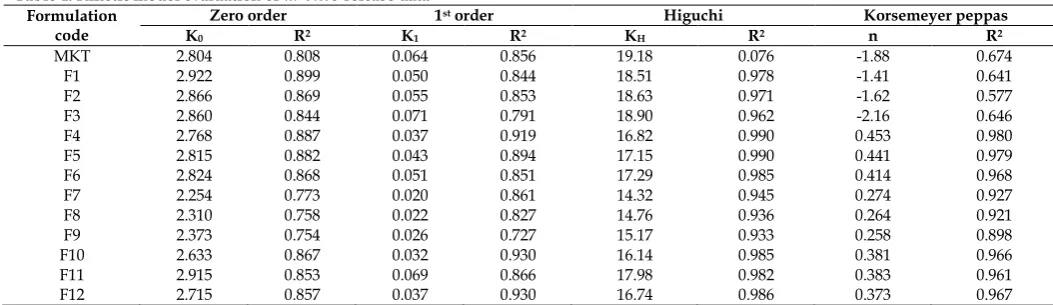
The results of in-vitro release data after kinetic evaluation are presented in Table 4. Kinetic evaluation of the release data reveals that the r2 value of optimized
batch F11for zero order and first order were obtained as 0.853 and 0.866 respectively. Based on the results it was confirmed that the optimized formulation followed first order release. However, the highest co-relation of F11 was found in Higuchi’s model as evidenced by linearity closer R2 value (0.982) indicating that drug release from
Int. J. Pharm. Sci. Drug Res. May-June, 2016, Vol 8, Issue 3 (182-188)
process. The in-vitro release data was further fitted to Krosmeyer-Peppas model which is generally used to analyze the release mechanism when more than one type of release phenomenon is operational. Good linearity was observed with high ‘r’ values. The value of release exponent ‘n’ is an indicative of release mechanism. The value of ‘n’ obtained for the optimized
formulation F11 was found to be 0.4 suggesting probable release by case-I transport. The results of accelerated stability studies as per ICH guidelines indicated that the tablets did not show any significant physical changes (color change, friability and hardness), assay and dissolution characteristics during the study period.
Table 1: Composition of various batches of atorvastatin immediate release tablets
Ingredients (mg) F1 F2 F3 F4 F5 F6 F7 F8 F9 F10 F11 F12
Atorvastatin Calcium 20.70 20.70 20.70 20.70 20.70 20.70 20.70 20.70 20.70 20.70 20.70 20.70
Sodium Starch Glycollate ---- ---- ---- 4 6 8 ---- ---- ---- ---- 8 8
Cross Carmellose Sodium 4 6 8 ---- ---- ---- ---- ---- ---- 8 8 ----
Cross Povidone ---- ---- ---- ---- ---- ---- 4 6 8 8 ---- 8
Sodium Lauryl Sulphate 1.5 1.5 1.5 1.5 1.5 1.5 1.5 1.5 1.5 1.5 1.5 1.5
Anhydrous Lactose 110.8 108.8 106.8 110.8 108.8 106.8 110.8 108.8 106.8 98.8 98.8 98.8
Saccharin sodium 10 10 10 10 10 10 10 10 10 10 10 10
Stearic Acid 3 3 3 3 3 3 3 3 3 3 3 3
Table 2: Physical properties of directly compressible powder blend Formulation
Code Angle of Repose (degree)◦ Tapped Density (g/cm3)
Bulk Density
(gm/cm3) Hausner’s ratio
Compressibility Index (%)
F1 21.88 ± 1.10 0.435 ± 1.21 0.543 ± 0.06 0.801 ± 0.21 24.82 ± 0.02
F2 23.76 ± 0.05 0.414 ± 1.12 0.546 ± 0.04 0.758 ± 0.18 31.88 ± 0.05
F3 24.32 ± 0.21 0.455 ± 1.24 0.567 ± 1.09 0.802 ± 0.10 24.61 ± 0.02
F4 22.66 ± 0.24 0.476 ± 1.11 0.597 ± 0.07 0.797 ± 0.08 25.42 ± 0.06
F5 23.98 ± 0.31 0.422 ± 1.30 0.518 ± 0.03 0.814 ± 0.09 22.74 ± 0.01
F6 24.12 ± 0.08 0.458 ± 1.18 0.562 ± 0.08 0.814 ± 1.10 22.70 ± 0.04
F7 23.50 ± 0.18 0.436 ± 1.10 0.564 ± 1.10 0.773 ± 1.05 29.35 ± 0.06
F8 23.61 ± 0.14 0.421 ± 1.07 0.548 ± 1.13 0.768 ± 1.07 30.16 ± 0.02
F9 25.34 ± 0.11 0.431 ± 1.03 0.553 ± 1.14 0.779 ± 1.10 28.30 ± 0.08
F10 24.78 ± 0.07 0.464 ± 1.12 0.578 ± 0.09 0.802 ± 1.02 24.56 ± 0.03
F11 24.08 ± 0.15 0.430 ± 1.04 0.558 ± 0.06 0.770 ± 0.91 28.57 ± 0.05
F12 25.30 ± 0.13 0.453 ± 1.21 0.578 ± 1.10 0.783 ± 0.88 27.59 ± 0.06
Table 3: Physical properties of various batches of immediate release tablets
Batch Code Thickness (mm) Hardness (kg/cm2) Friability (%) Weight Variation (mg) Drug Content (%) DT (sec)
F1 3.5 ± 0.03 3.5 ± 0.15 0.68 ± 0.23 148 ± 0.45 98.67 ± 0.05 45 ± 0.04
F2 3.8 ± 0.06 3.4 ± 0.16 0.57 ± 0.28 147 ± 0.34 96.54 ± 0.03 40 ± 0.06
F3 3.6 ± 0.04 3.5 ± 0.13 0.54 ± 0.31 151 ± 0.08 98.45 ± 0.02 35 ± 0.03
F4 3.5 ± 0.02 3.6 ± 0.16 0.72 ± 0.38 150 ± 0.25 96.08 ± 0.04 34 ± 0.01
F5 3.8 ± 0.05 3.8 ± 0.12 0.64 ± 0.21 148 ± 0.56 97.32 ± 0.03 30 ± 0.06
F6 3.5 ± 0.05 4.0 ± 0.10 0.52 ± 0.25 149 ± 0.65 96.54 ± 0.04 28 ± 0.03
F7 3.8 ± 0.02 4.1 ± 0.13 0.54 ± 0.28 152 ± 0.60 97.81 ± 0.06 46 ± 0.02
F8 3.7 ± 0.04 4.2 ± 0.08 0.65 ± 0.18 154 ± 0.34 98.74 ± 0.03 41 ± 0.06
F9 3.8 ± 0.05 4.0 ± 0.12 0.63 ± 0.11 151 ± 0.71 95.56 ± 0.07 38 ± 0.02
F10 3.8 ± 0.03 3.6 ± 0.13 0.69 ± 0.24 153 ± 0.46 96.71 ± 0.03 28 ± 0.10
F11 3.6 ± 0.05 3.5 ± 0.08 0.75 ± 0.21 148 ± 0.05 98.10 ± 0.02 24 ± 0.19
F12 3.8 ± 0.03 3.8 ± 0.10 0.72 ± 0.16 150 ± 0.90 96.72 ± 0.05 34 ± 0.12
Table 4: Kinetic model evaluation of in-vitro release data Formulation
code
Zero order 1st order Higuchi Korsemeyer peppas
K0 R2 K1 R2 KH R2 n R2
MKT 2.804 0.808 0.064 0.856 19.18 0.076 -1.88 0.674
F1 2.922 0.899 0.050 0.844 18.51 0.978 -1.41 0.641
F2 2.866 0.869 0.055 0.853 18.63 0.971 -1.62 0.577
F3 2.860 0.844 0.071 0.791 18.90 0.962 -2.16 0.646
F4 2.768 0.887 0.037 0.919 16.82 0.990 0.453 0.980
F5 2.815 0.882 0.043 0.894 17.15 0.990 0.441 0.979
F6 2.824 0.868 0.051 0.851 17.29 0.985 0.414 0.968
F7 2.254 0.773 0.020 0.861 14.32 0.945 0.274 0.927
F8 2.310 0.758 0.022 0.827 14.76 0.936 0.264 0.921
F9 2.373 0.754 0.026 0.727 15.17 0.933 0.258 0.898
F10 2.633 0.867 0.032 0.930 16.14 0.985 0.381 0.966
F11 2.915 0.853 0.069 0.866 17.98 0.982 0.383 0.961
F12 2.715 0.857 0.037 0.930 16.74 0.986 0.373 0.967
From the study it is concluded that, ATV Calcium found compatible with selected excipients and incompatible with mannitol, Magnesium stearate,
Int. J. Pharm. Sci. Drug Res. May-June, 2016, Vol 8, Issue 3 (182-188)
formulations were found to be satisfactory when evaluated for thickness, weight uniformity, hardness, friability, drug content uniformity, disintegration time and in-vitro drug release. Formulation F11 containing two super disintegrants have shown the disintegration time less than 25 sec and better dissolution than all other formulations releasing more than 80% of the drug after 20 minutes. Evaluation of the release kinetic data reveals that tablets containing 1:1 ration of two super disintegrants (CCS:SSG) exhibit Higuchi spherical matrix release indicating that drug release from the tablet was diffusion controlled followed by case I transport. Stability study revealed that, the selected formulation F11 was stable over the period of three months of stability study.
ACKNOWLEDGMENTS
The authors greatly acknowledge GIPS, Shrimanta Shankar Academy Society, SSA, Guwahati to carry out DSC and FT-IR studies free of cost. The authors are also thankful to Loba Chemie Pvt. Ltd. Mumbai, India for providing Atorvastatin calcium research sample.
REFERENCES
1. Bruni G, Berbenni V, Milanese C, Girella A, Marini A. Drug-excipient compatibility studies in binary and ternary mixtures by physico-chemical techniques. J. Therm. Anal. Cal. 2010; 102: 193-201.
2. Freire FD, Aragão CF, Lima TFA, Raffim FN. Compatibility study between chlorpropamide and excipients in their physical mixtures. J. Therm. Anal. Calorim. 2009; 97: 355-357. 3. Jivraj M, Martini LG, Thomson CM. An overview of the different excipients useful for the direct compression of tablets. Pharm. Sci. Technol. Today. 2000; 2: 58-63.
4. Rowe RC, Sheskey PJ, Quinn ME. Hand Book of
Pharmaceutical Excipients, 6th edition, Pharmaceutical Press, London, 2009, pp. 80.
5. Sinko PJ. Martin’s Physical Pharmacy and Pharmaceutical Sciences, 5th edition, Wolters Kluwar Healthcare Pvt. Ltd, New Delhi, 2007, pp. 553-558.
6. Carvalho KP, Rocha TC, Leles MIG. Characterization of atorvastatin by TG and DSC. Braz. J. Ther. Ana. 2012; 1: 79-83.
7. Oliveira MA, Yoshida MI, Belinelo VJ, Valotto RS. Degradation Kinetics of Atorvastatin under Stress Conditions and Chemical Analysis by HPLC. Molecules. 2013; 18: 1447-1456.
8. Patel JA. Formulation and evaluation of immediate release tablet of azithromycin by dry granulation method using super disintegrants. Ame. J. PharmTech Res. 2011; 1: 211-218. 9. Zhang HX, Wang JX, Zhang ZB, Le Y, Shen ZG, Chen JF.
Micronization of atorvastatin calcium by antisolvent precipitation process. Int. J. Pharm. 2009; 374: 106-113. 10. Nyol S, Gupta MM. Immediate drug release dosage form: a
review. J. Drug Deliv. Ther. 2013; 3: 155-161.
11. Palanisamy P, Jayakar B, Chandira R. Margret,
Venkateshwarlu BS, Pasupathi A. Formulation, Evaluation and Development of Immediate Release Film Coated Tablets of Atorvastatin and Sustained Release Film Coated Tablets of Ezetimibe in Capsules Form USP. Int. J. Med. Pharm. 2013; 1: 1-10.
12. Dokala GK, Pallavi Ch. Direct Compression - An Overview. Int. J. Res. Pharm and Biomed. Sci. 2013; 4: 155-158.
13. Sharma B, Saini V, Arvind S. Preparation, Characterization and In-vitro Evaluation of Atorvastatin Calcium Solid Dispersions with Various Hydrophilic Polymers and Its FDT Formulation. Curr. Phar. Res. 2012; 2: 620-630.
14. Karimban JA. Formulation and Evaluation of Immediate Release Venlafaxine HCl Tablets: Comparative Study of Super Disintegrant and Diluents. Int. Res. J. Pharm. 2012; 3: 324-329.
15. Kotta KK, Suma P, Srikrishna T. Formulation and Evaluation of Atorvastatin Calcium Immediate Release Tablets. Ind. J. Nov. Drug. Deliv. 2013; 5: 130-141.
16. Kumar S, Garg SK, Aseri A. Design, optimization and in-vitro evaluation of Atorvastatin fast dissolving tablets by using solid dispersion technique. World J. Pharm. Pharm. Sci. 2014; 3: 1217-1239.