Formulation and Evaluation of Nitazoxanide
Sustained-Release Matrix Tablets
Mohan Arti*, Alur Ashwini
Department of Pharmaceutics, Krupanidhi College of Pharmacy, Bengaluru-560035, Karnataka, India. ABSTRACT
The main aim of the present study was to design and assess the twice-daily sustained-release matrix tablets of Nitazoxanide using different concentrations of hydrophilic polymers. Wet granulation method was used to prepare Nitazoxanide sustained-release tablets by using HPMC (Hydroxypropyl Methylcellulose) K4M, HPMC K15M. The prepared tablets were assessed for release during 12 h by using USP type- II dissolution apparatus. Physical properties of Nitazoxanide tablets were studied. The in vitro release studies of sustained-release tablets were plotted in the form of graphs. The in vitro release study showed that F12 was the best formulation, extending the drug release up to 12 h, and it exhibited suitable drug release in the initial hours and the total release pattern was similar to the theoretical release profile. The drug release optimized formulation (F12) followed first-order kinetics. In vitro drug release of Nitazoxanide sustained-release tablets indicated that Nitazoxanide sustained-release tablets could therapeutically perform better than conventional tablets with better patient compliance and improved efficacy .
Key Words: Matrix tablets, Nitazoxanide, hydrophilic polymers, first-order kinetics, patient compliance.
eIJPPR 2019; 9(3):153-161 HOW TO CITE THIS ARTICLE:Mohan Arti, Alur Ashwini(2019).“Formulation and Evaluation of NitazoxanideSustained-Release Matrix Tablets”, International Journal of Pharmaceutical and Phytopharmacological Research, 9(3), pp.153-161.
INTRODUCTION
The privilege of controlled release products in the pharmaceutical field are well known and include the ability of maintaining the desired blood level of a drug over a almost longer time. While many sustained-release and controlled oral formulations are currently known, specific drugs that are almost water-insoluble and are needed with high doses (based on weight) have problems in formulation, which make them unsuitable for inclusion in a sustained-release formulation [1]. Nitazoxanide is wide-spectrum antiviral and antiparasitic drug used to treat various viral, protozoal, and helminthic infections [2]. Nitazoxanide; a high dose antiprotozoal, water-insoluble drug; is available commercially as the rapid release dosage form. There is still a need for formulating insoluble antiprotozoal drugs with increased bioavailability in the formulation of sustained-release dosage forms to provide suitable release profile of the drug. The study was undertaken with the aim of
formulating and evaluation of Nitazoxanide sustained-release tablets [3].
MATERIALS AND METHODS:
Materials:
Nitazoxanide USP was supplied as a gift sample by Chemo Lugano, Mina Pharma Ltd. Microcrystalline cellulose (Avicel PH-101) was purchased from FMC biopolymer, Polyplasdone XL 10 from ISP Pharma Ltd, Hyd, HPMC K4M, and HPMC K15M from Colorcon-Asia, Mumbai. All other used materials were of AR grade [4].
Methods:
Construction of Standard Graph of Nitazoxanide by HPLC
Chromatographic conditions:
Column: Inertsil ODS 3V, 150mm × 4.6 mm × 5µm or its
equivalent
Flow rate: 1ml/min Wavelength: 240 nm
Corresponding author: Arti Mohan
Address:Professor, Department of Pharmaceutics, Krupanidhi College of Pharmacy, 12/1, Carmelaram Road, Off Sarjapur Road,ChikkaBellandur, Carmelaram Post, VarthurHobli, Bengaluru, Karnataka 560035.
E-mail:artimohan89 @ gmail.com
Relevant conflicts of interest/financial disclosures: The authors declare that the research was conducted in the absence of any commercial or financial relationships that could be construed as a potential conflict of interest.
154
Injection volume: 10µl Run time: 10 minutes
Calculation of Sustained-Release Dose and Theoretical Release Profile of Nitazoxanide: The total dose of Nitazoxanide for twice-daily SR formulation was calculated by Robinson Eriksen [5] equation using available pharmacokinetic data.
Preparation of Nitazoxanide Matrix Tablets: All the matrix tablets, each containing 1000 mg of Nitazoxanide, were prepared by wet granulation method. Some of the formulations were prepared by using HPMC K15M, HPMC K4M, and combination of HPMC K4M,
Polyplasdone XL10, and PVPK30 to study the effect of Polymer and binder on the drug release [6].
Formulations
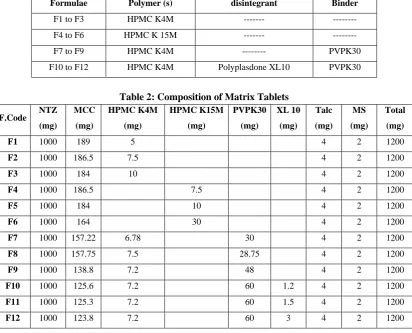
In the formulations prepared, the release retardants included hydroxypropyl methylcellulose (HPMC K4M, HPMC K15M), Microcrystalline cellulose (MCC) used as diluents. Polyplasdone XL10 used as a disintegrant, PVPK30 in purified water used as a binder solution and Magnesium Stearate (MS) 1.7% and talc 3.3% were used as lubricants. Compositions of different formulations are given in the following Tables (Table 1 and 2).
Table 1. List of Different Formulations
Formulae Polymer (s) disintegrant Binder
F1 to F3 HPMC K4M --- ---
F4 to F6 HPMC K 15M --- ---
F7 to F9 HPMC K4M --- PVPK30
F10 to F12 HPMC K4M Polyplasdone XL10 PVPK30
Table 2: Composition of Matrix Tablets
F.Code NTZ
(mg)
MCC
(mg)
HPMC K4M
(mg)
HPMC K15M
(mg)
PVPK30
(mg)
XL 10
(mg)
Talc
(mg) MS
(mg)
Total
(mg)
F1 1000 189 5 4 2 1200
F2 1000 186.5 7.5 4 2 1200
F3 1000 184 10 4 2 1200
F4 1000 186.5 7.5 4 2 1200
F5 1000 184 10 4 2 1200
F6 1000 164 30 4 2 1200
F7 1000 157.22 6.78 30 4 2 1200
F8 1000 157.75 7.5 28.75 4 2 1200
F9 1000 138.8 7.2 48 4 2 1200
F10 1000 125.6 7.2 60 1.2 4 2 1200
F11 1000 125.3 7.2 60 1.5 4 2 1200
F12 1000 123.8 7.2 60 3 4 2 1200
Evaluation of Precompression Blend
The angle of Repose: The funnel-method was used to determine the angle of repose of granules. The carefully weighed granules were taken in a funnel. The funnel’s height was adjusted so that the funnel’s tip of the just touched the heap apexof the granules. The granules were allowed to freely flow onto the surface through the funnel. The diameter of the powder cone measured and the angle of repose was calculated by using the following equation [7].
Tan θ = h/r
Where θ is the angle of repose, r and hare the radius and height of the powder cone, respectively. The angle of repose values more than 40, 30-40, 25-30, and less than
25, are indication of poor, passable, good, and excellent flow properties, respectively.
Determination of Tapped Density and Bulk Density: The carefully weighed granules/powder (W) was added into the graduated cylinder and the volume (V0) was
measured. After that, a lid was put on the graduated cylinder and it set into the tap density tester (USP). The density apparatus was set for 100 tabs and then, the volume (Vf) was measured and continued operation until
the two consecutive readings were equal [8].
Compressibility Index (Carr’s Index): Carr’s Index
155
Hausner’s Ratio: It is the ratio of tapped density and bulk density. Hausner found that this ratio was related to interparticle friction and, as such, could be used to predict powder flow properties. Generally, a value of less than 1.25 indicates good flow properties, which is equivalent to 20% of Carr’s index [10].
Evaluation of Matrix Tablets
Thickness: 20 tablets were randomly taken from the representative sample and the thickness of each of them was measured using digital verniercaliper. Average thickness and standard deviation values were calculated [11].
Hardness: Tablet hardness was measured by using
Monsanto hardness tester. The hardness of six tablets from each batch was measured and their average was recorded along with standard deviations [12].
Friability Test: Ten tablets from each batch were
carefully weighed and put in the friability test apparatus (Roche friabilator). Apparatus was operated for 4 minutes at 25 rpm and tablets were observed while rotating. After 100 rotations, the tablets were taken, dedusted and reweighed. The friability was calculated as the percentage weight loss. Friability values below 0.8% are generally acceptable [13].
Weight Variation Test: The electronic balance was used
to record the individual weight (WI) of 20 tablets from
each formulation in order to study weight variation. Their average weight (WA) was calculated. The percentage of
weight variation was calculated as follows. Average weights of the tablets along with standard deviation values were calculated [14].
Drug Content (Assay) by HPLC: Diluents i.e. 2
injections of the sample solution and 5 replicate injections of the standard solution were separately injected to the chromatograph. The chromatograms were recorded and the peak responses were measured [15].
In Vitro Drug Release (Dissolution) by HPLC
Dissolution by HPLC [16]
Dissolutions parameters
Dissolution medium: 1000 ml, 0.1 N hydrochloric acid with 10 % hexadecyltrimethylammonium bromide. Apparatus: USP type II (paddle)
RPM: 75
Time: 1st, 2nd, 3rd, 4th, 6th, 8th, 9th and 12th hours
Bath temperature: 25 ±3°C
Preparation of dissolution medium:
8.5 ml of hydrochloride acid was transferred into 1000 ml water and mixed well. Then, 100 g of hexadecyltrimethylammonium bromide was added and mixed with a magnetic stirrer until the hexadecyltrimethylammonium bromide dissolved.
Preparation of the standard solution:
50 mg of nitazoxanide working standard was accurately weighed into a 50-ml volumetric flask and dissolved in 35
ml of diluents for 5 minutes and the volume was reached 50 ml with diluents and then mixed for 2 minutes. After that, 5 ml of the solution was poured into a 50-ml volumetric flask and reached the final volume by dissolution medium.
Sample preparation:
The dissolution apparatus parameters were set as mentioned above. The tablets were transferred into each of the six individual bowls and the dissolution apparatus was operated, 20 ml sample solution was withdrawn from each dissolution jar after specified time intervals and filtered through 10 µm nylon filter and 5 ml of each of them was added into 50 ml volumetric flask and diluted to volume with dissolution medium.
Procedure:
Diluents i.e. five replicate injections of the standard solution and two injections of the sample solution were separately injected into the chromatograph. The chromatograms were recorded and the peak responses were measured.
Note: The dissolution medium should be kept above 25 °C
only for dilutions.
Calculation:
5 labelled amount of Nitazoxanide dissolved at a respective time interval (Dn)
AT WS 5 1000 50 P 100
= -- X---XX---XX--X = --- %
AS 50 50 1 5 100 label claim in mg
Where,
AT= area of Nitazoxanide in the sample solution.
AS= average area of Nitazoxanide in the standard solution.
P= purity of Nitazoxanide working standard (on the basis).
WS= weight of Nitazoxanide working standard, in mg.
Kinetic Analysis of Dissolution Data
Different kinetic models were used to describe the release kineticsfor in vitro analysis of the release data. The zero-order rate Eq (1) describes the systems where the drug release rate is independent of the concentration [17, 18]. The first order Eq. (2) describes the release from the system where the release rate is concentration-dependent [14]. Higuchi describes the drug release from the insoluble matrix as a square root of time-dependent process based on Fickian diffusion Eq. (3). The Hixson-Crowell cube root law Eq. (4) describes the release from systems where there is a change in the surface area and diameter of particles or tablets[19].
C = K0 t
156
Where, t is the time and K0 is zero-order rate constant
expressed in the unit of concentration/time.
Log C = Log C0 - K1 t / 2.303
(2)
Where, K1 is the first-order constant and C0 is the drug’s
initial concentration.
Q = KHt1/2
(3)
Where, KH is the constant reflecting the design variables
of the system.
Q01/3 – Qt1/3 = KHC t
(4)
Where, KHC is the rate constant for Hixson-Crowell rate
equation,Qt is the amount of drug remained in time t, and
Q0 is the initial amount of the drug in tablet.
The following plots were made by using the data about the in vitro drug release
Cumulative percentage of drug release vs. time (Zero order kinetic model);
Log cumulative of the percentage of drug remaining vs. time (First order kinetic model);
Cumulative percentage of drug release vs. square root of time (Higuchi model);
And cube root of the initial concentration minus the cube root of the percentage of drug remaining in the matrix vs. time (Hixson-Crowell cube root law).
Mechanism of the drug release: Korsmeyer [20] derived
a simple relationship, which described drug release from a polymeric system Eq. (5). For understanding the drug release mechanism, first, 60% drug release data were fitted in Korsmeyer–Peppas model.
Mt / M∞ = Ktn
(5)
where n is the release exponent, K is the release rate constant incorporating geometric and structural characteristics of the tablet, and Mt / M∞ is a fraction of
drug released at time t. The n value is used to characterize various release mechanisms.
A plot of log cumulative percentage of drug release vs. log time was made. nwas the slope of the line and its value was used to characterize various release mechanisms for the cylindrical-shaped matrices (Table 4). Case-II refers to the polymeric chain erosion and anomalous transport (Non-Fickian) refers to the combination of both diffusion and erosion controlled-drug release [21].
FTIR Studies
FTIR studies were conducted on drug and the formulation was optimized using Shimadzu. The samples were analyzed between wavenumbers 400 and 4000 cm-1.
RESULTS AND DISCUSSION
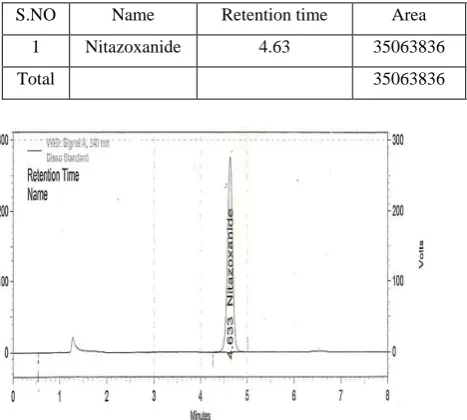
Table 3. Standard Graph of Nitazoxanide
S.NO Name Retention time Area Area Percent Theoretical plates(USP) Asymmetry
1 Nitazoxanide 4.63 35063836 100.00 8742 0.97
Total 35063836 100.00
Figure 1. Standard graph of Nitazoxanide
Dose Calculations and Theoretical Release Profile
As calculated before, the total dose required for twice-daily SR formulation of Nitazoxanide was 1000 mg and its theoretical release profile was given in Table 4.
Table 4: Theoretical Release Profile of Nitazoxanide from SR tablets
Time (hours) Cumulative % Release
0 0
3 30% - 50%
6 50% - 70%
9 NLT 75%
12 NLT 80%
Characterization of Granules
157
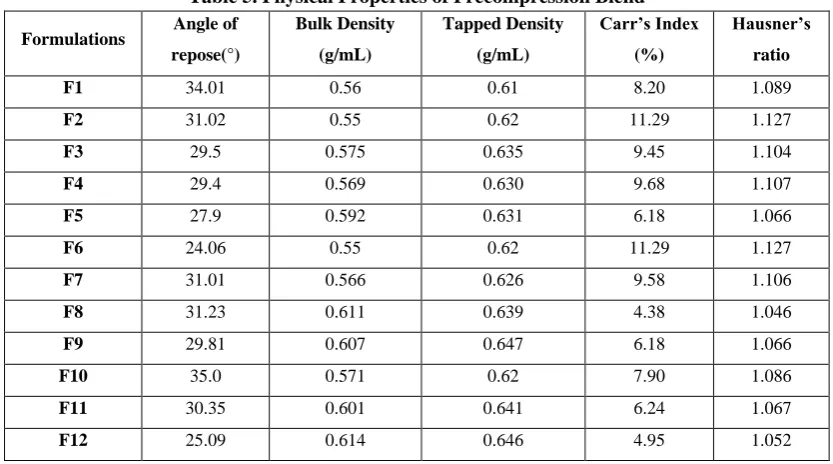
Hausner’sratio for all the batches was <1.25, which demonstrated good flow properties. The drug content was >90% for all the granules of different formulations.
Table 5. Physical Properties of Precompression Blend
Formulations Angle of
repose(°)
Bulk Density
(g/mL)
Tapped Density
(g/mL)
Carr’s Index
(%)
Hausner’s
ratio
F1 34.01 0.56 0.61 8.20 1.089
F2 31.02 0.55 0.62 11.29 1.127
F3 29.5 0.575 0.635 9.45 1.104
F4 29.4 0.569 0.630 9.68 1.107
F5 27.9 0.592 0.631 6.18 1.066
F6 24.06 0.55 0.62 11.29 1.127
F7 31.01 0.566 0.626 9.58 1.106
F8 31.23 0.611 0.639 4.38 1.046
F9 29.81 0.607 0.647 6.18 1.066
F10 35.0 0.571 0.62 7.90 1.086
F11 30.35 0.601 0.641 6.24 1.067
F12 25.09 0.614 0.646 4.95 1.052
Physical Evaluation of matrix tablets
The weights of all the tablets of different batches varied between 1195 and 1204 mg and so they complied with the official requirements of uniformity of weight. The friability values of the tablets <1% and the hardness ranged between 13-15 kg/cm2, indicating that the matrix
tablets were hard and compact. The thickness of the
tablets was between 6.6 and 6.8 mm. All the formulations satisfied the drug content as they contained 90 to 101% nitazoxanide and a good uniformity was observed in drug content. Thus, all the physical attributes of the prepared tablets were found to be practiced within control as shown in the table.
Table 6. Physical Evaluation of Matrix Tablets
F. Code Hardness (kg/cm2) † Thickness (mm) ‡ Weight (mg) ‡ Friability (%) Drug content * (%)
F1 14±1.15 6.77±0.037 1200.8±6.62 0.36 98.25±1.37
F2 15±1.0 6.78±0.039 1197±7.81 0.39 95.28±0.80
F3 16±3.51 6.785±0.04 1202.9±8.26 0.43 99.12±2.47
F4 14±1.53 6.805±0.41 1200.9±6.99 0.54 100.24±1.25
F5 13±3.06 6.801±0.381 1195.7±6.75 0.58 99.53±1.87
F6 16±1.53 6.81±0.379 1202±7.75 0.64 93.28±1.99
F7 15±2.52 6.795±0.32 1205±9.51 0.34 0.95.35±1.14
F8 14±1.00 6.78±0.04 1204.5±6.51 0.77 96.34±2.18
F9 13±1.00 6.78±0.042 1205±7.9 0.42 91.29±0.98
F10 13±3.21 6.79±0.043 1203.5±6.09 0.48 97.35±0.43
F11 14±2.65 6.78±0.03 1197±6.01 0.15 98.88±0.88
F12 15±2.52 6.81±0.35 1198±6.99 0.27 98.57±1.22
* All values represent mean ± SD, n=3, † All values represent mean ± SD, n=6‡ All values represent mean ± SD, n=10
InVitro Drug Release Studies
Drug Release from HPMC K4M Matrices.The results
of the release studies of formulations F1 to F3 are shown in Figure 4. The drug release depends on not only the drug-polymer ratiobut also the matrix nature. As the polymer percentage increased, the kinetics of release
decreased. Formulation F1, composed of polymer percentage of 0.4%, failed to sustain release. It released half of the percentage only in the 1st hr. This formulation
158
for 12 hr but as the polymer percentage increased, the kinetics of release decreased. This probably was because of the initial disaggregation or surface erosion of the matrix tablet prior to gel layer formation around the tablet core (Ebube et al., 1997). However, slow erosion took place, so it also gave less release in up to 12 hr.
Figure 2. In-vitro Drug Release Profiles of Nitazoxanide from HPMC K4M Matrices
Drug Release from HPMC K15M Matrices: In this
formulation, HPMC K15M was taken as polymer, which had more viscosity than the HPMCK4M. Thus, it slowly released the drug. This polymer was too much retarded in drug release. As shown in Table 7 and Figure 5, the drug release was very low. As the polymer percentage increased, the kinetics of release decreased. The polymer percentages 0.62%, 0.83%, and 2.5% were in the formulations F4, F5, and F6, respectively. Here, erosion of the tablet was very low. It did not extend the drug release up to 12 hr and only 15% released in last hours.
Figure 3. In-vitro Drug Release Profiles of Nitazoxanide from HPMC K15M Matrices
Drug Release from PVPK 30 Binder, HPMC K4M Matrices: In this formulation, PVPK30 was used as a binder and retarded the drug release. It may be used for the slow drug release. Combination of the binder to HPMC K4M was used in F7, F8, and F9 formulations with different percentages. In comparison to F7 and F8
formulations, F8 gave burst release, which showed 61.6% drug release in 1 hr. Its complete erosion took place. However, F7 formulation exhibited poor release. Then increased binder percentage up to 4% and the polymer percentage up to 0.6% showed a slow-release of up to 12 h. This percentage of the polymer was used for further formulations for optimization.
Figure 4. In-vitro Drug Release Profiles of Nitazoxanide from PVPK 30 Binder, HPMC K4M
Matrices
Drug Release from PVPK 30 Binder, XL 10(DT) and
HPMC K4M Matrices: In-vitro drug release was
improved by the combination of PVPK30, XL10, HPMC K4M polymer. In these formulations like F10, F11, and F12, HPMC K4M, PVPK30 percentage was taken 0.6% and 5%, respectively. However, here, XL10 was varied with formulations. F10 formulation showed 57.5% drug released at the end of the 12th h. F11 formulation showed
a low drug release profile than the F10 formulation. When 0.25% of XL10 was used, formulation showed improved drug release profile as compared to all other formulations. It can be concluded that F12 formulation was optimized, which gave a higher in-vitro drug release profile. During dissolution, the erosion was observed. The results are shown in Figure 7.
Figure 5. In-vitro Drug Release Profiles of Nitazoxanide from PVPK 30 Binder, XL 10(DT) and
159
Kinetic analysis of dissolution data. The release rate kinetic data for the F12 is shown in Table 7. drug release data were best explained by the first-order equation, as the plots showed the highest linearity (r2 = 0.958), followed by Higuchi’s equation (r2= 0.826) and Hixson-Crowell (r2= 0.782) (Figures 6-10). The drug release was best fitted in the first-order kinetics, so the rate of drug release was concentration-dependent. Higuchi’s kinetics explained why the drug diffuses at a relativelyslower rate as increasing the diffusion distance. The formulation applicability to the Hixson–Crowell cube root law
showed a change in diameter and surface area of the tablets with the progressive dissolution of the matrix as a function of time.
Mechanism of drug release. The corresponding plot (log
cumulative percent drug release vs time) for the Korsmeyer-Peppas equation showed a good linearity (r2= 0.765) (Figure 9). The diffusion exponent n was 0.45, which appears to indicate the diffusion mechanism (Fickian diffusion) and probably demonstrated that more than 1 process controlled the drug release. [22]
Table 7: Drug Release Kinetics of Batch (F12) Matrix Tablets*
Zero-order First-order Higuchi Hixson-Crowell Korsmeyer-Peppas
r2 K
0 (h-1) r2 K1 (h-1) r2 KH (h-1/2 ) r2 KHC (h- 1/ 3) r2 n KKP (h-n)
0.572 0.123 0.958 -0.072 0.826 0.549 0.782 1.528 0.765 0.45 0.316
* r2 = Correlation coefficient; K = Kinetic constant; n= Diffusional exponent.
Figure 6.Zero Order Graph of Optimized Formulation (F12).
Figure 7.First-Order Graph of Optimized Formulation (F12).
Figure 8.Higuchi Plot of Optimized Formulation (F12).
160
Figure 10.Hixson-Crowell Plot of Optimized Formulation (F12).
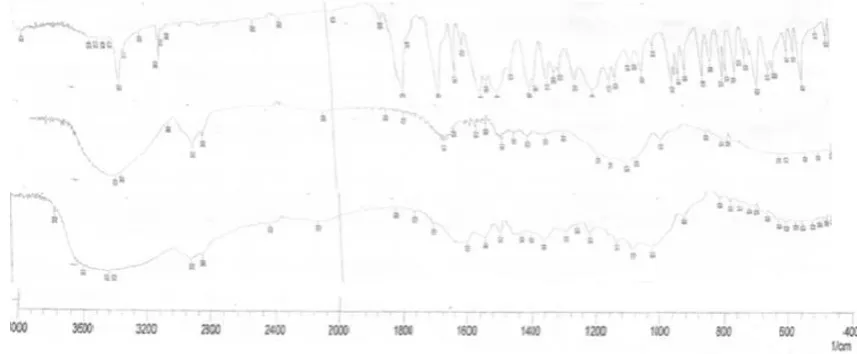
FTIR
FTIR spectra of the drug and the optimized formulation were measured at the range of 4000-400 cm-1.
Nitazoxanide showed some prominent and characteristic peaks. The peaks at 3419.79 and 3412.08 cm-1 were due
to stretching vibrations of N-H (secondary amine) bond. Peaks at 2918.3, 1716, and 1616.35 cm-1 could be
assigned to the asymmetric C-H stretching of CH3 group,
C=O (saturated ketone), and C=C weak stretching, respectively. In the optimized formulation, the presence of all the characteristic peaks of the Nitazoxanide demonstrated that no interaction occurred between the excipients and the drug.
Figure 11.FTIR analysis, (a) Nitazoxanide, (b) HPMCK4M, (c) tablet (optimized)
CONCLUSION
Results of the present study demonstrated that hydrophilic polymers could be successfully employed for formulating sustained-release matrix tablets of Nitazoxanide. All the formulations containing polymer percentage of 0.6% and MCC as a diluent extended the drug release for 12 h. Among the hydrophilic matrix formers, the drug release rate was as the following order, HPMC K4M > HPMC K15M. The combination of drug Nitazoxanide, disintegrant (Crosspovidone), and binder (Polyvinyl pyrrolidine K 30) showed a high drug release profile. This study concluded that wet granulation method was a better choice to extend the drug release for 12 h. Optimized formulation released the drug by Fickian diffusion. In the optimized formulation, the presence of all the characteristic peaks of the Nitazoxanide showed that no interaction occurred between the excipients and the drug.
ACKNOWLEDGMENTS
We thank Dr.Amit Kumar Das Principal Krupanidhi College of Pharmacy, Bangalore for his support and
Guidance. We also thank Krupanidhi College of Pharmacy, Bangalore, providing the facilities and resources.
Conflicts of Interests: Authors do not have any conflicts
of interest with the publication of the manuscript or any institution or product that is mentioned in the manuscript and/or is important to the outcome of the study or with any product that competes with the product mentioned in the manuscript.
REFERENCES
[1] Elhassan GO. Design and Evaluation of Controlled Release Matrix Tablet of Aspirin by Using Hydrophobic Polymer. International Journal of Pharmaceutical Research & Allied Sciences. 2017 Oct 1;6(4).
[2] Somvanshi VS, Ellis BL, Hu Y, Aroian RV. Nitazoxanide: nematicidal mode of action and drug combination studies. Molecular and biochemical parasitology. 2014 Jan 1;193(1):1-8. doi:10.1016/j.molbiopara.2013.12.002.
161
from Controlled Release Matrices. Internatıonal
Journal of Pharmaceutıcal and
Phytopharmacologıcal Research. 2017 Dec 1;7(6):52-8.
[4] Robinson JR, Jantez GM. Sustained and Controlled Drug Delivery: Fundamentals and Applications,3rd ed. New York, Marcel Dekker, Inc; 1996.
[5] Rashmi Dahima. Formulation and Evaluation of sustained-release Granules of Nitazoxanide. Journal of Chemical and Pharmaceutical Research, 2018, 10(2):20-24.
[6] Merchant HA, Shoaib HM, Tazeen J, Yousuf RI. Once-daily tablet formulation and in vitro release evaluation of cefpodoxime using hydroxypropyl methylcellulose: a technical note. AAPS pharmscitech. 2006 Sep 1;7(3):E178-83.
[7] Robinson J, Eriksen SP. Theoretical formulation of sustained‐release dosage forms. Journal of pharmaceutical sciences. 1966 Nov;55(11):1254-63.
[8] Reddy KR, Mutalik S, Reddy S. Once-daily sustained-release matrix tablets of nicorandil: formulation and in vitro evaluation. AAPS pharmscitech. 2003 Dec 1;4(4):480-8.
[9] Vidyadhara S, Rao PR, Prasad JA. Formulation and evaluation of propranolol hydrochloride oral controlled release matrix tablets. Indian journal of pharmaceutical sciences. 2004;66(2):188-192. [10] Lachman L, Lieberman HA, Kanig JL. The Theory
and Practice of Industrial Pharmacy. Philadelphia, PA: Lea and Febiger. 1987;317-318.
[11] Varshosaz J, Tavakoli N, Kheirolahi F. Use of hydrophilic natural gums in formulation of sustained-release matrix tablets of tramadol hydrochloride. aaps Pharmscitech. 2006 Mar 1;7(1):E168-74.
[12] Zade PS, Kawtikwar PS, Sakarkar DM. Formulation, evaluation and optimization of fast dissolving tablet containing tizanidine hydrochloride. Int J Pharm Tech Res. 2009 Jan;1(1):34-42.
[13] Gnanaprakash K, Mallikarjuna Rao K, Chandra Sekhar KB, Chetty K, Alagusundaram M, Ramkanth S. Formulation and evaluation of fast dissolving tablets of valdecoxib. Int J PharmTech Res. 2009;1:1387-93.
[14] Jain CP, Naruka PS. Formulation and evaluation of fast dissolving tablets of valsartan. Int J Pharm Pharm Sci. 2009 Jul;1(1):219-26.
[15] Jagadish B, kanda P, sivashanker R, vijaykumar P, yelchuri R, reddy L. The development of dissolution method for nitazoxanide sustained-release tablets.AAPSPharmSciTech. 2010.
[16] Imran M, Nayeem N, Mujtaba MA. Design, Synthesis and Biological Evaluation of Novel Prodrug of Alendronate. Internatıonal Journal of Pharmaceutıcal and Phytopharmacologıcal Research. 2018 Jun 1;8(3):12-7.
[17] Hadjiioannou TP, Christian GD, Koupparis MA. Quantitative Calculations in Pharmaceutical Practice and Research. VCH Publishers Inc, New York, NY, pp. 1993;345-348.
[18] D.W.Bourne. Pharmacokinetics. In: G.S.Banker, C.T.Rhodes, eds. Modern Pharmaceutical, 4th ed. New York, NY, Marcel Dekker Inc, 2002, pp.67-92.
[19] Alhmoud HA. The Uses of Matrices in Drug Delivery: The Effect of Polymers On the Drug Release and the Kinetic Models. International Journal of Pharmaceutical Research & Allied Sciences. 2017 Jul 1;6(3).
[20] Hixson AW, Crowell JH. Dependence of reaction velocity upon surface and agitation. Industrial & Engineering Chemistry. 1931 Aug;23(8):923-31. [21] Korsmeyer RW, Gurny R, Doelker E, Buri P,
Peppas NA. Mechanisms of solute release from porous hydrophilic polymers. International journal of pharmaceutics. 1983 May 1;15(1):25-35. [22] Peppas N. Analysis of Fickian and non-Fickian