Open Access
Research
An increase of cereal intake as an approach to weight reduction in
children is effective only when accompanied by nutrition education:
a randomized controlled trial
Jorge L Rosado*
1,2, María del R Arellano
†1, Karina Montemayor
†1,
Olga P García
†1and María del C Caamaño
†1,2Address: 1Facultad de Ciencias Naturales, Universidad Autónoma de Querétaro, Querétaro México and 2CINDETEC, México
Email: Jorge L Rosado* - [email protected]; María del R Arellano - [email protected]; Karina Montemayor - [email protected]; Olga P García - [email protected]; María del C Caamaño - [email protected]
* Corresponding author †Equal contributors
Abstract
Background: The main emphasis of dietary advice for control of obesity has been on reducing dietary fat. Increasing ready to eat cereal (RTEC) consumption could be a strategy to reduce fat intake and increase carbohydrate intake resulting in a diet with lower energy density.
Objectives: 1. To determine if an increase in RTEC intake is an effective strategy to reduce excess body weight and blood lipids in overweight or at risk of overweight children. 2. To determine if a nutrition education program would make a difference on the response to an increase in cereal intake. 3) To determine if increase in RTEC intake alone or with a nutrition education program has an effect on plasma lipid profile.
Experimental design: One hundred and forty seven overweight or at risk of overweight children (6–12 y of age) were assigned to one of four different treatments: a. One serving of 33 ± 7 g of RTEC for breakfast; b. one serving of 33 ± 7 g of RTEC for breakfast and another one for dinner; c. one serving of 33 ± 7 g of RTEC for breakfast and a nutrition education program. d. Non intervention, control group. Anthropometry, body composition, physical activity and blood lipids were measured at baseline, before treatments, and 12 weeks after treatments.
Results: After 12 weeks of intervention only the children that received 33 ± 7 g of RTEC and nutrition education had significantly lower body weight [-1.01 (-1.69, -0.34) ], p < 0.01], lower BMI [-0.95 (-1.71, -0.20), p < 0.01] and lower total body fat [-0.71 (-1.71, 0.28), p < 0.05] compared with the control group [1.19 (0.39, 1.98), 0.01 (-0.38, 0.41), 0.44 (0.46, 1.35) respectively]. Plasma triglycerides and VLDL were significantly reduced [20.74 (36.44, -5.05), -3.78 (-6.91, -0.64) respectively, p < 0.05] and HDL increased significantly [6.61 (2.15, 11.08), p < 0.01] only in this treatment group. The groups that received 1 or 2 doses of RTEC alone were not significantly different to the control group.
Conclusion: A strategy to increase RTEC consumption, as a source of carbohydrate, to reduce obesity is effective only when accompanied by nutrition education. The need for education could be extrapolated to other strategies intended for treatment of obesity.
Trial Registration: Australian New Zealand Clincial Trial Registry. Request no: ACTRN12608000025336
Published: 10 September 2008
Nutrition Journal 2008, 7:28 doi:10.1186/1475-2891-7-28
Received: 23 April 2008 Accepted: 10 September 2008
This article is available from: http://www.nutritionj.com/content/7/1/28
© 2008 Rosado et al; licensee BioMed Central Ltd.
Background
Recent estimates suggest that up to 1.7 billion people worldwide are overweight or obese, making it one of the biggest health threats facing world's population. Obesity lies at the other end of malnutrition scale and is becoming a public health problem in developing countries as well. Over 115 million people suffer from obesity related prob-lems in developing countries [1]. In Brazil and Colombia for example, 36 and 41% of the population respectively is overweight. Prevalence of obesity in Mexico was unknown until recently [2,3]: about 26% of children between 5 and 12 years of age and 35% of the adult women are obese. The high prevalence of obesity in the Mexican population must be contributing to the increment in chronic diseases that has been observed in recent years [4]. Health officials and academia have recognized the need for urgent preven-tive measures to stop this accelerating trend.
Several studies have identified an excessive intake of die-tary fat as a major mechanism for increasing the amount of body fat in humans and experimental animals. Diets with a high fat content are energy dense [5]. Thus, reduc-tion of dietary fat as a treatment for obesity has been a widely used approach. A number of trials with low-fat diets have demonstrated the effectiveness of such recom-mendation [6-8]. In addition to weight loss, low fat diets help maintain low cholesterol and triglyceride levels in blood, reduce leptin concentration, increase adiponectin and reduce insulin resistance, and decrease cardiovascular and diabetes risk [9,10].
An increase in the carbohydrate to fat ratio is associated with the reduction in energy density of the diet [11]. A die-tary recommendation to increase cereal consumption is a possible approach to improve the carbohydrate to fat ratio. Studies in adult men and women have demon-strated that an increase in dietary carbohydrates from ready-to-eat cereals (RTEC) or other foods, even in the lack of an advice to reduce fat, is a potentially effective approach for weight reduction [5,12,13].
The objectives of the study were: 1) To determine if an increase in cereal intake by consuming RTEC, among overweight or at risk of overweight children is an effective treatment to reduce excess body fat, 2) To determine if the inclusion of a nutrition education program in addition to an increase in carbohydrate intake has an effect on body weight and body fat, and 3) To determine if an increase in RTEC intake alone or with a nutrition education program has an effect on plasma lipid profile.
Methods
Subjects and place of study
Children were eligible if they had a BMI for age > 85% and were attending elementary school with an age range from
6 to 12 years. In order to detect children as being over-weight or at risk of overover-weight, 6 elementary schools of the city of Queretaro were randomly selected and invited to participate; 5 schools accepted participation. Parents of all children from 1st to 6th grade were invited to a session
where details of the study were explained, including ben-efits and potential risks of child participation. Parents of 905 children accepted voluntarily to participate in an ini-tial screening to detect overweight or at risk of overweight children. Weight and height were determined in all chil-dren at their schools. Chilchil-dren were weighed without sweater or jacket and without shoes using an electronic scale (SECA, Erecta 844, Hamburg, Germany) to the near-est 1 g. Height was measured using portable stadimeters (SECA, Bodymeter 208, Germany). Children with a BMI-for-age above the 85th percentile were enrolled in the
experimental study. According to the Center for Disease Control and Prevention (CDC) references, a child at risk of overweight is defined as having a BMI-for-age between the 85th and 95th percentile of the CDC growth charts [14].
Overweight is defined as a BMI-for age at or above the 95th
percentile (14).
Of the 905 children initially screened, 17% had a BMI-for-age percentile between 85% and 95%, and 18% had a BMI-for-age percentile equal or above 95%. Of these over-weight and at risk of overover-weight children, 256 accepted to participate in a longitudinal controlled study, from which 178 children completed the study. Lost to follow-up was mainly due to the children's lack of compliance to the study protocol. The sample size of 178 subjects that com-pleted the study accomplishes the expected sample size with an alpha error of 0.05 and a beta error of 0.2, to detect a BMI expected difference of 1 kg/m2, with an
expected standard deviation of BMI change of 1 kg/m2.
Blood samples were taken from children if parents agreed to the procedure. Of the 178 subjects that completed the study, a blood sample was obtained from 129 children. Children included in the study were healthy volunteers with no apparent disease apart from being overweight.
Experimental groups and treatments
grams of RTEC and in addition, both children and moth-ers received a nutrition education guide that contained recommendations for healthy eating. Children in group 4 were involved in the study and had no treatment. Follow up in all groups was for 12 weeks.
To allow for variety in the diet, children consumed from 4 different types of RTEC: a corn based RTEC (Corn Flakes®,
Kellogg Company Mexico), a pre-sweetened corn based RTEC (Zucaritas®, Kellogg Company Mexico), a
pre-sweet-ened corn based, chocolate flavored RTEC (Choco Zucar-itas®, Kellogg Company Mexico), and a pre-sweetened rice
based, chocolate flavored RTEC (ChocoKrispis®, Kellogg
Company Mexico). These RTEC were chosen because of the high consumption among children. The children were allowed to choose from the 3 pre-sweetened RTEC only for 3 days in one week and were not allowed to repeat. The remaining four days children consumed from corn-based cereal only. The mean nutrient composition of RTEC per serving was as follows: 165 Kcal (712 KJ), 5.8 g of protein, 0.5 g total fat, and 35 g of carbohydrates. The RTEC was consumed with 250 mL of cold skimmed milk in a bowl with a spoon. Compliance was recorded by weekly inter-views to the parents.
A nutrition education guide was prepared by one of us (RA) based on general recommendations for obese indi-vidual developed by Perez-Lizaur and Marvan [15] which included recommendations for the whole family and rec-ommendations for the child. The nutrition education pro-gram included 12 sessions (one per week) that were given at school to the children's parents (usually the mother), both in oral and written form. The dietary recommenda-tions were given by a nutritionist. Practice of the recom-mendations mentioned above was monitored weekly during RTEC delivery at the school by asking the parents if they had any difficulty following the nutrition educa-tion guide. Table 1 shows a summary of the major aspects included in the nutrition education guide. As part of the education guide, a sample menu was provided so that par-ents could use it to plan their meals at home and for school.
Children in all four groups were evaluated for anthro-pometry, body composition, physical activity, and blood lipids at the beginning of the study before treatments and after 12 weeks with each respective treatment.
Anthropometry, body composition and blood lipids Anthropometric measures included weight and height and were done as described above. Standardization in
Table 1: Summary of the nutrition education guide used in one treatment group
Recommendations concerning the family:
• Parents are responsible for teaching their children healthy food choices in and outside their home. • Lunch must be a simple, appetizing, easy to carry, economical and nutritious meal.
• When eating together, the rest of the family should eat the same type of foods, but the serving size may vary individually. • Mealtimes at home should be calmed and trouble-free; this is not a good time for arguments about the child's diet.
• The amount of foods eaten at home is influenced by family preferences. Watch out what is bought and stored at home. Avoid storing foods that the child may crave for such as deserts, soft drinks, candies, potato chips and other calorie dense foods.
Recommendations concerning the child
• The child must continue with his/her usual physical activity.
• Food preferences should be considered when planning the child's meals. • A child must always have breakfast before school, or during the weekend. • Consume only skimmed milk, low-fat cheese and low-fat yogurt.
• Eat the regular foods prepared at home, following the general recommendations given in the sample menu.
• If there is a mealtime out of home, child may be allowed to eat the foods available, but the amount of food consumed should be less than usual. • Avoid beverages with a high content of sugar; instead drink natural water.
• The child should replace snacks with low-sugar beverages or water and may have a calorie dense snack of his/her choice occasionally (once a week).
Foods to be included in the child's diet: • Whole grain breads, pasta, rice, cereal.
• Turkey ham, turkey sausages, chicken, tuna, eggs and beans • Low-fat milk, cheese, yogurt
• Lettuce, tomato, carrots • Any kind of fruit
Foods to be avoided in the child's diet:
• Foods with a high sugar content such as soft drinks, candy, commercial fruit juices, and chocolate.
• Foods with a high fat content, such as cream, desserts made from whole milk, peanut butter, fried food, pork and lamb meat and their products such as bacon and pork sausage.
Example of a lunch:
height and weight measures was done following standard procedures recommended by the World Health Organiza-tion [16]. Each child was evaluated by the same observer at basal and post-treatment. Body composition analysis was carried out by bioelectrical impedance using a con-ductance measurement apparatus (BIA 101, RJL Systems, Clinton TWP, MI). The apparatus was calibrated everyday before measures were carried out. Children were laid down in a bed placed in a quiet room inside the school, apart from where the rest of the measurements took place. Electrodes were placed on the left foot and right hand, after cleaning the area with alcohol. Children were asked to remain calm and not to move for the duration of eval-uation.
A fasting blood sample was drawn from every child at basal and after 12 weeks of treatment. Children in all schools were asked to attend at 8 in the morning. Mother and child were instructed that the child should not have any food after 9 p.m. on the night before. Both mother and child were asked before the blood sample was taken if the child had fasted. Blood samples were centrifuged at 1800–2000 rpm during 15 minutes and plasma was stored at -20°C until analysis. Biochemical analysis in plasma samples included triglycerides, total cholesterol and HDL cholesterol and were done using a commercial kit (Sera-Pak Kit Bayer Diagnostics, France).
Physical activity evaluation
Physical activity of all children was evaluated by asking the child's mother to fill out a questionnaire at the begin-ning of the study and 12 weeks after treatment began. The questionnaire asked to recall different physical activities normally carried out by children throughout the week as well as their duration. This questionnaire has been vali-dated and applied in previous studies [17]. The outcome of the questionnaires showed the time spent performing different activities during the week. Time of each type of activity was transformed into Metabolic Equivalent units (Mets/hr), which is the ratio of the metabolic rate during the physical activity to the resting metabolic rate, accord-ing to the compendium of physical activities from the Pre-vention Research Center of the University of South Carolina [18]. For data analysis, physical activities were grouped into intense, moderate and low depending on Mets/hr spent as follows: Low = 0 to 3 Mets/hr, Moderate = 3 to 6 Mets/hr and Intense = 6 or more Mets/hr.
Data analysis
Percent fat and fat free mass were calculated from the reac-tance and resisreac-tance values obtained in the bioimpedance analysis using the equation suggested by Kottler et al. (1996) [19]. LDL and VLDL were calculated from total cholesterol, HDL and triglycerides concentrations [20]. BMI and BMI percentile were calculated in Epi-Info
v.3.3.2. Treatment effect was measured as the change on anthropometric and biochemical determinations within initial and final measures and mean change among groups comparison. Partial measurements were analyzed to confirm validity of initial and final measurements. Within effects were carried out with a paired T-Test. Between groups effect in lipids and anthropometry changes was observed with a one-way ANOVA to compare unadjusted changes and with a univariate general linear model adjusted for baseline value, gender and interac-tions in case they resulted significant and the school ran-dom effect. Physical activity analysis was evaluated as the final evaluation controlled for baseline value, gender and the school random effect. Treatments' pairwise compari-sons were tested with the least significant difference test [21]. Additionally, an analysis of variance and a chi square test was carried out to compare baseline age, anthropom-etry and gender of subjects included in the analysis versus children that had missing data and were not included in the analysis. Statistical analyses were performed using the software SPSS, V.9.0 (Chicago, IL).
Results
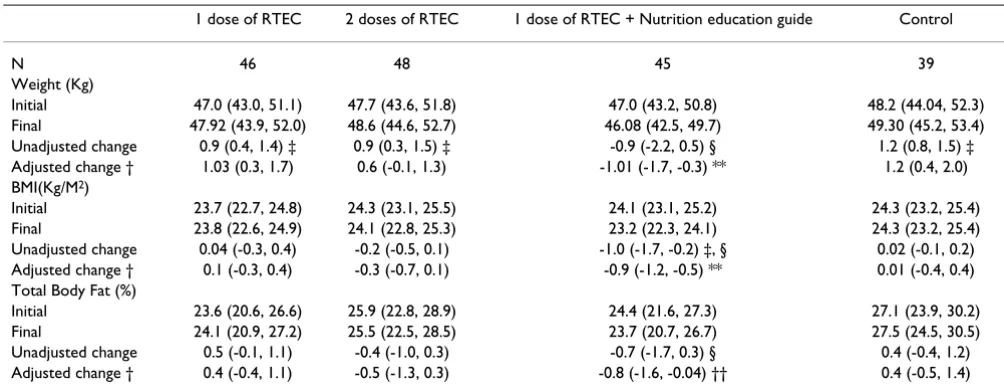
Children were recruited from October to December 2002 and the fieldwork was from January to June 2003. The sta-tistical analyses considered all children that had initial and final measurements in an intention to treat basis. Only one child that had an extreme weight final value was excluded from analysis. The participants' flow chart is shown in figure 1. Age, gender and height were not differ-ent between children included and children excluded from the analysis. Characteristics of subjects in the exper-imental groups at the beginning of the study are shown in table 2. Changes in weight, BMI and body composition are shown in Table 3. After 12 weeks of intervention there was a significant increase in body weight in the two RTEC groups and in the control group, only the group that had RTEC plus nutrition education had no increment in body weight. In analysis of variance, children that consumed one serving of RTEC and had nutrition education had a difference in unadjusted weight change of 2.03 kg com-pared with children in the control group (p < 0.01). Body weight change in the RTEC and nutrition education group adjusted for gender, school and baseline body weight was also significantly different from the control (p < 0.001) and the other two treatment groups (p < 0.01). Unad-justed and adUnad-justed changes in body weight with both treatments with RTEC alone were not statistically different from the control group. BMI reduced significantly only in the group of children that received RTEC and nutrition education (p < 0.01); children in this group had an unad-justed change in mean BMI of 0.64 kg//m2 higher than the
Flow-chart Figure 1
Flow-chart.
Analyzed with anthropometry (n=48)
Excluded from analysis (n= 0)
Analyzed with anthropometry (n=45)
Excluded from analysis (n= 0)
Analyzed with anthropometry (n=39)
Excluded from analysis (n= 0)
Assessed for eligibility (n=905)
Excluded (n=643)
Children with BMI percentile<85 (n= 588)
Children with BMI percentile >85 but refused to participate (n= 55)
Randomized (n= 262)
Allocation to group: 1 dose of RTEC
(n= 66)
Received allocated intervention (n=64)
Did not receive intervention (n= 2)
Allocation to group: 2 doses of RTEC
(n= 66)
Received allocated intervention (n= 65)
Did not receive intervention (n= 1)
Allocation to groip: 1 dose of RTEC + Education (n= 65)
Received allocated intervention (n= 63)
Did not receive intervention (n= 2)
Allocation to control group (n=65)
Received allocated intervention (n= 64)
Did not receive intervention (n=1)
Lost to follow-up; (n= 15)
Discontinued interventions (n= 2)
Lost to follow-up; (n= 13)
Discontinued interventions (n= 4)
Lost to follow-up; (n= 14)
Discontinued interventions (n= 4)
Lost to follow-up; (n= 18)
Discontinued interventions (n= 7)
Analyzed with anthropometry
(n=46)
Excluded from analysis (n= 1)
Analyzed with blood sample (n=34)
Initial or final missing result (n= 14)
Analyzed with blood sample (n=36)
Initial or final missing result (n= 9)
Analyzed with blood sample (n=27)
Initial or final missing result (n= 12) Analyzed with
blood sample (n=32)
Children in the RTEC and nutrition education group showed an unadjusted decrease in total body fat of 1.15 kg compared to the control group (p < 0.05) and the change adjusted for sex, school and baseline body fat was different from the control group and from the group with 1 dose or two of RTEC. Boys reduced total body fat 1.3% more than girls did (p < 0.05) (Data not shown). Unad-justed and adUnad-justed changes in indicators of body compo-sition in the two RTEC groups that did not receive any
nutrition education were not different compared with the control group.
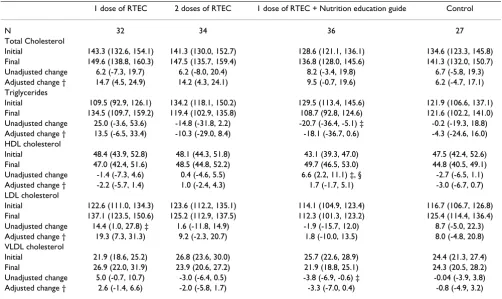
The effect of different treatments on blood lipids is shown in table 4. Only children that had RTEC and nutrition education showed a significant reduction in triglycerides (p < 0.05), an increase in HDL (p < 0.01) and a small reduction in VLDL (p < 0.05). Changes in the other groups were not statistically significant. Comparison of unad-justed changes among groups showed that only HDL Table 2: Characteristics of subjects in experimental groups at baseline *†
1 dose of RTEC 2 doses of RTEC 1 dose of RTEC + Nutrition education guide Control
N 46 48 45 39
Males % 56.4 40.5 47.5 51.6
Females % 43.6 59.5 52.5 48.4
Age (m) 110.3 ± 19.7 109.3 ± 18.9 107.8 ± 18.8 110.1 ± 18.9 Anthropometry:
Weight (Kg) 47.0 ± 12.9 47.7 ± 12.7 46.4 ± 12.2 48.2 ± 11.7 Height (Cm) 139.2 ± 12.1 139.01 ± 9.4 138.2 ± 10.8 139.8 ± 11.4 BMI (Kg/M2) 23.7 ± 3.3 24.3 ± 3.7 23.8 ± 3.1 24.3 ± 3.1
Height for age (Z-score) 0.4 ± 0.8 0.5 ± 0.8 0.5 ± 0.9 0.6 ± 1.1 Weight for age (Z-score) 2.1 ± 1.0 2.4 ± 1.4 2.2 ± 1.0 2.4 ± 1.0 Weight for height (Z-score) 2.9 ± 1.1 3.0 ± 1.0 2.8 ± 0.7 3.0 ± 0.9 Blood lipids:
N 27 36 34 32
Total Cholesterol (mg/dL) 141.3 ± 31.3 140.6 ± 32.9 127.4 ± 23.3 138.8 ± 32.9 Triglycerides (mg/dL) 108.6 ± 45.2 132.2 ± 46.4 130.2 ± 47.7 125.1 ± 45.1
* Values are means ± standard deviation unless otherwise is mentioned. † No statistical significant difference among groups was found
Table 3: Effect of treatments on anthropometry and body composition in the different groups *
1 dose of RTEC 2 doses of RTEC 1 dose of RTEC + Nutrition education guide Control
N 46 48 45 39
Weight (Kg)
Initial 47.0 (43.0, 51.1) 47.7 (43.6, 51.8) 47.0 (43.2, 50.8) 48.2 (44.04, 52.3) Final 47.92 (43.9, 52.0) 48.6 (44.6, 52.7) 46.08 (42.5, 49.7) 49.30 (45.2, 53.4) Unadjusted change 0.9 (0.4, 1.4) ‡ 0.9 (0.3, 1.5) ‡ -0.9 (-2.2, 0.5) § 1.2 (0.8, 1.5) ‡ Adjusted change † 1.03 (0.3, 1.7) 0.6 (-0.1, 1.3) -1.01 (-1.7, -0.3) ** 1.2 (0.4, 2.0) BMI(Kg/M2)
Initial 23.7 (22.7, 24.8) 24.3 (23.1, 25.5) 24.1 (23.1, 25.2) 24.3 (23.2, 25.4) Final 23.8 (22.6, 24.9) 24.1 (22.8, 25.3) 23.2 (22.3, 24.1) 24.3 (23.2, 25.4) Unadjusted change 0.04 (-0.3, 0.4) -0.2 (-0.5, 0.1) -1.0 (-1.7, -0.2) ‡, § 0.02 (-0.1, 0.2) Adjusted change † 0.1 (-0.3, 0.4) -0.3 (-0.7, 0.1) -0.9 (-1.2, -0.5) ** 0.01 (-0.4, 0.4) Total Body Fat (%)
Initial 23.6 (20.6, 26.6) 25.9 (22.8, 28.9) 24.4 (21.6, 27.3) 27.1 (23.9, 30.2) Final 24.1 (20.9, 27.2) 25.5 (22.5, 28.5) 23.7 (20.7, 26.7) 27.5 (24.5, 30.5) Unadjusted change 0.5 (-0.1, 1.1) -0.4 (-1.0, 0.3) -0.7 (-1.7, 0.3) § 0.4 (-0.4, 1.2) Adjusted change † 0.4 (-0.4, 1.1) -0.5 (-1.3, 0.3) -0.8 (-1.6, -0.04) †† 0.4 (-0.5, 1.4)
* Values are means (95% Confidence Interval).
† Estimated mean change adjusted for initial value, gender, school random effect and significant interactions. ‡Difference between initial and final is significant at p < 0.05 in paired T-Test.
§ Change is different from the control group at p < 0.05 in ANOVA
increased significantly in the group with RTEC and nutri-tion educanutri-tion compared to the control group. Treatment changes adjusted for baseline value and school were not different from the control group.
Changes ± standard deviation (SD) in intense, moderate and low physical activities in Mets/week were the follow-ing: for with 1 dose of RTEC, 13.4 ± 41.3, 4.3 ± 12.7, 3 ± 18, for group with 2 doses of RTEC 2.4 ± 61.5, -2.2 ± 17.1, 2.6 ± 31.9, for with 1 dose of RTEC + education guide -3.6 ± 52.4, -0.2 ± 16, -5 ± 19 and for the control group 4.6 ± 31.6, -1.1 ± 9.9, 6.7 ± 18.5. Changes were not statistically different neither between basal and final evaluations nor among experimental groups. When adjusting model for gender and school, boys increased their intense physical activity while girls decreased it resulting in a significant difference between boys and girls (8.8 ± 60.2 vs 12.6 ± 85.7).
Discussion
Although there are many environmental factors promot-ing excess energy intake, consumption of high fat diets increases the likelihood of obesity and the risk of obesity
is lower in individuals consuming low fat diets. A review of clinical trials and animal studies [22] suggests that the Public Health recommendation to lower dietary fat intake continues to be an appropriate measure to reduce energy intake and obesity. Fat compared with carbohydrates and proteins, increases the energy density of foods and diets.. Thus, a logical suggestion has been to replace fat with car-bohydrate and therefore, decrease the energy density of the diet [5].
The present study showed that the increase in RTEC con-sumption as a source of carbohydrate in children was effective in reducing body weight and body fat only when a nutrition education guide was included as part of the treatment. The inclusion of either one or two servings of RTEC in the diet without nutrition education was not effective in reducing body fat and did not cause any signif-icant change in body weight compared with the control no-treatment group. Kirk et al [5] found a significant reduction of 2 kg body weight in 29 adults that replaced one meal with a serving of RTEC everyday during 4 weeks as a high carbohydrate regime. Differences between our study and this study include the difference in the popula-Table 4: Effect of treatments on plasma lipids in the different groups *
1 dose of RTEC 2 doses of RTEC 1 dose of RTEC + Nutrition education guide Control
N 32 34 36 27
Total Cholesterol
Initial 143.3 (132.6, 154.1) 141.3 (130.0, 152.7) 128.6 (121.1, 136.1) 134.6 (123.3, 145.8) Final 149.6 (138.8, 160.3) 147.5 (135.7, 159.4) 136.8 (128.0, 145.6) 141.3 (132.0, 150.7) Unadjusted change 6.2 (-7.3, 19.7) 6.2 (-8.0, 20.4) 8.2 (-3.4, 19.8) 6.7 (-5.8, 19.3) Adjusted change † 14.7 (4.5, 24.9) 14.2 (4.3, 24.1) 9.5 (-0.7, 19.6) 6.2 (-4.7, 17.1) Triglycerides
Initial 109.5 (92.9, 126.1) 134.2 (118.1, 150.2) 129.5 (113.4, 145.6) 121.9 (106.6, 137.1) Final 134.5 (109.7, 159.2) 119.4 (102.9, 135.8) 108.7 (92.8, 124.6) 121.6 (102.2, 141.0) Unadjusted change 25.0 (-3.6, 53.6) -14.8 (-31.8, 2.2) -20.7 (-36.4, -5.1) ‡ -0.2 (-19.3, 18.8) Adjusted change † 13.5 (-6.5, 33.4) -10.3 (-29.0, 8.4) -18.1 (-36.7, 0.6) -4.3 (-24.6, 16.0) HDL cholesterol
Initial 48.4 (43.9, 52.8) 48.1 (44.3, 51.8) 43.1 (39.3, 47.0) 47.5 (42.4, 52.6) Final 47.0 (42.4, 51.6) 48.5 (44.8, 52.2) 49.7 (46.5, 53.0) 44.8 (40.5, 49.1) Unadjusted change -1.4 (-7.3, 4.6) 0.4 (-4.6, 5.5) 6.6 (2.2, 11.1) ‡, § -2.7 (-6.5, 1.1) Adjusted change † -2.2 (-5.7, 1.4) 1.0 (-2.4, 4.3) 1.7 (-1.7, 5.1) -3.0 (-6.7, 0.7) LDL cholesterol
Initial 122.6 (111.0, 134.3) 123.6 (112.2, 135.1) 114.1 (104.9, 123.4) 116.7 (106.7, 126.8) Final 137.1 (123.5, 150.6) 125.2 (112.9, 137.5) 112.3 (101.3, 123.2) 125.4 (114.4, 136.4) Unadjusted change 14.4 (1.0, 27.8) ‡ 1.6 (-11.8, 14.9) -1.9 (-15.7, 12.0) 8.7 (-5.0, 22.3) Adjusted change † 19.3 (7.3, 31.3) 9.2 (-2.3, 20.7) 1.8 (-10.0, 13.5) 8.0 (-4.8, 20.8) VLDL cholesterol
Initial 21.9 (18.6, 25.2) 26.8 (23.6, 30.0) 25.7 (22.6, 28.9) 24.4 (21.3, 27.4) Final 26.9 (22.0, 31.9) 23.9 (20.6, 27.2) 21.9 (18.8, 25.1) 24.3 (20.5, 28.2) Unadjusted change 5.0 (-0.7, 10.7) -3.0 (-6.4, 0.5) -3.8 (-6.9, -0.6) ‡ -0.04 (-3.9, 3.8) Adjusted change † 2.6 (-1.4, 6.6) -2.0 (-5.8, 1.7) -3.3 (-7.0, 0.4) -0.8 (-4.9, 3.2)
* Values are means (95% CI) in mg/dL.
† Estimated mean change adjusted for initial value, gender, school random effect and significant interactions. ‡ Difference between initial and final significant at p < 0.05 in paired T-test.
tion studied but more important is that the study by Kirk et al [5] did not include a control group. This makes its conclusion about the effectiveness of increasing carbohy-drate consumption as an effective approach to treat obes-ity weak. Rodearmel et al. [23] studied the impact of increasing 2 serving of RTEC/day and increasing daily steps in a 13-week intervention study as a family-based approach to prevent obesity and found significant differ-ences in children's BMI-for-age and body fat between the experimental and the control groups. The control group in this study did not receive any intervention, therefore, the effect of the RTEC seen cannot be separated from the increase in physical activity in the children.
Our study agrees with other studies [5,23] in the fact that an increase in RTEC consumption as a source of carbohy-drates was shown to be an effective strategy to lose weight in obese children but our study suggests that only when it is given with nutrition education. The change in body weight in the group receiving education and RTEC was accompanied with a reduction in total body fat. These changes did not occur in the groups that received one or two servings of RTEC and that the mother and child did not receive any nutrition education guide. These findings suggest that in our population a nutrition education guideline might be necessary for the beneficial effects of increasing carbohydrate consumption.
The importance of education programs in the treatment of obesity has been known for a number of years, but only recently it has been suggested that nutrition education should be part of any successful strategy to reduce obesity in children [24-29], adolescents [27-30] and in adults [31,32]. Also, nutrition education has proven to be effec-tive in improving nutritional status of individuals in dif-ferent populations at risk. Studies of nutrition education programs that are continuous, specific, focused and tar-geted to vulnerable populations have been successful in improving nutritional status [33-37]. Our study suggests that providing a nutrition education guide makes dietary changes, such as increase in carbohydrate consumption, more effective, and that a lack of an adequate nutritional education can cause nutritional strategies to fail.
It is important to consider that since we did not include a group receiving nutrition education alone, we are unable to conclude that the group receiving RTEC in addition to a nutrition education program works any better than nutrition education alone to increase carbohydrate intake. The study was not designed to test the effect of a nutrition education program without the increase in RTEC con-sumption.
The reduction in body fat and body weight in the RTEC and nutrition education group of the children was
accom-panied by a significant reduction in plasma triglycerides and by an elevation in HDL. Changes in these two varia-bles are clearly associated with a reduction in body fat and are beneficial to reduce health complications associated with excess of body fat.
Conclusion
We found that a strategy to increase carbohydrate con-sumption to reduce obesity in children is effective only when accompanied with a nutrition education program. An increase in RTEC intake as a source of carbohydrates with a simple nutrition education guideline produced a significant loss of body weight, a decrease in body fat and in plasma triglycerides, and an increase in high density lipoproteins. The importance of nutrition education could be extrapolated to other nutritional manipulations intended for treatment of obesity.
Consent
Written informed consent was obtained from the parents for participation and publication of results. A copy of the written consent is available for review by the Editor-in-Chief of this journal. This study was approved by the Internal Committee of Human Research of the University of Queretaro.
Competing interests
The authors declare that they have no competing interests.
Authors' contributions
JLR developed the study design, supervised the study, and made a substantial contribution with interpretation of data, drafting the manuscript and revising it critically for important intellectual content. MRA participated in the study design and coordinated the field research. KM coor-dinated the field research and supervised the quality of data collection. OPG contributed with the study concep-tion and design, interpretaconcep-tion of data and writing the publication. And MCC participated in managing the data, carried out the statistical analysis and contributed to revis-ing the manuscript. All authors read and approved the final manuscript.
Acknowledgements
We would like to thank Juana Ramirez Anguiano, Paola García Juarez and Abigail Dominguez Chavero for their dedicated work, and to Elba Suaste for her special touch when taking blood from children and her assistance with laboratory work. We are grateful to Kellogg Company México S.A de C.V. that contributed with a scientific grant for partial funding of the study.
References
1. De-Onis M, Blössner M: Prevalence and trends of overweight among pre-shoolchildren in developing countries. Am J Clin Nutr 2000, 72:1032-9.
2. Olaiz-Fernandez G, Rivera-Domarco J, Shama-Levy T, Rojas R, Villal-pando-Hernández S, Hernández-Ávila H, Sepúlveda-Amor J:
Publish with BioMed Central and every scientist can read your work free of charge "BioMed Central will be the most significant development for disseminating the results of biomedical researc h in our lifetime."
Sir Paul Nurse, Cancer Research UK
Your research papers will be:
available free of charge to the entire biomedical community
peer reviewed and published immediately upon acceptance
cited in PubMed and archived on PubMed Central
yours — you keep the copyright
Submit your manuscript here:
http://www.biomedcentral.com/info/publishing_adv.asp
BioMedcentral 3. Velazquez-Monroy O, Rosas-Peralta M, Lara-Esqueda A:
Prevalen-ciae interrelación de enfermedades crónicas no transmisi-bles y factores de riesgo cardiovascular en México: Resultados finales de la Encuesta Nacional de Salud (ENSA).
Archivo de cardiología de México 2003, 72(1):71-84.
4. Encuesta Nacional de Enfermedades Crónicas (ENEC). Book Encuesta Nacional de Enfermedades Crónicas (ENEC) (Editor ed.^eds.). City: Secretaría de Salud 1993.
5. Kirk T, Crombie N, Cursiter M: Promotion of dietary carbohy-drate as an approach to weight maintenance after initial weight loss: A pilot study. J Hum Nutr Dietet 2000, 13:277-285. 6. Jeffrey RW, Hellerstedt WL, French SA, Baxter IE: A randomized
trial of counsselling for fat restriction versus caloric restric-tion in the treatment of obesity. Obesity 1995, 19:132-137. 7. Astrup A, Ryan L, Grundwald G, Saris W, Hill W: Ad libitum low
fat diets and body fatness: a meta-analysis of intmention studies. Br J Nutr 2000, 83(Suppl 1):S25-S32.
8. Lyon XH, Di-Vetta V, Milon H, Jequier E, Schutz Y: Compliance to dietary advise directed towards increasing the carbohydrate to fat ratio of the everyday diet. Intl J Obesity 1995, 19:260-269. 9. Holmes KW, Kwiterovich PO Jr: Treatment of dyslipidemia in
children and adolescents. Curr Cardiol Rep 2005, 7:445-56. 10. Reinehr T, Roth CL, Alexy U, Kersting M, Kiess W, Andler W:
Ghre-lin levels before and after reduction of overweight due to a low-fat high-carbohydrate diet in obese children and adoles-cents. Int J Obes 2005, 29:362-8.
11. Rolls BJ: The role of energy density in the overconsumption of fat. J Nutr 2000, 130:268S-271S.
12. Kirk TR, Burkill S, Cursiter M: Dietary fat reduction achieved by increasing consumption of a starchy food – an intervention study. Eur J Clin Nutr 1997, 51:.
13. Crombie N, Kirk T: Prevention of weight gain and blood cho-lesterol reduction after consumption of a high carbohydrate food in men. Intl J Obesity 1999, 23:557.
14. Kuczmarski RJ, Ogden CL, Grummer-Strawn LM, Flegal KM, Guo SS, Wei R, Mei Z, Curtin L, Roche AF, Johnson CL: CDC growth charts: United States. In Book CDC growth charts: United States. (Editor ed.^eds.) City: National Center for Health Statistics; 2000. 15. A Pérez-Lizaur, Marvan A: Manual de documentos normales y
terapéuticos. 3a edition. México: Edit. Manual Moderno; 1996. 16. Physical growth and psychosocial development of children:
monitoring and interventions, protocols I and II, the devel-opment and field testing of techniques for monitoring. In Book Physical growth and psychosocial development of children: monitoring and interventions, protocols I and II, the development and field testing of techniques for monitoring. (Editor ed.^eds.) City: World Health Organi-zation. Maternal and child health and family planning unit; 1992. 17. Hernández B, Gortmaker SL, Laird N, Colditz G, Parra-Cabrera S,
Peterson K: Validez y reproducibilidad de un cuestionario de actividad e inactividad física para escuelas de la Ciudad de México. Salud Pública de México 2000, 42:315-323.
18. Ainsworth B: Compendium of physical activities tracking guide. In Book Compendium of physical activities tracking guide. (Editor ed.^eds.) City: Prevention Research Center, Norman J Arnold School of Public Health, University of South Carolina; 2002.
19. Kotler DP, Burastero S, Wang J, Jr RNP: Prediction of Body Cell Mass, Fat-Free Mass, and Total Body Water with Bioelectri-cal Impedance Analysis: Effects of Race, Sex, and Disease.
Am J Clin Nutr 1996, 64:489S-97S.
20. Bachorick PS, Levy RI, Rifkind BM: Lípidos y dislipoproteinemia.
In Diagnóstico y tratamiento clínicos por el laboratorio 9a edition. Edited by: Henry JB. Barcelona: Masson S A; 1993:195-221.
21. Snedecor GW, Cochran WG: Statistical methods. 7a edition. Iowa State: University Press; 1987.
22. Hill JO, Melanson EL, Wyatt HT: Dietary fat intake and regula-tion of energy balance: Implicaregula-tions for obesity. J Nutr 2000,
130:284S-288S.
23. Rodearmel SJ, Wyatt HT, Barry MJ, Dong F, Pan D, Israel RG, Cho SS, McBurney MI, Hill JO: A family-based approach to preventing excessive weight gain. Obesity 2006, 14:1392-1401.
24. Epstein LH, Roemmich JN, Raynor HA: Behavioral therapy in the treatment of pedriatic obesity. Pediatr Clin North Am 2001,
48:981-93.
25. Barlow SE, Dietz WH: Management of child and adolescent obesity: Summary and recommendations vased on reports
from pediatricians, pediatric nurse practitioners, and regis-tered dietitians. Pediatrics 2002, 110:236-38.
26. Kain J, Uauy R, Albala , Vio F, Cerda R, Leyton B: School-based obesity prevention in Chilean primary school children: Meth-odology and evaluation of a controlled study. Int Obes Relat Metab Disord 2004, 28:483-93.
27. Dietz WH, Gortmaker SL: Preventing obesity in children and adolescents. Annu Rev Public Health 2001, 22:337-53.
28. Birch LL, Davison KK: Family environmental factors influencing the developing behavioral controls of food intake and child-hood overweight. Pediatr Clin North Am 2001, 48:893-907. 29. Deckelbaum RJ, Williams CL: Childhood obesity: The health
issue. Obesity Research 2001, 9:239S-243S.
30. Stettler N: Environmental factors in the etiology of obesity in adolescents. Ethn Dis 2002, 12:41-5.
31. Crawford PB, Gosliner W, Anderson C, Strode P, Becerra-Jones Y, Samuel S, Carroll AM, Ritchie LD: Counceling latina mothers of preschool children abount weight issues: Suggestions for a new framework. J Am Diet Assoc 2004, 104:387-94.
32. McCrory MA, Suen VMM, Roberts SB: Biobehavioral influences on energy intake and adult weight gain. J Nutr 2002,
132:3830S-3834S.
33. Bhandari N, Mazumder S, Bahl R, Martines J, Black R, Bhan M, et al.:
An educational intervention to promote appropriate com-plementary feeding practices and physical growth in infants and young children in rural Haryana, India. J Nutr 2004,
134:2342-48.
34. Bronner Y, Hawkins AS, Holt ML, Hossain MB, Rowel RH, Sydnor KL, Divers SP: Models for nutrition education to increase con-sumption of calcium and dairy products among African Americans. J Nutr 2006, 136:1103-6.
35. Creed-Kanashiro H, Uribe T, Bartolini R, Fukumoto M, Lopez T, Zav-aleta N, Bentley M: dietary intake to prevent anemia in adoles-cent girls through community kitchens in a periurban population of Lima, Peru. J Nutr 2000, 130:459s-461s. 36. Guldan G, Fan H, Ma X, Ni Z, Xiang X, Tang M: Culturally
appro-priate nutrition education improves infant feeding and growth in rural Sichuan, China. J Nutr 2000, 130:1204-1211. 37. Hunt IF, Jacob M, Ostergard NJ, Masri G, Clark VA, Coulson AH: