R E S E A R C H
Open Access
Cost and cost effectiveness of long-lasting
insecticide-treated bed nets - a model-based
analysis
Anni-Maria Pulkki-Brännström
1*, Claudia Wolff
2, Niklas Brännström
3and Jolene Skordis-Worrall
1Abstract
Background:The World Health Organization recommends that national malaria programmes universally distribute long-lasting insecticide-treated bed nets (LLINs). LLINs provide effective insecticide protection for at least three years while conventional nets must be retreated every 6-12 months. LLINs may also promise longer physical durability (lifespan), but at a higher unit price. No prospective data currently available is sufficient to calculate the comparative cost effectiveness of different net types. We thus constructed a model to explore the cost
effectiveness of LLINs, asking how a longer lifespan affects the relative cost effectiveness of nets, and if, when and why LLINs might be preferred to conventional insecticide-treated nets. An innovation of our model is that we also considered the replenishment need i.e. loss of nets over time.
Methods:We modelled the choice of net over a 10-year period to facilitate the comparison of nets with different lifespan (and/or price) and replenishment need over time. Our base case represents a large-scale programme which achieves high coverage and usage throughout the population by distributing either LLINs or conventional nets through existing health services, and retreats a large proportion of conventional nets regularly at low cost. We identified the determinants of bed net programme cost effectiveness and parameter values for usage rate, delivery and retreatment cost from the literature. One-way sensitivity analysis was conducted to explicitly compare the differential effect of changing parameters such as price, lifespan, usage and replenishment need.
Results:If conventional and long-lasting bed nets have the same physical lifespan (3 years), LLINs are more cost effective unless they are priced at more than USD 1.5 above the price of conventional nets. Because a longer lifespan brings delivery cost savings, each one year increase in lifespan can be accompanied by a USD 1 or more increase in price without the cheaper net (of the same type) becoming more cost effective. Distributing
replenishment nets each year in addition to the replacement of all nets every 3-4 years increases the number of under-5 deaths averted by 5-14% at a cost of USD 17-25 per additional person protected per annum or USD 1080-1610 per additional under-5 death averted.
Conclusions:Our results support the World Health Organization recommendation to distribute only LLINs, while giving guidance on the price thresholds above which this recommendation will no longer hold. Programme planners should be willing to pay a premium for nets which have a longer physical lifespan, and if planners are willing to pay USD 1600 per under-5 death averted, investing in replenishment is cost effective.
Keywords:Insecticide-treated bed nets (ITN), Long-lasting insecticide-treated bed nets (LLIN), Replenishment, malaria
* Correspondence: [email protected] 1
UCL Centre for International Health and Development, UCL Institute of Child Health, 30 Guilford Street, WC1N 1EH London, UK
Full list of author information is available at the end of the article
Background
Distributing insecticide-treated bed nets (ITNs) has become an integral component of national anti-malaria programmes e.g. [1]. Within those programs, the World Health Organization (WHO) [2] now recommends full coverage of long lasting insecticide-treated nets (LLINs), which means that each household should own one LLIN for every two people living there [3]. LLINs were devel-oped in the 1990s and first approved by the WHO Pes-ticides Evaluation Scheme (WHOPES) in 2003. With the entry of new manufacturers in recent years, LLINs have become cheaper and more readily available. An LLIN now costs around USD 4.5 [4-6] and provides effective insecticide protection for at least 3 yearsa. By compari-son, a conventional net costs considerably less and must be retreated after 2-3 washes, or about every 6-12 months.
Few economic evaluations of LLIN distribution have been published. Mueller et al. [7] found that distributing LLINs within a measles vaccination campaign in Togo compared favourably against other public sector ITN programmes. Kolaczinski et al. [4] studied variation in usage and delivery cost in Uganda. Yukich et al. [1] used data from Togo and four conventional ITN pro-grammes and concluded that in 3 of 5 cases, 5-year LLINs were cost effective compared to conventional ITNs and to 3-year LLINs. Other LLIN programmes have been evaluated for programme effect only [8-12] with the most common measures of effect being house-hold bed net ownership and usage among children under 5.
According to the WHO’s World Malaria Report 2010, 254 million ITNs, most of them LLINs, were distributed in sub-Saharan Africa between 2008 and the first three quarters of 2010, with a further 25 million ITNs sched-uled for delivery by the end of 2010 [13]. Countries which have launched large-scale LLIN distributions include Togo, Madagascar, Zambia, Uganda, Nigeria, Sierra Leone, Kenya, Niger, Rwanda, Tanzania, Ethiopia, the Democratic Republic of Congo, and the state of Orissa in India. However, other malaria programme managers may be put off by the higher price of LLINs and may be uncertain about their cost effectiveness rela-tive to conventional ITNs.
Given the paucity of prospective data and the need for an economic evaluation of LLINs that may be valid in multiple settings, we constructed a simple model of the cost effectiveness of LLINs. Our results suggest that programme planners should be willing to pay a pre-mium for LLINs over conventional nets, especially when LLINs have a longer lifespan, and even when most con-ventional nets are regularly retreated and retreatment kits are inexpensive. More generally, we show how LLIN
programme cost effectiveness varies with bed net price, lifespan, usage and loss rates. We also estimate that in addition to the replacement of all nets every 3-4 years, distributing a smaller number of replenishment nets each year is incrementally cost effective if planners are willing to pay USD 1600 per under-5 death averted. Our model is intended to represent the costs of a large-scale national programme over a relatively long time horizon (10 years).
Methods
Literature review
Pubmed, JSTOR and Web of Science were searched using the key words “malaria nets”, “malaria cost and benefit analysis”, and “malaria nets cost effectiveness analysis"; and“malaria nets” in combination with“ inter-vention”, “cost analysis”, “cost-benefit analysis”, “cost effectiveness analysis”, “cost of illness”, “cost savings”,
“distribution cost”, “economic evaluation”, “household costs”and “primary prevention”. References of all identi-fied articles were then hand-searched to identify addi-tional articles. The main literature search was conducted between May and July 2010 and was restricted to peer-reviewed articles published in 1990 or later. Where the peer-reviewed article referred to a non-peer reviewed article for more detailed results, we also consulted the latter if necessary e.g. [1,14]. No language limiters were used in the search, however articles in a foreign lan-guage were not read except for any English-lanlan-guage abstracts.
Model specification
Programme effect
To enable comparison of programme effect in a number of settings, the main effect measure in our model is the number of people protected.“People protected” refers to the number of people who, on an average night, sleep under an ITN. The strength, and weakness, of this mea-sure is that it does not distinguish between users (adult or child) nor does it require information of the local transmission rate.
Our model assumes that the bed net programme tar-gets a population of 4 million people of whom 20% are aged under 5. Given this arbitrary population, we have calculated programme effect using assumptions about programme coverage, bed net usage and protective effect that are based on studies of previous ITN pro-grammes and current data on coverage and usage rates. The base case parameter values are summarised in Table 1. The calculation of programme effect (number of people protected and under-5 deaths averted) is detailed at the end of this section.
The RBM Partnership and the UN Secretary-General called for universal coverage of malaria prevention and treatment by the end of 2010. This would mean one LLIN for every two people (coverage) and at least 80% of people at risk from malaria using LLINs (usage) [3]. The RBM website provides an updated Progress Report, which at the time of writing suggested that 25 countries had reached 80% usage in their target populations [15]. WHO [13] estimates that 42% of African households owned at least one ITN and usage among under-5 s was 35% in 2010. Certainly the most recent Malaria Indica-tor Surveys (MIS) [16] indicate that coverage and usage have increased considerably from levels reported in
Demographic and Health Surveys (DHS) [17] conducted only few years earlier. However, the three MIS reports from 2010 available at the time of writing (Kenya, Malawi and Zambia) suggested the targets were still some way away: on average, 58% of rural households owned an ITN, and 49% of under-5 s and 45% of preg-nant women slept under an ITN.
Our base case assumes that a usage rate of 50% in the general population is achieved by distributing one net for every four people. We assume that 20% of the popu-lation are aged under 5, which gives a coverage of 0.8 under-5 s per net. This is comparable to 0.9 reported by Mulligan et al. [18] and 1.0 assumed by Yukich et al. [1]. Small-scale campaigns typically achieve higher levels of coverage than 4 people per net (e.g. 1.3-2.4 people per net in [4,19,20].
Our base case values of 4 people per net and 50% usage are lower than the RBM universal coverage target levels yet not dissimilar to levels suggested by those who argue that relatively high coverage of the whole popula-tion is the most effective way to protect vulnerable groups because of community effects [21-23]. Commu-nity effects exist if bed nets benefit non-users through a reduction in the local parasite prevalence [24-29]. This requires relatively high coverage and usage rates; e.g. 35-65% usage [23] or that over 50% of households own enough ITNs to cover all household members levels, see also [28,29].
Our assumption of 70% usage rate among under-5 s is also below the RBM goal but optimistic given actual usage rates measured after bed net distributions. Rates above 60% are rarely reported (e.g. 52% [8], 36-81% [10], 56% [11]) although [30-32] report usage rates above
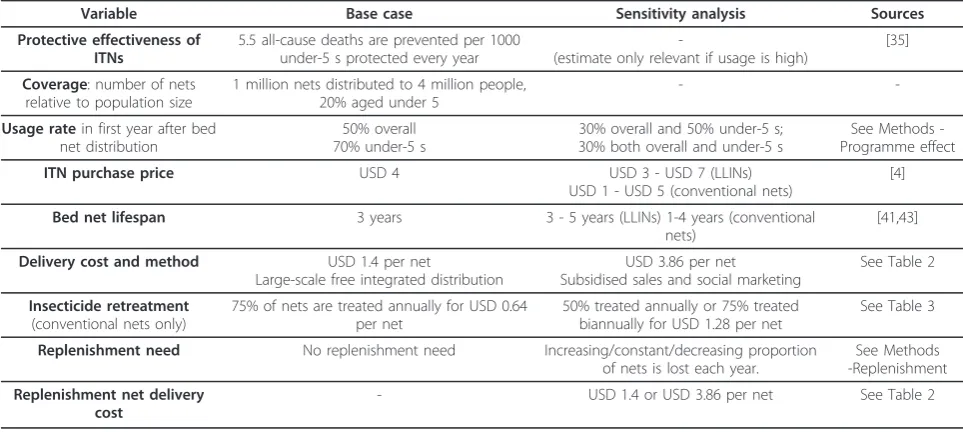
Table 1 Base case and sensitivity analysis values and sources
Variable Base case Sensitivity analysis Sources
Protective effectiveness of ITNs
5.5 all-cause deaths are prevented per 1000 under-5 s protected every year
-(estimate only relevant if usage is high)
[35]
Coverage: number of nets relative to population size
1 million nets distributed to 4 million people, 20% aged under 5
-
-Usage ratein first year after bed net distribution
50% overall 70% under-5 s
30% overall and 50% under-5 s; 30% both overall and under-5 s
See Methods -Programme effect
ITN purchase price USD 4 USD 3 - USD 7 (LLINs)
USD 1 - USD 5 (conventional nets)
[4]
Bed net lifespan 3 years 3 - 5 years (LLINs) 1-4 years (conventional nets)
[41,43]
Delivery cost and method USD 1.4 per net
Large-scale free integrated distribution
USD 3.86 per net Subsidised sales and social marketing
See Table 2
Insecticide retreatment
(conventional nets only)
75% of nets are treated annually for USD 0.64 per net
50% treated annually or 75% treated biannually for USD 1.28 per net
See Table 3
Replenishment need No replenishment need Increasing/constant/decreasing proportion of nets is lost each year.
See Methods -Replenishment
Replenishment net delivery cost
75%. There is some evidence to suggest that usage falls over time [33] however this body of evidence is small; therefore we assume that the proportion of nets used is constant. In sensitivity analysis, we examine 30% overall usage and 50% and 30% under-5 usage.
In the base case model in which there is no replenish-ment need, LLIN programme effect is constant and cal-culated as
PPLLIN=POP∗USE∗10 (1)
PPLLIN = number of people protected using LLINs over 10 years
POP= population
USE= average usage rate (%)
Conventional ITN programme effectbover the 10-year period is calculated as:
PPITN= [R∗NETS+RETREAT]∗POP∗USE/NETS(2)
PPITN = number of people protected using conven-tional ITNs over 10 years
R= number of ITN distribution rounds in the 10-year period
NETS= number of nets in each round
RETREAT = number of retreatments delivered
between rounds
The first half in square brackets represents “treated net-years” and the second half can be interpreted as the number of people protected per net distributed.
When LLINs are lost over time and not replenished, programme effect is the average number of people pro-tected over a 10-year period. For each yeart,
PP(t) =LOSS(t)∗POP∗USE (3)
LOSS(t) is the loss rate, see section Methods - Replen-ishment. When lost LLINs are annually replenished, we assume that programme effect is the same as if there was no replenishment need (1).
There is general consensus in the literature that ITNs reduce malaria morbidity and mortality. Most evidence concerns all-cause mortality, particularly among children under 5 years old, although estimates of mortality and morbidity directly attributable to malaria are also avail-able [10,34]. The Cochrane review by Lengeler [35] esti-mates that 5.5 all-cause deaths are prevented each year for every 1000 under-5 children protected. This estimate is based on small-scale studies in malaria-endemic areas with high bed net coverage, and therefore serves as an upper bound with a need for sensitivity analysis on this value. Studies published after the Cochrane review are not directly comparable, e.g. [36] only report malaria cases averted and [37] focus on long-term effects when ITN use was relatively low.
In the base case with high usage among children, we multiply the number of under-5 s protected each year by 5.5 per 1000 [35] to obtain the number of under-5 deaths averted, DA(t):
DA(t) = 5.5∗UP(t)/1000 (4)
UP(t) = no. under-5 s protected; calculated as (1) but for the under-5 population using the under-5 usage rate. We then assign 33 DALYs to each death of a child under-5, giving the number of DALYs averted each year (DALY(t)) as
DALY(t) = 33∗DA(t) (5)
This is equivalent to treating all child deaths as infant deaths and discounting at 3% per annum [1,38]. Thereby we follow the common approach in the bed net litera-ture that DALYs averted are calculated from deaths only e.g. [1,39].
Programme cost
Following the literature review, we decided upon a pre-vention-only model and a modified provider perspective such that the costs of treating malaria were excluded. We assume that each bed net is characterised by its pur-chase price, physical lifespan and the duration of insecti-cide protection.
Sensitivity analyses tend to find that bed net price and lifespan have a significant impact on programme cost effectiveness e.g. [4,40]. However, the definition of life-span is not universally agreed. In particular, should the average lifespan in the field reflect the proportion of nets lost to accidents or used for other purposes? We follow WHO [13] and define LLIN lifespan simply as the period during which LLINs retain full efficacy. The lifespan of a conventional ITN is the period for which, if regularly retreated, the net provides effective protection against malaria. In our model, lifespan determines the frequency of bed net distributions and the period over which bed net costs are annualised.
found that conventional ITNs subject to daily wear and tear lasted two to three years.
WHO’s Global Price Reporting Mechanism [6] pro-vides recent LLIN transaction price datac. For the 173 orders placed in 2010, the average unit price was USD 4.75 (range USD 3.3 to USD 7.9). There was no obvious relationship between unit price and order size (average USD 4.72 for orders of more than 100,000 LLINs). In sensitivity analysis, we vary LLIN lifespan between 3 and 5 years and unit price between USD 3 and USD 7. The choice of base case price is further supported by UNI-CEF [5] who report a weighted average price of about USD 4.5 for the first three quarters of 2010 and Kolac-zinski et al. [4] who report recent quotes of USD 3.90 and USD 4.50 obtained by the Malaria Consortium (USD 5.50 for small volume procurement). In sensitivity analysis, we allow conventional nets to have a lower purchase price (USD 1 - USD 5) and/or shorter lifespan (1 - 4 years) than LLINs. The WHO database [6] pro-vides only one record of an order for conventional nets ("non-treated bednet”) in 2010 for which the unit price was USD 2.2.
We assume that new nets (of the same type) are dis-tributed when nets reach the end of their lifespan. The same number of nets is distributed in each of these
“main” rounds, and the cost of each round is given by
NETS * (bed net purchase price + domestic delivery cost per net). In addition, lost nets may be replenished through small annual distributions between main rounds. Conventional ITN programmes also incur the cost of retreating nets. See separate sections on Deliv-ery cost, Replenishment, and Insecticide retreatment. Total programme cost is the sum of main round, replenishment and retreatment costs over 10 years less the value of bed nets with lifespan remaining. Value remaining is a share of the (discounted) last main round cost, with the share equal to the proportion of lifespan remaining, e.g. two-thirds for 3-year nets dis-tributed in year 9.
Bed net price and delivery cost were annualised over bed net lifespan using a discount rate of 3%. All costs were discounted to year zero using a discount rate of 3%. Exchange rates presented in the original sources and the US consumer price index were used to convert all costs extracted from the literature to 2009 US dollars.
Replenishment
The loss of nets over time reduces programme effect and raises the potential need to distribute replenishment nets. Nets may be lost because they i) are severely damaged through wear and tear, fire or other accident; ii) are used for other purposes; or iii) are sold or given away to relatives. However, we found no published
evidence on the cost of replenishment, and very little on replenishment need after the first year of use. Hassan et al. [44] found that 131/142 (93%) of households who had received LLINs still owned them 1.5 years later, although some of these nets were totally damaged. WHO [13] assumes that on average 4% of nets are dis-carded each year.
We examine three different scenarios of the replenish-ment need, which may or may not be met by distribut-ing new nets. Scenario 1 is based on a model developed by Albert Kiliand and assumes that the rate at which nets are lost has an S-shape: it increases over time, until 50% of the originally distributed nets are remaining, and subsequently slows down. We applied the model assum-ing that 50% of nets have been lost when the nets come to the end of their lifespan. The proportion of nets remaining in preceding years is given by:
no. nets remaining (t)
no. nets distributed (t = 0) = exp
k− k
1−(t/L)2
(6)
wherekis the bed net lifespan (in years) andtis the number of years since the distribution. Lis a parameter that depends on lifespan. First we solve forLfor values ofkbetween 2 and 5 using the assumption that whent = k, 50% of nets are remaining. Given the value ofL, the proportion of nets remaining at any time tis then easily computed. For example, for nets with a 3-year lifespan, 93.8% are remaining in the second year after the distribution, 76% in the third year, and 50% in the fourth year.
In Scenario 2, the annual loss is a constant proportion of the nets originally distributed i.e. each net has a con-stant probability of being lost. We assume that the same number of nets are lost each year, equal to 5% or 10% of the nets originally distributed. Scenario 3 is similar to the one assumed in WHO [13]: a constant proportion -we assume 5% or 10% - of nets currently owned is lost each year and thus the probability of being lost decreases over time.
Delivery cost
The evidence on distribution cost is relatively scarce, although recent evidence has emerged suggesting it var-ies with the method of distribution. Kolaczinski et al. [4] found that the antenatal care channel (USD 4.5 per net delivered) was more expensive than two targeted distri-bution campaigns (USD 3.7 and USD 3.0 respectively, 2009 USD). De Allegri et al. [40] estimated that distribu-tion cost in Burkina Faso was USD 4.8 per net (2006 USD) for both the antenatal care channel and subsidised sales.
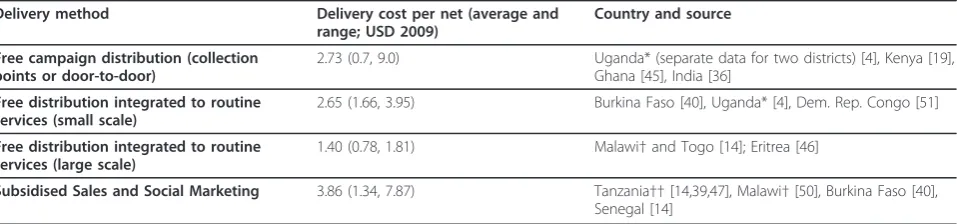
We identified 17 studies that specified the distribution method and reported economic cost data in sufficient detail for us to calculate “delivery cost” per net, defined in [1,4,14] as:Delivery cost per net = (Programme eco-nomic cost - Price of nets - Price of insecticide)/Number of nets delivered.eWe divided our delivery cost estimates into three groups depending on the distribution method used in the original study, and calculated the average cost of each method. The three different methods repre-sented in the 17 studies are broadly described as: free campaign distribution (nets are supplied at village col-lection points or delivered directly to the doorstep), free distribution integrated into routine services (typically antenatal care), and subsidised sales supported by social marketing. The average costs and sources are reported in Table 2.
Our data suggests scale effects: the seven larger pro-grammes (750,000 nets or more) cost on average USD 2.2 per net and at most USD 4.7 [18], while the maxi-mum for smaller programmes (at most 65,000 nets) was USD 9.0 [19] and the average USD 3.3.
Our base case delivery cost is USD 1.4 per net, the average for large-scale integrated distribution. Although small compared to De Allegri et al. [40] and Kolaczinski et al. [4], our figure is in fact likely to be an overesti-mate because only the cost of insecticide, not the full
cost of delivering retreatments, is subtracted. Two small-scale studies [19,45] separately reported insecticide and total retreatment costs. The proportion of insecti-cide commodity cost in total retreatment cost was 27% and 79% respectively (Table 3), which gives little indica-tion as to the likely size of the bias. Overestimaindica-tion of delivery cost means that nets which are more frequently distributed (i.e. have a shorter lifespan) will appear somewhat more expensive. However, the size of this bias is likely to be small given that the proportion of delivery cost in total cost is small. The sensitivity of our results to delivery cost is examined in sensitivity analysis.
Table 2 suggests that subsidised sales (with social marketing) and campaign delivery are more expensive on average than routine service delivery. We use USD 3.86 (subsidised sales) in the sensitivity analysis, because all the five examples of free campaign delivery are small-scale campaigns.
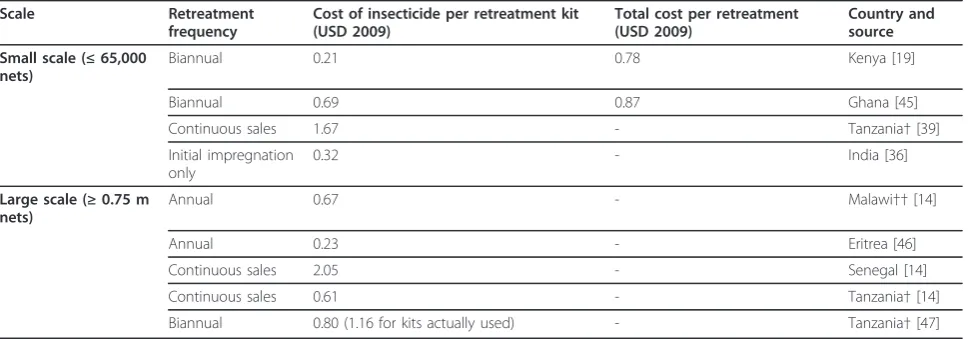
Insecticide retreatment costs and frequency
In order not to bias our findings against conventional ITNs, the base case in our model represents a“best case scenario” with respect to the retreatment of conven-tional ITNs. We assume that 75% of convenconven-tional nets are successfully retreated annually at a cost of USD 0.64 per net treated.
Our literature search revealed two small-scale studies which report a cost of USD 0.8 - 0.9 per retreatment [19,45]. Five other studies report the commodity cost of insecticide [14,36,39,46,47]. The difficulties in separating out the full costs of retreating conventional ITNs from other programme costs are discussed in Yukich et al. [1,14]. To make use of the available data, we estimated retreatment cost from the seven studies by dividing insecticide cost by the number of retreatments and initial impregnations. The median cost is our base case
Table 2 Delivery cost estimates
Delivery method Delivery cost per net (average and range; USD 2009)
Country and source
Free campaign distribution (collection points or door-to-door)
2.73 (0.7, 9.0) Uganda* (separate data for two districts) [4], Kenya [19], Ghana [45], India [36]
Free distribution integrated to routine services (small scale)
2.65 (1.66, 3.95) Burkina Faso [40], Uganda* [4], Dem. Rep. Congo [51]
Free distribution integrated to routine services (large scale)
1.40 (0.78, 1.81) Malawi†and Togo [14]; Eritrea [46]
Subsidised Sales and Social Marketing 3.86 (1.34, 7.87) Tanzania††[14,39,47], Malawi†[50], Burkina Faso [40], Senegal [14]
Notes to Table 2. Studies that reported financial costs only e.g. [22,62] were excluded.
* For Uganda, [4] report costs for two delivery channels in two districts: campaign delivery in both districts, and delivery through antenatal care in one district.
†The Malawi programme relied more heavily on sales in the early years and routine service delivery later on. We classify Stevens et al. [50] as sales but Yukich et al. [14] as integrated delivery because the latter include two additional years of data.
estimate. The sources and estimates are reported in Table 3.
Only considering the commodity cost of insecticide means that we underestimate the true cost of conven-tional ITNs. In the sensitivity analysis, we therefore dou-ble the cost to USD 1.28, which reflects the Yukich et al. [14] estimate that the share of insecticide in total retreatment cost is 50%; Wiseman [19] and Binka [45] report 27% and 79% respectively.
The paucity of evidence on retreatment cost may partly be explained by low retreatment rates. Mulligan et al. [18] found that 69% of mothers given a retreat-ment kit used it to retreat their nets. Marchant et al. [48] found that low retreatment was the main reason for low ITN coverage. Armstrong Schellenberg et al. [49] conclude that most of those households who had tried retreatment did not make a regular habit of it. Indeed, the WHO (2008) cited difficulties in effectively deliver-ing retreatment as a reason for recommenddeliver-ing the move conventional nets to LLINs. In sensitivity analysis, we reduce the retreatment rate from 75% to 50%.
Typically the initial impregnation and subsequent retreatments are assumed to provide either 6 months or 1 year of protection e.g. [1,47,50] and the other value is assumed in sensitivity analysis. This assumption can have a significant effect on programme cost effective-ness. For example, Yukich et al. [1,14] conclude that if insecticide lasts for one year, conventional nets are as cost effective as LLINs in two out of five large-scale pro-grammes, but if retreatment is required every six months, LLINs are more cost effective in all five cases. Reducing the duration of insecticide protection from 1 year to 6 months has approximately the same effect as doubling the cost of retreatment, which is why we do
not separately report on sensitivity analysis for the dura-tion of insecticide protecdura-tion.
Results and discussion
Long-lasting versus conventional ITNs in the base case LLINs are more cost effective than conventional ITNs in the base case in which there is no difference in purchase price or lifespan. Each delivered LLIN costs USD 5.14 on average over the 10-year period. A conventional net that is regularly retreated with insecticide costs USD 6.94 on average. The difference of USD 1.80 per net is explained by a higher total cost (due to the additional cost of retreatment) and a smaller programme effect (fewer treated net-years due to a 75% retreatment rate) in the conventional net programme. The annual cost is USD 1.71 per LLIN and USD 2.31 per treated conven-tional net.
The base case represents a highly effective pro-gramme. On average over 10 years, 850,000 of the 1 million conventional nets distributed provide effective protection for 1.70 million people including 476,000 children under 5 each year. The annual cost is USD 1.16 per person or USD 4.13 per child. An estimated 26,180 deaths, equivalent to about 864,000 DALYs, are averted over 10 years.
Using LLINs improves cost effectiveness by 26%. The number of people protected is 2 million each year, including 560,000 children under 5, at an annual cost of USD 0.86 per person or USD 3.06 per child. An esti-mated 30,800 child deaths, equivalent to some 1.02 mil-lion DALYs, are averted over 10 years, at a cost of USD 556 per death or USD 16.8 per DALY averted. The cost saving compared to conventional ITNs is equal to USD 1.07 per under-5 (USD 0.30 per person) protected per
Table 3 Insecticide retreatment cost estimates
Scale Retreatment
frequency
Cost of insecticide per retreatment kit (USD 2009)
Total cost per retreatment (USD 2009)
Country and source Small scale (≤65,000
nets)
Biannual 0.21 0.78 Kenya [19]
Biannual 0.69 0.87 Ghana [45]
Continuous sales 1.67 - Tanzania†[39]
Initial impregnation only
0.32 - India [36]
Large scale (≥0.75 m nets)
Annual 0.67 - Malawi††[14]
Annual 0.23 - Eritrea [46]
Continuous sales 2.05 - Senegal [14]
Continuous sales 0.61 - Tanzania†[14]
Biannual 0.80 (1.16 for kits actually used) - Tanzania†[47]
Notes to Table 3.†For Tanzania we use different sources for different programmes: Yukich et al. [14] for SMARTNET, Mulligan et al. [47] for TNVS, and Hanson et al. [39] for KINET.
year, equivalent to USD 195 per death averted or USD 5.90 per DALY averted. How changes to the parameters of the base case change the above results is discussed in the following sections.
Bed net price and lifespan
The LLIN is the more cost effective option if LLINs and conventional nets have the same lifespan, unless the LLIN price is above a certain threshold. In the base case, the price differential must be greater than USD 1.5. For example, if the 3-year conventional ITN is priced at USD 2.4 and the 3-year LLIN at USD 4, or the conventional net is USD 4 and the LLIN USD 5.9, then the two nets are equally cost effective. The price differ-ential necessary to change cost effectiveness in favour of conventional nets is larger if the retreatment rate is less than 75%, the retreatment need more frequent, or the retreatment cost larger. For example, if the retreatment rate is 50% (or either retreatment is biannual or the cost per retreatment is USD 1.28), the conventional net must be priced at USD 1.9 (1.6) to be cost effective against the LLIN which costs USD 4.
A longer lifespan also brings delivery cost savings. For example, using 5-year LLINs instead of 3-year LLINs reduces the cost per under-5 death averted by USD 204 in the base case if there is no difference in price. Gener-ally, we find that price can increase by USD 1 or more for each one-year increase in lifespan, if nets are of the same type.
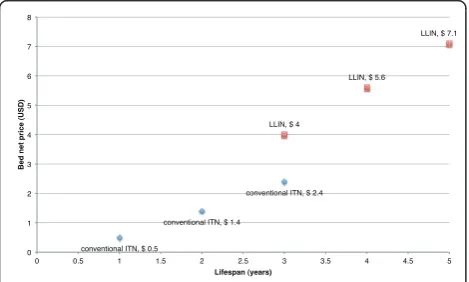
Figure 1 illustrates bed nets of different price, lifespan and type which are equally cost effective as the 3-year LLIN at USD 4. In this case, a 4-year LLIN at more than double the price of a 3-year conventional net (USD 5.6 vs. USD 2.4) is equally cost effective, and a 2-year advantage in lifespan can be accompanied by nearly a
tripling of the price (USD 7.0). Thus if LLINs can offer a longer lifespan, programme planners should be willing to pay a considerably higher price for LLINs than for conventional nets. As we have demonstrated, this is the case even in programmes which inexpensively retreat a large proportion of conventional nets. The advantage that LLINs have over conventional nets - that they do not have to be retreated - is magnified for each addi-tional year of useful life.
Importance of usage rate for programme effect
Programme effect falls proportionally with reductions in the usage rate. Given the same number of nets as in the base case, a 40% reduction in the usage rate from 50% to 30% means 0.8 million (40%) fewer people are pro-tected each year compared to the base case. Conse-quently, cost per person protected rises to USD 1.43 per year from USD 0.86 in the base case (63% increase). This relationship between the usage rate and pro-gramme cost effectiveness is illustrated in Figure 2. If the programme uses conventional nets, the same reduc-tion in usage means that cost per person increases from USD 1.16 to USD 1.93 per year (66% increase) as 680,000 fewer people on average are protected each year.
Our base case with 1 net per 4 people and 50% usage represents a more cost effective programme than one that reaches GMAP and RBM’s target coverage and usage values of 1 net per 2 people and 80% usage. This is because with 1 net per 4 people, 40% usage would be
conventional ITN, $ 2.4
conventional ITN, $ 1.4
conventional ITN, $ 0.5
LLIN, $ 7.1
LLIN, $ 5.6
LLIN, $ 4
0 1 2 3 4 5 6 7 8
0 0.5 1 1.5 2 2.5 3 3.5 4 4.5 5
Bed net price (USD)
Lifespan (years)
Figure 1Equally cost effective bed nets of different price, lifespan and type. Each bed net choice is as cost effective as the base case, the 3-year LLIN priced at USD 4. Programme cost is USD 1.71 per net delivered (and retreated) per annum, USD 0.85-0.86 per person (USD 3.05-3.06 per under-5) protected per annum, USD 554-556 per under-5 death averted and USD 16.8-16.9 per DALY averted.
1.93
1.44
1.16 0.96
0.83 0.72 1.43
1.07 0.86
0.71 0.61
0.54 7.13
5.35
4.28
3.57 3.06
2.86
0 1 2 3 4 5 6 7 8
0 0.5 1 1.5 2 2.5 3
30 40 50 60 70 80
Cost per under-5 protected (USD)
Cost per person protected (USD)
Usage rate (%)
LLIN: cost per person protected
conventional ITN: cost per person protected
LLIN: cost per under-5 protected
sufficient for a programme to be equally cost effective as one with 80% usage and 1 net per 2 people. The com-parison is somewhat theoretical however, as in practice distributing a given number of nets to twice the popula-tion would be expected to affect programme cost.
Returning to LLINs, if the under-5 usage rate is 50% (30%), 160,000 (320,000) fewer children are protected each year than in the base case (70% usage) and cost per under-5 increases from USD 3.1 to USD 4.3 (7.1) per year. We do not report cost per death averted here because the Lengeler [35] estimate of protective efficacy applies only in high usage settings (see Methods - Pro-gramme effect).
Replenishment
The cost of replenishment depends on the loss rate, the type of nets distributed, and delivery cost. In the follow-ing discussion we only consider LLINs in order to abstract from the cost of retreating conventional nets in combination with replenishing lost nets. In Scenario 1, where the number of nets lost increases over time, some 62,000 nets must be distributed in the beginning of the second and 177,000 nets in the third year after each main distribution round in order to keep the number of people protected constant until the next main distribu-tion round in year 4. Assuming nets are priced at USD 4 and the delivery method is the same as in the main rounds (delivery cost of USD 1.4 per net), the six replenishment rounds over 10 years increase overall
programme cost by 26%. In Scenarios 2 and 3 a con-stant proportion of nets distributed/remaining is replen-ished annually. If this is 10%, replenishment increases programme cost by 22%. Halving the annual replenish-ment need to 5% also halves the increase in cost to 11%. Scenario 1 indicates a larger replenishment need than Scenarios 2 and 3 if lifespan is less than 4 years. If life-span increases, the three scenarios converge: fewer nets are needed in Scenario 1 while more are needed in Sce-narios 2 and 3. 4-year nets require seven replenishment rounds, which implies one additional replenishment round in Scenarios 2 and 3 but 72,000 fewer nets overall in Scenario 1 (37,00 nets in year 2, 106,000 in year 3 and 162,000 in the year before the next main distribu-tion). In this case, the S-shape assumption and a 10% annual replenishment need both imply that replenish-ment increases total cost by 33%.
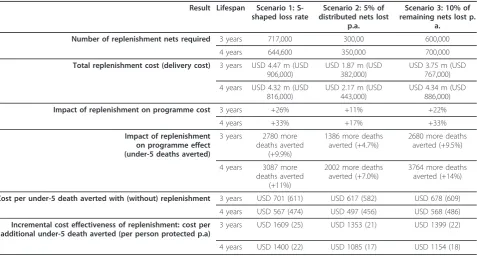
In Table 4 we present the incremental cost effective-ness of replenishment in three scenarios and for both 3-and 4-year LLINs. Scenario 2 has the smallest annual replenishment need: 5% of distributed nets. Replenish-ment increases programme cost by 11-26% (17-33%) if lifespan is 3 (4) years. Note that the cost of replenish-ment in Scenario 2 is now exactly half of that in Sce-nario 3. Replenishment increases the number of under-5 deaths averted by 5-10% (7-14%) if lifespan is 3 (4) years. A programme without replenishment is somewhat more cost effective; for example, USD 701 vs. USD 611 per death averted in Scenario 1. The cost of
Table 4 Impact of replenishment on LLIN programme cost and cost effectiveness
Result Lifespan Scenario 1: S-shaped loss rate
Scenario 2: 5% of distributed nets lost
p.a.
Scenario 3: 10% of remaining nets lost p.
a. Number of replenishment nets required 3 years 717,000 300,00 600,000
4 years 644,600 350,000 700,000
Total replenishment cost (delivery cost) 3 years USD 4.47 m (USD 906,000)
USD 1.87 m (USD 382,000)
USD 3.75 m (USD 767,000)
4 years USD 4.32 m (USD 816,000)
USD 2.17 m (USD 443,000)
USD 4.34 m (USD 886,000)
Impact of replenishment on programme cost 3 years +26% +11% +22%
4 years +33% +17% +33%
Impact of replenishment on programme effect (under-5 deaths averted)
3 years 2780 more deaths averted
(+9.9%)
1386 more deaths averted (+4.7%)
2680 more deaths averted (+9.5%)
4 years 3087 more deaths averted
(+11%)
2002 more deaths averted (+7.0%)
3764 more deaths averted (+14%)
Cost per under-5 death averted with (without) replenishment 3 years USD 701 (611) USD 617 (582) USD 678 (609) 4 years USD 567 (474) USD 497 (456) USD 568 (486)
Incremental cost effectiveness of replenishment: cost per additional under-5 death averted (per person protected p.a)
3 years USD 1609 (25) USD 1353 (21) USD 1399 (22)
4 years USD 1400 (22) USD 1085 (17) USD 1154 (18)
replenishment is USD 17-25 per additional person pro-tected per annum or USD 1080-1610 per additional under-5 death averted.
The incremental cost effectiveness of replenishment is not very sensitive to replenishment delivery cost because this is a relatively small proportion of total replenish-ment cost. For example, increasing delivery cost by some 2.5 times to USD 3.86 per net (the average for subsidised sales and social marketing, see Table 2) increases the incremental cost of replenishing 3-year LLINs by 34%. The total cost of replenishment increases by 7.0%/3.3%/6.1% in Scenario 1/2/3, giving a cost of USD 33/28/29 per additional person protected per annum or USD 2151/1811/1873 per additional under-5 death averted.
Limitations
The generalisability of cost effectiveness results from past to future programmes, or across programmes of different scale, is hindered by the relative lack of evi-dence on some key determinants of programme cost and effect, as well as the complexity of the relationships involved. Our literature review identified the following elements of the full (provider) costs on which there is little or no published evidence: international transport costs and transaction costs relating to the bed net pro-curement process. We suspect two reasons for why these cost categories have not been discussed: i) the short time scale of most evaluations, and ii) modified provider perspective are the norm and as such, costs incurred by the procuring body (e.g. donor) are not included.
International transport costs do not affect the choice of net as long as manufacturers are located in the same region, however import taxes and tariffs will be relevant for individual countries and for the comparison of pro-gramme costs across countries. With the exception of Becker-Dreps et al. [51] and Yukich et al. [1,46], interna-tional shipping costs are not discussed in the bed net lit-erature. Yukich et al. [46] use the commodity, insurance and freight (CIF) price of bed nets, and Yukich et al. [1] use either the CIF price or the full retail price plus sub-sidies. WHO-CHOICE [52] (see also [53]) suggest esti-mating international shipping costs by multiplying commodity prices by a so-called CIF/FOB mark-up, equal to 25% and 44% for the WHO regions South East Asia D and Africa D respectively. Because the effect of such a mark-up on our results is similar to changes in bed net price, which we already discuss at length, we do not report on the results here. We presume that the lack of data is either because the cost is already included in the price paid for nets or international transport cost is incurred by donors of nets (e.g. Becker-Dreps et al.
[51] report that nets donated by the Global Fund were valued at USD 8 including shipping and customs).
Procurement overheads, on which we could not find any evidence, are nevertheless likely to be of increasing relevance to programme planners and evaluations with repeated bed net purchasing and distribution. We would expect that the procurement of bed nets incurs over-heads such as the costs of a tender process. We consid-ered the effect of an arbitrary fixed cost of USD 200,000 for every main distribution round on the results in Fig-ure 1 and found that the price of the 5-year LLINs could increase to USD 7.2 but otherwise a cost of this magnitude (3.7% of total programme cost over 10 years) has little impact on the relative cost effectiveness of nets with different lifespans (results not reported). The lack of literature on overheads may be because these costs are absorbed into overall programme cost e.g. [1,19] or again because these costs are commonly incurred by donors. In the long run however, such costs should not be ignored, particularly if local ownership of pro-grammes is being encouraged alongside the sustainabil-ity of interventions and if the frequency of required bed net distributions is high.
We treat the usage rate rather simplistically in our model because evidence on its determinants and varia-tion over time is relatively scattered. Consistent with the findings of Yukich et al. [1] and Kolaczinski et al. [4], we assume that the distribution channel does not lead to significant differences in usage or retention. Specifi-cally, paying for a net does not appear to be associated with a greater likelihood of use [54,55].
A limitation of our model is that we do not address issues of equity. Our sensitivity analysis is also limited by the lack of evidence on the efficacy of nets when cov-erage or usage is low. We have overcome the issue in part by referring to the number of people protected. Other issues around programme effect discussed in the literature but excluded from our model because of the relatively small evidence base are the protective efficacy of untreated nets and nets used beyond their lifespan, and the long-term effects of ITN use. There is some evi-dence that unprotected nets i.e. conventional ITNs which have not been treated with insecticide in the last 6-12 months, provide protection against malaria [56,57]. Long-term effects are a concern if, without repeated exposure to malaria, malaria infections are simply post-poned to later in childhood when the morbidity effects may be even more serious [58,59]. Askjaer et al. [60] find evidence of lower levels and less diversity of antibo-dies, while others find no evidence of negative long-term effects [26,61].
true programme effect, long-term effects would imply that our model overestimates effect. We thus implicitly assume that the two effects cancel out. We also consider our simplified approach to programme effect justified because of its transparency. As a first step, we would suggest extending our model so that protection offered by replenishment nets is calculated from the date of delivery rather than the date of procurement. However, we expect that our current specification better mirrors true programme cost because programme managers may prefer to use a simple, transparent formula, as we have done here.
Conclusions
This paper uses a modelling approach to integrate the available evidence on the cost effectiveness of conven-tional and long-lasting ITNs. Our discussion focuses particularly on those factors which decision-makers facing a choice of nets should consider. Our results sup-port the WHO [2] recommendation to distribute only LLINs, in particular if LLINs have a longer lifespan. Our analysis also identifies the pricing thresholds above which this recommendation will no longer hold.
In our base case, LLINs are 26% more cost effective than conventional nets. The difference is large, consider-ing that we have assumed a successful conventional ITN programme in which a high proportion of nets are retreated at a low cost. The cost saving offered by LLINs is equal to USD 0.30 per person protected per year, or USD 195 per under-5 death averted. If conven-tional nets and LLINs have the same lifespan (3 years), LLINs are more cost effective unless they are priced at more than USD 1.5 above the price of conventional nets. Because a longer lifespan brings delivery cost sav-ings, each one year increase in lifespan can be accompa-nied by a USD 1 or more increase in price without the cheaper net (of the same type) becoming more cost effective.
In line with previous studies, we find that cost effec-tiveness is highly sensitive to the usage rate. If the (LLIN) programme achieves a 50% (30%) under-5 usage rate rather than the 70% assumed in the base case, the cost per under-5 protected is USD 4.3 (7.1) rather than USD 3.1 per year.
We estimate that if programme planners are willing to pay USD 1600 per under-5 death averted, investing in replenishment is cost effective. As LLINs become increasingly common, we suspect that attention of pro-gramme planners and academics alike will turn increasingly to the issue of replenishment: what is the replenishment need (or loss rate), how should replen-ishment be carried out, if at all, and at what cost. Thus more publicly available data on the replenish-ment need and its determinants would be highly
valuable. One concern with the move to LLINs is whether less frequent distribution and the cessation of retreatment activities - as would be the case with LLINs - would negatively affect usage rates. The evi-dence is currently unable to predict whether this would be the case.
Endnotes
a
See pages 10-11 for WHOPES approval conditions.
b
The formula assumes that insecticide protection lasts for 1 year. If duration is 6 months, a multiplier of 0.5 should be used.
c
We thank a reviewer for suggesting this resource.
d
Our operationalisation of Scenario 1 directly draws on a formula developed by Nakul Chitnis of the Swiss Tropical Institute. Albert Kilian of the Malaria Consor-tium shared this formula with us through personal cor-respondence. Kilian has synthesised the available (but as yet unpublished) evidence on the loss of nets over time.
e
For studies that only reported annual economic cost, we estimated delivery cost as:(Annual economic cost -Price of nets - -Price of insecticide) * Length of programme (years)/Number of nets delivered.
Abbreviations
CIF: Cost, insurance and freight; DALY: Disability-adjusted life-year; FOB: Free on board; ITN: Insecticide-treated bed net; LLIN: Long-lasting insecticide-treated bed net; RBM: Roll Back Malaria Partnership; WHO: World Health Organization; WHOPES: World Health Organization Pesticides Evaluation Scheme.
Acknowledgements
We thank Albert Kilian of the Malaria Consortium for sharing his model of the loss rate.
Author details
1UCL Centre for International Health and Development, UCL Institute of
Child Health, 30 Guilford Street, WC1N 1EH London, UK.2Department of Economics, Stockholm School of Economics, P.O. Box 6501, Stockholm 118 83, Sweden.3Department of Mathematics, University of Helsinki, Helsinki 00014, Finland.
Authors’contributions
APB constructed the model, drafted the manuscript and contributed to the design of the study and the literature review. CW carried out the literature review, contributed to drafting the manuscript and revised the model and the manuscript. NB helped to construct the model and critically revised the manuscript. JSW designed and coordinated the study and critically revised the manuscript. All authors read and approved the final manuscript.
Competing interests
APB, CW and JSW received funding from Bayer S.A.S. (Lyon) to carry out the literature review and construct the model used in this paper. The funder had no role in the literature review, choice of model parameters, or writing of the manuscript.
Received: 10 June 2011 Accepted: 4 April 2012 Published: 4 April 2012
References
2. WHO Global Malaria Programme:Insecticide-treated mosquito nets: a WHO position statement.Geneva: World Health Organization; 2007 [http:// www.who.int/malaria/publications/atoz/itnspospaperfinal.pdf].
3. Roll Back Malaria:The Global Malaria Action Plan - For a malaria-free world.Roll Back Malaria Partnership; 2008 [http://www.rollbackmalaria.org/ gmap/gmap.pdf].
4. Kolaczinski J, Kolaczinski K, Kyabayinze D, Strachan D, Temperley M, Wijayanandana N, Kilian A:Costs and effects of two public sector delivery channels for long-lasting insecticidal nets in Uganda.Malar J2010,9:102. 5. UNICEF Supply Division:Overview of UNICEF’s Procurement of LLINs
(presentation slides), Long-Lasting Insecticidal Nets (LLINs) Suppliers Meeting, 28 October 2010.[http://www.unicef.org/supply/files/
2010_LLIN_Overview_and_Challenges_-_LLIN_Suppliers_Meeting_28_October.pdf].
6. World Health Organization:Global Price Reporting Mechanism.[http:// apps.who.int/hiv/amds/price/hdd/index.aspx].
7. Mueller D, Wiseman V, Bakusa D, Morgah K, Dare A, Tchamdja P: Cost-effectiveness analysis of insecticide-treated net distribution as part of the Togo Integrated Child Health Campaign.Malar J2008,7:73. 8. Hightower A, Kiptui R, Manya A, Wolkon A, Vanden Eng J, Hamel M,
Noor A, Sharif SK, Buluma R, Vulule J,et al:Bed net ownership in Kenya: the impact of 3.4 million free bed nets.Malar J2010,9:183.
9. Kulkarni MA, Vanden Eng J, Desrochers RE, Cotte AH, Goodson JL, Johnston A, Wolkon A, Erskine M, Berti P, Rakotoarisoa A,et al:
Contribution of integrated campaign distribution of long-lasting insecticidal nets to coverage of target groups and total populations in malaria-endemic areas in Madagascar.Am J Trop Med Hyg2010,
82:420-425.
10. Terlouw DJ, Morgah K, Wolkon A, Dare A, Dorkenoo A, Eliades MJ, Vanden Eng J, Sodahlon YK, Ter Kuile FO, Hawley WA:Impact of mass distribution of free long-lasting insecticidal nets on childhood malaria morbidity: the Togo National Integrated Child Health Campaign.Malar J2010,9:199. 11. Thwing J, Hochberg N, Vanden Eng J, Issifi S, Eliades MJ, Minkoulou E,
Wolkon A, Gado H, Ibrahim O, Newman RD, Lama M:Insecticide-treated net ownership and usage in Niger after a nationwide integrated campaign.Trop Med Int Health2008,13:827-834.
12. Vanden Eng JL, Thwing J, Wolkon A, Kulkarni MA, Manya A, Erskine M, Hightower A, Slutsker L:Assessing bed net use and non-use after long-lasting insecticidal net distribution: a simple framework to guide programmatic strategies.Malar J2010,9:133.
13. World Health Organization:Ch. 4 Vector control.World Malaria Report 2010 Geneva: World Health Organization; 2010.
14. Yukich J, Tediosi F, Lengeler C:Operations, costs and cost-effectiveness of five insecticide treated net programs (Eritrea, Malawi, Tanzania, Togo, Senegal) and two indoor residual spraying programs (KwaZulu-Natal, Mozambique).Swiss Tropical Institute; 2007 [http://www.rollbackmalaria. org/partnership/wg/wg_itn/docs/Yukich2007.pdf].
15. Roll Back Malaria:2010 Country Roadmaps.[http://www.rollbackmalaria.org/ rbmroadmaps.html].
16. Roll Back Malaria:Malaria Indicator Surveys.[http://www.malariasurveys.org]. 17. Macro International Inc:Measure DHS STATcompiler.[http://www.
measuredhs.com].
18. Mulligan J-A, Yukich J, Hanson K:Costs and effects of the Tanzanian national voucher scheme for insecticide-treated nets.Malar J2008,7:32. 19. Wiseman V, Hawley WA, Ter Kuile FO, Phillips-Howard PA, Vulule JM,
Nahlen BL, Mills J:The cost-effectiveness of permethrin-treated bed nets in an area of intense malaria transmission in western Kenya.Am J Trop Med Hyg2003,68:161-167.
20. Banek K, Kilian A, Allan R:Evaluation of Interceptor long-lasting insecticidal nets in eight communities in Liberia.Malar J2010,9:84. 21. Picado A, Das ML, Kumar V, Kesari S, Dinesh DS, Roy L, Rijal S, Das P,
Rowland M, Sundar S,et al:Effect of village-wide use of long-lasting insecticidal nets on visceral Leishmaniasis vectors in India and Nepal: a cluster randomized trial.PLoS Negl Trop Dis2010,4:e587.
22. Curtis CF, Maxwell CA, Magesa SM, Rwegoshora RT, Wilkes TJ: Insecticide-treated bed-nets for malaria mosquito control.J Am Mosq Control Assoc 2006,22:501-506.
23. Killeen GF, Smith TA, Ferguson HM, Mshinda H, Abdulla S, Lengeler C, Kachur SP:Preventing childhood malaria in Africa by protecting adults from mosquitoes with insecticide-treated nets.PLoS Med2007,4:e229.
24. Binka FN, Indome F, Smith T:Impact of spatial distribution of permethrin-impregnated bed nets on child mortality in rural northern Ghana.Am J Trop Med Hyg1998,59:80-85.
25. Howard SC, Omumbo J, Nevill C, Some ES, Donnelly CA, Snow RW:
Evidence for a mass community effect of insecticide-treated bednets on the incidence of malaria on the Kenyan coast.Trans R Soc Trop Med Hyg 2000,94:357-360.
26. Maxwell CA, Msuya E, Sudi M, Njunwa KJ, Carneiro IA, Curtis CF:Effect of community-wide use of insecticide-treated nets for 3-4 years on malarial morbidity in Tanzania.Trop Med Int Health2002,7:1003-1008.
27. Quinones ML, Lines J, Thomson MC, Jawara M, Greenwood BM:
Permethrin-treated bed nets do not have a‘mass-killing effect’on village populations of Anopheles gambiae s.l. in The Gambia.Trans R Soc Trop Med Hyg1998,92:373-378.
28. Hawley WA, Phillips-Howard PA, Ter Kuile FO, Terlouw DJ, Vulule JM, Ombok M, Nahlen BL, Gimnig JE, Kariuki SK, Kolczak MS, Hightower AW:
Community-wide effects of permethrin-treated bed nets on child mortality and malaria morbidity in western Kenya.Am J Trop Med Hyg 2003,68:121-127.
29. Gosoniu L, Vounatsou P, Tami A, Nathan R, Grundmann H, Lengeler C:
Spatial effects of mosquito bednets on child mortality.BMC Public Health 2008,8:356.
30. Beer N, Ali AS, de Savigny D, Al-Mafazy A-WH, Ramsan M, Abass AK, Omari RS, Bjorkman A, Kallander K:System effectiveness of a targeted free mass distribution of long lasting insecticidal nets in Zanzibar, Tanzania.
Malar J2010,9:173.
31. Eisele TP, Macintyre K, Yukich J, Ghebremeskel T:Interpreting household survey data intended to measure insecticide-treated bednet coverage: results from two surveys in Eritrea.Malar J2006,5:36.
32. Tami A, Mubyazi G, Talbert A, Mshinda H, Duchon S, Lengeler C:Evaluation of Olyset insecticide-treated nets distributed seven years previously in Tanzania.Malar J2004,3:19.
33. Cabrera OL, Diaz SP, Pareja P, Santamaria E:Acceptability and efficacy of long-lasting insecticidal nets Olyset (R) in a malaria endemic area of Colombia.Boletín de Malariología y Salud Ambiental2009,49:241-250. 34. Eisele TP, Larsen D, Steketee RW:Protective efficacy of interventions for
preventing malaria mortality in children in Plasmodium falciparum endemic areas.Int J Epidemiol2010,39:i88-i101.
35. Lengeler C:Insecticide-treated bed nets and curtains for preventing malaria.Cochrane Database of Systematic ReviewsChichester, UK: John Wiley & Sons, Ltd; 2004.
36. Bhatia MR, Fox-Rushby J, Mills A:Cost-effectiveness of malaria control interventions when malaria mortality is low: insecticide-treated nets versus in-house residual spraying in India.Soc Sci Med2004,59:525-539. 37. Eisele TP, Lindblade KA, Wannemuehler KA, Gimnig JE, Odhiambo F,
Hawley WA, Ter Kuile FO, Phillips-Howard P, Rosen DH, Nahlen BL,et al:
Effect of sustained insecticide-treated bed net use on all-cause child mortality in an area of intense perennial malaria transmission in western Kenya.Am J Trop Med Hyg2005,73:149-156.
38. World Health Organization:The global burden of disease: 2004 update Geneva: World Health Organization; 2008.
39. Hanson K, Kikumbih N, Armstrong Schellenberg J, Mponda H, Nathan R, Lake S, Mills A, Tanner M, Lengeler C:Cost-effectiveness of social marketing of insecticide-treated nets for malaria control in the United Republic of Tanzania.Bull World Health Organ2003,81:269-276. 40. De Allegri M, Marschall P, Flessa S, Tiendrebeogo J, Kouyate B, Jahn A,
Muller O:Comparative cost analysis of insecticide-treated net delivery strategies: sales supported by social marketing and free distribution through antenatal care.Health Policy Plan2010,25:28-38.
41. WHO Pesticides Evaluation Scheme:Guidelines for laboratory and field testing of long-lasting insecticidal mosquito nets. WHO/CDS/WHOPES/ GCDPP/200511.Geneva: World Health Organization; 2005 [http:// whqlibdoc.who.int/hq/2005/WHO_CDs_WHOPES_GCDPP_2005.11.pdf]. 42. WHO Pesticides Evaluation Scheme:Report of the thirteenth WHOPES
working group meeting, 28-30 July 2009. WHO/HTM/NTD/WHOPES/ 2009.5.[http://whqlibdoc.who.int/publications/2009/9789241598712_eng. pdf].
43. Erlanger TE, Enayati AA, Hemingway J, Mshinda H, Tami A, Lengeler C:Field issues related to effectiveness of insecticide-treated nets in Tanzania.
44. Hassan SE-DH, Malik EM, Okoued SI, Eltayeb EM:Retention and efficacy of long-lasting insecticide-treated nets distributed in eastern Sudan: a two-step community-based study.Malar J2008,7:85.
45. Binka FN, Mensah OA, Mills A:The cost-effectiveness of permethrin impregnated bednets in preventing child mortality in Kassena-Nankana district of Northern Ghana.Health Policy1997,41:229-239.
46. Yukich J, Zerom M, Ghebremeskel T, Tediosi F, Lengeler C:Costs and cost-effectiveness of vector control in Eritrea using insecticide-treated bed nets.Malar J2009,8:51.
47. Mulligan J-A, Yukich J, Hanson K:Costs and effects of the Tanzanian national voucher scheme for insecticide-treated nets.Malar J2008,7:32. 48. Marchant T, Schellenberg D, Nathan R, Armstrong-Schellenberg J,
Mponda H, Jones C, Sedekia Y, Bruce J, Hanson K:Assessment of a national voucher scheme to deliver insecticide-treated mosquito nets to pregnant women.Can Med Assoc J2010,182:152-156.
49. Armstrong Schellenberg J, Minja H, Mponda H, Kikumbih N, Mushi A, Nathan R, Abdulla S, Mukasa O, Marchant TJ, Tanner M, Lengeler C: Re-treatment of mosquito nets with insecticide.Trans R Soc Trop Med Hyg 2002,96:368-369.
50. Stevens W, Wiseman V, Ortiz J, Chavasse D:The costs and effects of a nationwide insecticide-treated net programme: the case of Malawi.
Malar J2005,4:22.
51. Becker-Dreps SI, Biddle AK, Pettifor A, Musuamba G, Imbie DN, Meshnick S, Behets F:Cost-effectiveness of adding bed net distribution for malaria prevention to antenatal services in Kinshasa, Democratic Republic of the Congo.Am J Trop Med Hyg2009,81:496-502.
52. WHO-CHOICE:Price multiplier for different coverage levels.Geneva: World Health Organization; 2003 [http://www.who.int/choice/costs/ price_multiplier].
53. Johns B, Baltussen R, Hutubessy R:Programme costs in the economic evaluation of health interventions.Cost Effectiveness and Resource Allocation2003,1:1.
54. Cohen J, Dupas P:Free Distribution or Cost-Sharing? Evidence from a randomized malaria prevention experiment.Quarterly J Econ2010,
125:1-45.
55. Grabowsky M, Nobiya T, Selanikio J:Sustained high coverage of insecticide-treated bednets through combined Catch-up and Keep-up strategies.Trop Med Int Health2007,12:815-822.
56. Clarke SE, Bogh C, Brown RC, Pinder M, Walraven GE, Lindsay SW:Do untreated bednets protect against malaria?Trans R Soc Trop Med Hyg 2001,95:457-462.
57. D’Alessandro U, Olaleye BO, McGuire W, Langerock P, Bennett S, Aikins MK, Thomson MC, Cham MK, Cham BA, Greenwood BM:Mortality and morbidity from malaria in Gambian children after introduction of an impregnated bednet programme.Lancet1995,345:479-483. 58. Mathanga D, Molyneux ME:Bednets and malaria in Africa.Lancet2001,
357:1219-1220.
59. Coleman PG, Perry BD, Woolhouse MEJ:Endemic stability - a veterinary idea applied to human public health.Lancet2001,357:1284-1286. 60. Askjaer N, Maxwell C, Chambo W, Staalsoe T, Nielsen M, Hviid L, Curtis C,
Theander TG:Insecticide-Treated Bed Nets Reduce Plasma Antibody Levels and Limit the Repertoire of Antibodies to Plasmodium falciparum Variant Surface Antigens.Clin Diagn Lab Immunol2001,8:1289-1291. 61. Lindblade KA, Eisele TP, Gimnig JE, Alaii JA, Odhiambo F, ter Kuile FO, Hawley WA, Wannemuehler KA, Phillips-Howard PA, Rosen DH,et al:
Sustainability of reductions in malaria transmission and infant mortality in western Kenya with use of insecticide-treated bednets: 4 to 6 years of follow-up.J Am Med Assoc2004,291:2571-2580.
62. Grabowsky M, Nobiya T, Ahun M, Donna R, Lengor M, Zimmerman D, Ladd H, Hoekstra E, Bello A, Baffoe-Wilmot A, Amofah G:Distributing insecticide-treated bednets during measles vaccination: a low-cost means of achieving high and equitable coverage.Bull World Health Organ2005,83:195-201.
doi:10.1186/1478-7547-10-5
Cite this article as:Pulkki-Brännströmet al.:Cost and cost effectiveness of long-lasting insecticide-treated bed nets - a model-based analysis.
Cost Effectiveness and Resource Allocation201210:5.
Submit your next manuscript to BioMed Central and take full advantage of:
• Convenient online submission
• Thorough peer review
• No space constraints or color figure charges
• Immediate publication on acceptance
• Inclusion in PubMed, CAS, Scopus and Google Scholar
• Research which is freely available for redistribution