A Novel Fragments-based Similarity
Measurement Algorithm for Visual Tracking
Jun Shanga,ca School of Computer Science and Technology, Huazhong University of Science and Technology, Wuhan, China Email: [email protected]
Chuanbo Chenb*, Hu Lianga, He Tangb and Mudar Saremb
b School of Software Engineering, Huazhong University of Science and Technology, Wuhan, China c College of Computer, Hubei University of Education, Wuhan, China
Email: *[email protected],
Abstract—Various adaptive appearance models have been proposed todeal with the challenges in tracking objects such as occlusions, illumination changes, background clutter, and pose variation. In this paper, first, we present a novel Fragments-based Similarity Measurement algorithm for object tracking in video sequence. Both the target and the reference are divided by multiple fragments of thesame size. Then, we find the similarity of each fragment with the overlapped smaller patches by comparing the average intensity value of the patches. The accuracy of the tracking results can be improved by adjusting the size of the patches. Finally we incorporate the global similarity measurement using two kinds of distances between them. This method encodes the color and the spatial information so that it can track non-rigid objects under complex scene. We use this coarse-to-fine method to get a balance between the accuracy and the computational cost. Extensive experiments are conducted to verify the efficiency and thereliability of our proposed algorithm in the realistic videos.
Index Terms—Visual tracking, appearance model, similarity measure
I.INTRODUCTION
Visual tacking plays an important role in many computer vision fields such as automatic surveillance, robotics, and human computer interaction. In real-world scenarios, the significant appearance variation remains a challenging problem due to factors such as illumination changes, background clutter, occlusion, varying viewpoints and poses [1]. The aim of tracking is to locate the target between consecutive frames that has the most similar appearance to the generative model.
Various adaptive appearance models have been proposed to overcome the previous challenges and difficulties. Some methods werebased on holistic models such as templates. A. D. Jepson et al. [2] presented a robust and adaptive appearance model to learn a motion-based tracking of natural objects. The fragment-motion-based
tracker introduced by A. Adam et al. [3] aimed to solve the partial occlusion problem by using a representation model based on the histograms of the local patches. In their method, the object was tracked by accumulating votes in the current frame and by comparing its histogram with the corresponding image patch histogram. However, these templates were fixed and the tracker might drift away from the target. I. Matthews et al. [4] developed a template update method which could reduce the drift problem by aligning with the first template. R. Chaudhry et al. [5] modeled the temporal evolution of the object’s appearance using a linear dynamical system to resolve the problem of tracking non-rigid objects. In order to deal with the pose and the illumination variations, J. Kwon and K. M. Lee [6] extended the particle filter and decomposed the observation models into multiple basic motion and observation models. Nevertheless, these holistic models could not well handle the partial occlusion.
The mean shift tracker [7] wasa popular method for its robustness to scaling, rotation, partial occlusions and efficient computation cost. However, it was confused when the object had similar color with the reference model. Shengfeng He et al. [8] computed a locality sensitive histogram and added a floating-point value to the corresponding bin for each occurrence of an intensity value. Although they considered the contributions of all the pixels, the construction of the integral histogram had a high computational cost. Y. Wu et al. [9] used a set of control points along the contour to describe the shape of the object. This was more accurate than other representations, but it performed poorly in clutter and it was general time-consuming. D. Ross et al. [10] constructed a low dimensional subspace by using an incremental representation method during the tracking process to account the appearance variation, whereas the tracker was less effective in handling heavy occlusion or non-rigid distortion. L. Cehovin et al. [11] combined the target’s global and local appearances by interlacing two layers. They removed and added parts to update their model through significant appearance changes during the tacking. G. Shu et al. [12] proposed a robust part-based
tracking-by-detection framework to address the occlusion and the changes in appearance. S. Hare et al.[13] introduced a new approach to learn the object model as a collection of binary basic functions which can be evaluated efficiently at the runtime.
Recently, sparse representation has been proposed in a framework of particle filter for object tracking. X. Mei and H. Ling [14] represented the candidate with a sparse linear combination for object templates and trivial templates. The tracking was implemented by solving the
l1 minimization problem. To decrease the computation cost of the minimization function, an efficient L1 tracker with minimum error bounded and occlusion detection was proposed by X. Mei et al.[15]. They discarded the irrelevant samples during the re-sampling. B. Liu et al. [16] introduced dynamic group sparsity into the sparse representation to enhance the robustness of the tracker. Instead of using fixed dictionary, X. Jia et al. [17] updated the dictionary adaptively with dynamic templates to reduce the drift problem. Finally, T. Zhang et al. [18] formulated the object tracking as a structured multi-task sparse learning problem. They considered the correlations among the particles and how to make the tracker fast.
Some ofthese previous methods used features such as color or contour to represent an object independently or jointly. However, when the object had similar color distribution as the background, the tracker might fail. Even though the representation of the contour might be more accurate than the color, but it performed poorly in the occlusions and the clutter. Although the sparse representations were popular in the recent years, but the computational cost of the matrix norm was time-consuming. Therefore, there is a need to get a balance between the accuracy and the speed of the tracker.
In this paper, our proposed method aims to resolve the appearance variation problem during tracking the object. We have considered a novel model for the similarity measurement that denoted by the local fragments similarity and the global similarity. The method encodes the color and the spatial information so that it can deal with the illumination change and the partial occlusion. The time complexity is a linear time in the number of the patches. The contributions of this work are summarized as follows:
First, the mean color values for the local smaller image patches are taken into consideration instead of holistic models. As for the similarity measurement of sub-regions, we have just used the ratio of the corresponding mean value with overlapped patches as the local similarity measurement, and this is different from the traditional methods that usually adopt the differences between the corresponding pixels as a distance metric.
Second, we have employed two kinds of distance to acquire the global similarity measurement based on the first step. We argue that these two stages of measurement improve the robustness of the tracking. Extensive experiments under different scenes have confirmed the accuracy and the efficiency of our tracker.
The rest of the paper is organized as follows: Section II gives an overview of our method. In Section III, we
describe the coupled-layer model for tracking. In section IV, we perform extensive experiments and analyze the results. Finally, the conclusions are drawn in section V.
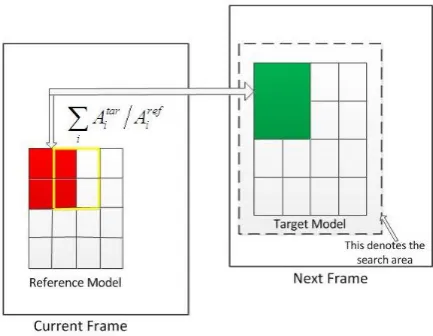
Figure 1.Illustrations of our fragments-based similarity measure for object tracking.
II. OVERVIEW OF OUR METHOD
The goal of our visual tracking algorithm is to find the most similar region between two consecutive frames. Let
R and T denote the reference in the current frame and the
target in the next frame respectively.The purpose of our tracker is to locate the target that is the most similar to the reference. In practice, such solution is implemented by dividing both R and T with multiple fragments of the
III. FRAGMENTS-BASED SIMILARITY FOR TRACKING
Images taken under different cases make the object takes on drastic appearances. Various previous tracking methods aimed to diminish this effect. Aforementioned methods used features such as color and contour to describe the object independently or jointly. In this section, we have described our model based on a novel fragment and integral similarity measurement. One important assumption for our model is that the object can be characterized by the distribution of the local patches without knowing all of its property. It is important to mention that we have used a coupled-layer model to search for the object instead of a singular holistic model. Also, we have divided the object and the reference into many fragments with the same size. Then, a local similarity metric is calculated by the ratio of the average of the intensity values within each patch between the corresponding areas. Finally, we have calculated an integral similarity with two kinds of distances. The region with the maximum value denotes the target.
A. Fragments Similarity Metric
We have used the chromatic color space directly to diminish the effect of the lost information. Let R and T
represent the detected reference object and the target respectively, we divide them into w*h fragments F1,
F2, . . .,Fw*h with the same size. To encode the spatial
layout of the target and make it robust against noise, we arrange two overlapped adjacent fragments denoted by
Fi’. Each Fi’ is represented by the average intensity of the pixels as it is written in the following Equation (1):
∑
∈ = ' , / )) , ( ), , ( ), , ( ( ) , , ( i F y x i i ii g b r x y g x y b x y N
r (1)
Where the triple
(
r
i,
g
i,
b
i)
represents the ith fragment,
)
,
(
x
y
r
,g
(
x
,
y
)
, andb
(
x
,
y
)
are the intensity values of the three channels at(
x
,
y
)
, and Ni is the total numberof pixels within Fi’. Next,we calculate the mean value of three channels as a descriptor of the patch. This can be expressed in the following equation (2):
Ai =(ri+gi+bi)/3 (2) Here, we have used only the arithmetic mean value for its simplicity and efficiency. Then, we get the fragments similarity by the ratio of the corresponding sub-areas. Let
Atar and Aref denote the overlapped patches of the object
and the reference respectively. If Atar is smaller than Aref,
then the similarity metric between them is given by the following equation (3):
ref i tar i patch
i A A
s = / (3)
However, in order to ensure that the metric value is bounded by zero and one, the similarity given by equation (3) will beAref / Atar if Aref is smaller than Atar. In
this way, our method is different from the traditional Sum of Squared Differences (SSD) in that it uses the ration rather than the intensity differences between the pixels. We argue that it is a feasible method for the measurement. For example, suppose at time t-1, t, t+1, Ai has three
different intensity values denoted by 100, 150, 200 respectively, we usually hold that the difference between 100 and 150 is as same as the difference between150 and 200, which is 50. Therefore, they have equal distances. But by using our new measurement, the similarity between 100 and 150 is 2/3, which is smaller than the similarity between 150 and 200 with 3/4. Furthermore, we use the mean value of the overlapped sub-regions instead of singular pixel to improve the ability against the noise. The template tracker requires strict pixel-wise alignment between the target region and the reference template. This performs well in handing rigid objects, while have a poor discriminative power for the non-rigid objects. Also, we avoid using popular color histogram because it makes an inefficient representation when there are several homogeneous sub regions. However, our method combines the local variations of the appearance and the spatial information by overlapped patches, thus integrating the advantage of both of them.
B. Global Similarity Measurement
After getting the local similarity measurements Si , we
now search for the target in the next frame. To this end, we pick M rectangles with the same size of the reference
around it denoted by Rj (j=1,…M). Each rectangular
region is calculated for the fragments similarity according to the first stage, and then the integral similarity is calculated in two kinds of distances: the cosine distance and the Euclidean distance.
Let N denote the number of the overlapped patches.
Note that it is larger than the number of the fragments. In our experiments the patches are overlapped with half of the fragments, so we can denote that N equals to (2row
-1)*(2col-1), where row and col are the rows and the
columns of the fragments respectively. As it will be seen in section IV, the different sizes of row and col have
impact on the tracking results. We seek a balance of efficiency and accuracy between them by adjusting the parameters in our experiments. Then, we can represent the candidate as a vector [ 1 , 2 ,... npatch]
patch patch
s s s
V = and
the reference as another vector V'=[11,,...1]with the same dimension as V. Note that we have used this horizontal
constant vector to represent the reference. Let rect j
S denote
jth rectangle of the candidates (j=1,...,M). Next, we use
two kinds of distance metrics as the similarity measurement for the two vectors.
Our first method is the Cosine distance presented in the following equation (4):
N s s V V VV S N i i N i i rect j
∑
∑
= = = = 1 2 1 '' (4)
And our second method is the Euclidean distance presented in the following equation (5):
2 / 1 1 2 ) ( 1 1 ⎥ ⎦ ⎤ ⎢ ⎣ ⎡ − − =
∑
= N i patch i rectj s c
N
Given these two kinds of distance measurements, we can formalize the visual tracking as a search region over the maximum metric. The region with the maximum metricdenotes the target in the consecutive frames. Note that the time complexity is O(N) and O(M) for the first
stage and the second stage respectively, so the computation cost of the algorithm is O(N*M).
C. Adaptive Scale Space
The scale of an object usually changes during the tracking. If we use fixed rectangle to denote the object, it may drift away from the true position when the size of the object changes. To avoid this drift problem, we use different sizes as templates. In our method, we compare the candidates with three scales. The larger one is 1.1 times size of the reference and the smaller one is 0.9 times size of the reference. According to the above analysis, the time complexity will be O(3N*M) in this
case. Then, we calculate the similarity under these three
scales respectively. Given these scales, we can formalize the visual tracking as a search region over the scale space that maximizes the similarity of the rectangular region at time t.
Consequently, in Algorithm 1 which is shown below, we present a detailed description of our fragments-based similarity measurement algorithm for object tracking.
Algorithm 1: Fragments-based tracking
Input: Frame I(k), fragments width w, fragments height h.
Output: The mean value for the object, the mean value
for the reference, the fragments similarity, and the global similarity (i. e.
,
,
patch,
i ref i tar
i
A
s
A
S
rectj ).1. Sample a set of candidate rectangles around the object.
2. For each candidate rectangle do 3. For each overlapped patches do
(a) Calculate the mean value of three channels by using equation (1) and (2) for the object and the reference respectively (i. e. tar
i
A
, refi
A
). (b) Calculate the fragments similarity patchi
s
by using equation (3).4. end for
5. Calculate the global similarity rect j
S
under three scales by using equation (4) and (5) for the Cosine distance and the Euclidean distance respectively.6. end for
7. Search for the maximum metric to locate the object.
IV.EXPERIMENTAL RESULT
We have tested the effectiveness of our method by using a number of video sequences with different environments. In our experiment in this paper, we have used MATLAB2012a as programming tool and assumed that the initial position of the object has been known. Our tracker was implemented in MATLAB on a Pentium(R) Dual-Core E5700 3.00GHz with 4GB RAM. We have divided the object into four different sizes and recorded
the tracking time. A tracking success rate is used for the evaluation criteria. Let (( ))
g t
g t
R R area
R R area
∪ ∩
denote the overlap ratio, where Rt and Rg are the bounding boxes of the
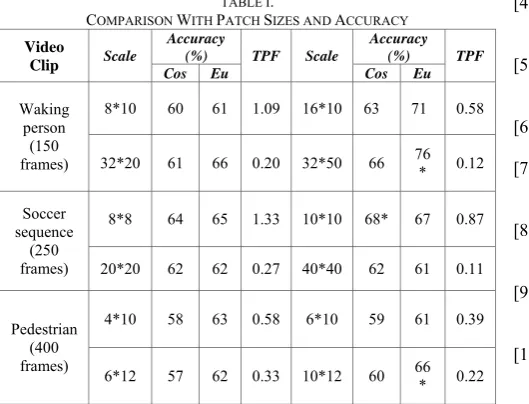
tracker and the ground-truth, respectively. We argue that the tracking result of the current frame is a success when the overlap ration is larger than 0.5. The comparison of different sizes of the patches and the tracking time are shown in Table I.
A. Illumination and Pose Change
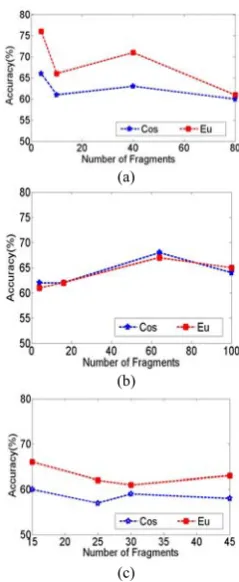
In the first experiment we have used the walking sequences in an outdoor environment with illumination and poses changes. The whole image size is 640*480, while the image size of the tracking person is about 64*100. We have divided the person image into four images of sizes 8*10, 16*10, 32*20, and 32*50. Next, we have picked 15*15=225 rectangles around the object (i. e. the person) and calculate the similarity by two kinds of distances. As we can see from table I, in the case of the four images (i. e., 8*10, 16*10, 32*20, and 32*50), the accuracy in the Euclidean distance are 61%, 71%, 66%, and 76% respectively. While, the accuracy in the Cosine distance are 60%, 63%, 61%, and 66% respectively. Thus, according to these experimental results, the Euclidean distance measure performs better than the Cosine distance. The tracking results with Euclidean distance are shown in Fig.2. Also, from the result presented in Table I, we note that when the object is divided by the bigger sizes of patches, the accuracy is higher than the others. For the pose variations, bigger sizes of patches make one part of the person drop into the same regions at a higher probability than smaller sizes, and this improves the tracking accuracy. Meanwhile, as we can see from table I, in the case of the four images (i. e., 8*10, 16*10, 32*20, and 32*50), the average tracking seconds per frame (TPF) values are 1.09, 0.58, 0.20, and 0.12 respectively. Thus, the TPF values presented in table I show that the bigger sizes of the patches need less computational times than the smaller sizes. Fig. 5(a) shows the detailed comparison for the walking person.
B. Clutter
player. We have used the mean intensity value to decrease the effect of the noise. Furthermore, as we can see from table I, in the case of the four images (i. e. 8*8, 10*10, 20*20, 40*40) the average tracking seconds per frame (TPF) values are 1.33, 0.87, 0.27, and 0.11 respectively. The smaller scale we use, the more numbers of fragments we need. Thus occupies more computational time. However, this indicates that the increment of the average tracking time is slower than the increment of the number for the searched fragments. Fig. 5(b) shows the detailed comparison for the soccer sequence.
C. Partial Occlusion
In the third experiment a challenge pedestrian sequence with partial occlusion is used. The full image size is 352*288 and the image of the person is about 30*60 . We have divided the object into four images of sizes 4*10, 6*10, 6*12, and 10*12. The tracking results are shown in Fig.4. In this experiment, 100 rectangles are used around the walking woman. As we can see from table I, in the case of the four images (i. e., 4*10, 6*10, 6*12, and 10*12), the accuracy in the Euclidean distance are 63%, 61%, 62%, and 66% respectively. While, the accuracy in the Cosine distance are 58%, 59%, 57%, and 60% respectively. This shows that the results of the Euclidean distance measure are better than the results of the Cosine distance. We note that by exploiting a moderate number of regions, the relative spatial information is maintained, and thus the partial occlusion is well resolved. When the woman passes through the white car and blue car, our tracker can locate her correctly. Tracking drift usually occurs when the target is heavily occluded. From these results, we can see that our method has the ability to recover tracking drift since only some sub-regions have influence on the results. Also, as we can see from table I, in the case of the four images (i. e., 4*10, 6*10, 6*12, and 10*12), the average tracking seconds per frame (TPF) values are 0.58, 0.39, 0.33, and 0.22 respectively.Therefore, the TPF values presented in table I show that the speed of this tracker with the bigger sizes of the patches is higher than the smaller sizes of the patches. Fig. 5(c) shows the detailed comparison for the pedestrian.
Figure 2. Tracking results of the outdoor walking person. Frames 20, 46, 80 and 85 are displayed
Figure 3. Tracking results of the player’s header. Frames 5, 15, 50 and 65 are displayed
Figure 4. Tracking results of the pedestrian with partial occlusion. Frames 125, 158, 180 and 225 are displayed
(a)
(b)
(c)
Figure 5. Detailed comparisons of the three video sequences. The x-axis shows the number of the fragments.
TABLE I.
COMPARISON WITH PATCH SIZES AND ACCURACY
Video
Clip Scale
Accuracy
(%) TPF Scale
Accuracy (%) TPF
Cos Eu Cos Eu
Waking person
(150 frames)
8*10 60 61 1.09 16*10 63 71 0.58
32*20 61 66 0.20 32*50 66 76* 0.12
Soccer sequence
(250 frames)
8*8 64 65 1.33 10*10 68* 67 0.87
20*20 62 62 0.27 40*40 62 61 0.11
Pedestrian (400 frames)
4*10 58 63 0.58 6*10 59 61 0.39
6*12 57 62 0.33 10*12 60 66* 0.22
TPF denotes the average tracking time per frame.Cos denotes Cosine distance. Eu denotes Euclidean distance. The (.)* denotes the best resultfor each sequence.
V.CONCLUSIONS
In this paper, we have proposed a novel coarse-to-fine fragments-based similarity measurement for object tracking. Both the target and the template are divided by smaller sub-areas with the same size. The local similarity is calculated by ratio of the mean intensity value with overlapped patches. Finally, we get the global similarity by using two different kinds of distance metric. In this method, we have considered both the spatial and the intensity information, so it can deal with pose variation, clutter and partial occlusion.
Since the appearance of the object varies during tracking, our method is sensitive to parameters such as the size of the patches, the number of the searched rectangles, and the initial actual position of the object. Finally, we have implemented extensive experiments to improve the accuracy and the efficiency of our method by adjusting the parameters manually. In the future, we will make efforts to improve the robustness for better adaptive parameters.
ACKNOWLEDGMENT
This work was supported in part by Ph.D. Programs Foundation of Ministry of Education of China (No.20120142120110), and supported in part by Hubei Provincial Natural Science Foundation of China (No.2013CFB152) and Hubei Provincial Committee of Education Foundation (No.B2014010).
REFERENCES
[1] E. Maggio and A. Cavallaro, Video tracking: theory and practice, New York: Wiley, 2011.
[2] A. D. Jepson, D. J. Fleet, and T. F. E. Maraghi, “Robust on-line appearance models for visual tracking,” IEEE Trams. PAMI, vol. 25, no. 10, pp. 1296-1311, 2003.
[3] A. Adam, E. Rivlin, and I. Shimshoni, “Robust fragments-based tracking using the integral histogram,” in Proc. IEEE Int. Conf. CVPR, 2006, pp. 798-805.
[4] I. Matthews, T. Ishikawa, and S. Baker, “The template update problem,” IEEE Trans. PAMI, vol. 26, no. 6, pp.
810-815, 2004.
[5] R. Chaudhry, G. Hager, and R. Vidal, “Dynamic template tracking and recognition,” IJCV, vol. 105, no. 1, pp. 19-48,
2013.
[6] J. Kwon and K. M. Lee, “Visual tracking decomposition,” in Proc. IEEE Int. Conf. CVPR, 2010, pp. 1269-1276.
[7] D. Comaniciu, V. Ramesh, and P. Meer, “Kernel-based object tracking,” IEEE Trans. PAMI, vol. 25, no. 10, pp.
564-575, 2003.
[8] S. F. He, Q. X. Yang, R. W. H. Lau, J. Wang, and M. H. Yang, “Visual tracking via locality sensitive histograms,” in Proc. IEEE Int. Conf. CVPR, 2013, pp. 2427-2434.
[9] Y. Wu, G, hua, and T. Yu. “Switching observation models for contour tracking in clutter,” in Proc. IEEE Int. Conf. CVPR, 2003, pp. 295-304.
[10]D. Ross, J. Lin, R, S, Lin, and M. H. Yang, “Incremental learning for robust visual tracking,” IJCV, vol. 77, no. 1,
pp. 125-141 ,2008.
[11]L. Cehovin, M. Kristan, and A. Leonardis, “Robust visual tracking using an adaptive coupled-layer visual model,”
IEEE Trans. PAMI, vol. 35, no. 4, pp. 941-953, 2013.
[12]G. Shu, A. Dehghan. O. Oreifej, E. Hand, and M. Shah, “Part-based multiple-person tracking with partial occlusin handing,” in Proc. IEEE Int. Conf. CVPR, pp. 1815-1821,
2012.
[13]S. Hare, A. Saffari, and P H. S. Torr, “Efficient online structured output learnig for keypoint-based object tracking,” in Proc. IEEE Int. Conf. CVPR, 2012, pp.
1894-1901.
[14]X. Mei and H. Ling, “Robust visual tracking using l1
minimazation,” in ICCV, 2009, pp.1436-1443.
[15]X. Mei, H. Ling, Y. Wu, E. Blasch, and L. Bai, “Minimum error bounded efficient l1 tracker with occlusion
detection,” in Proc. IEEE Int. Conf. CVPR, 2011, pp.
1257-1264.
[16]B. Liu, L. Yang, J. Huang, P. Meer, L. Gong, and C. Kulikowski, “Robust and fast collaborative tracking with two stage sparse optimization,” in ECCV,2010, pp. 1-14.
[17]X. Jia, H. C. Lu., and M. H. Yang, “Visual tracking and adaptive structural local sparse appearance model,” in
Proc.IEEE Int. Conf. CVPR, 2012, pp. 1822-1829.
[18]T. Zhang, B. Ghanem, S. Liu, and N. Ahuja, “Robust visual tracking via structured multi-task sparse learning,” in Proc.IEEE Int. Conf. CVPR, 2012, pp. 2042-2049.
Chuanbo Chen is currently a Professor and Dean of the Software College, Huazhong University of Science And Technology, Hubei, China. He was a Professor and Researcher on image processing and software engineering, and a Research Leader in many projects such as national projects, local government projects, and the enterprise projects. He has published more than 200 academic papers. His current research interests include image processing and pattern recognition.