Fetal and Infant Encephalisation
by
Tracey H elene Joffe
A thesis subm itted for the degree o f D octor o f Philosophy (Ph.D.)
at U niversity College London, U niversity o f London.
ProQuest Number: 10015064
All rights reserved
INFORMATION TO ALL USERS
The quality of this reproduction is dependent upon the quality of the copy submitted.
In the unlikely event that the author did not send a complete manuscript and there are missing pages, these will be noted. Also, if material had to be removed,
a note will indicate the deletion.
uest.
ProQuest 10015064
Published by ProQuest LLC(2016). Copyright of the Dissertation is held by the Author.
All rights reserved.
This work is protected against unauthorized copying under Title 17, United States Code. Microform Edition © ProQuest LLC.
ProQuest LLC
789 East Eisenhower Parkway P.O. Box 1346
A B S T R A C T
This thesis exam ines the relationship betw een growth, nutritional status, body
com position and encephalisation in healthy fetuses and infants up to one year-of-age. It
also com pares hum an fetal brain and body grow th patterns to those o f baboons, rhesus
m onkeys and com m on m arm osets, and assesses w hether sex differences in
encephalisation are present in these species during early life.
A longitudinal in vivo study was undertaken w here ultrasound m easures o f fetal biom etry
and anthropom etric m easures o f infant biom etry provided the basis for quantifying
encephalisation and growth. H ead circum ference in early life w as used as a proxy for
brain size. In hum ans, skinfold thickness m easures provided an index o f nutritional
status. The im pact o f m aternal size, nutritional status and life history param eters w ere
also considered in light o f hum an offspring encephalisation, and the relationship betw een
placenta w eight and placental notching and offspring encephalisation w as assessed. The
effects on offspring encephalisation o f m aternal sm oking and alcohol use during
pregnancy w ere also exam ined and the im plications o f encephalisation for m aternal-fetal
conflict theory w ere considered. The relationship betw een the relative size o f the brain
and that o f the other m ajor organs was exam ined using fetal autopsy organ w eight
m easures.
The results dem onstrated that intraspecific variation in encephalisation w as m arked in
early life. A t this tim e encephalisation w as phenotypically flexible, w ith encephalisation
SD scores undergoing regression to the m ean over time. U pw ard or dow nw ard centile
shifting in encephalisation related to previous head circum ference size and growth. W hen
‘catch u p ’ grow th in head circum ference occurred, corresponding ‘catch dow n’ grow th in
body length occurred, characterising a trade-off in periodic increased grow th betw een the
brain and body. Encephalised neonates tended to be generally w ell-nourished w ith high
fat and lean tissue deposits and relatively large non-brain organs. H um an m others who
produced encephalised offspring had relatively large placentas w ith few placental notches.
M aternal nutritional status further explained a significant but small am ount o f the
decreased neonatal encephalisation and m aternal alcohol use w as show n to correlate w ith
decreased head circum ference growth.
H um an fetal and infant m ales had relatively larger head circum ferences than females
(after controlling for body length differences betw een the sexes), w ith the degree o f
sexual dim orphism increasing over time. N on-hum an prim ate fetal encephalisation
sexual dim orphism w as also present but o f a very low m agnitude. The m etabolic costs
associated w ith hum an fetal and infant encephalisation sexual dim orphism w ere
calculated to be low and did not represent a m ajor additional energetic burden to the fetus
or mother.
H um an fetal brain grow th differed from that o f baboons, rhesus m onkeys and m arm osets
in being extended during both the hyperplasic and hypertrophic grow th periods. Like the
non-hum an prim ates, fetal brain growth began to slow in utero, but this occurred later in
gestation in hum ans. D ata from the literature show ed that hum ans, cetaceans and
pinnipeds differed from vertebrates in general in their increased body fatness w hich was
associated w ith increased encephalisation.
A C K N O W LE D G E M E N TS
I am deeply grateful to m y two supervisors w ithout w hom I w ould not have been able to
produce this thesis. Dr. Jonathan W ells (Institute o f Child H ealth, UCL) oversaw aspects
o f body com position, grow th and energetics. Prof. Leslie A iello (D epartm ent o f
A nthropology, U CL) oversaw aspects o f prim ate evolution and encephalisation. M y
sincerest thanks to both o f them for their unerring patience, guidance, and m ultiple
readings and corrections to the m anuscript.
The statistical m ethods used here w ere form ulated w ith the invaluable help o f Prof.
Tim othy Cole w ho provided solutions to, at tim es, w hat felt like m ethodological
conundrum s. I am indebted to him for his help and advice.
I have been extrem ely fortunate in being able to study data that w as painstakingly
collected by a num ber o f researchers. W ithout these data, this project could not have been
carried out.
D r s. M ichael G eary and Peter H indm arsh and Prof. Charles Rodeck very kindly allow ed
m e to analyse the data collected as part o f their study on fetal and infant growth. The
study w as undertaken at U niversity College London H ospitals under the D epartm ent o f
O bstetrics and G ynecology and the Center for Paediatric Endocrinology. This data has
been crucial for this thesis and I am greatly indebted to them . Peter H indm arsh also spent
a good deal o f tim e w ith me, explaining the significance o f the m easures taken as part o f
the study, and som e o f their im plications for growth.
M any thanks to Dr. A lice Tarantal at the California N ational Prim ate Research Center for
providing m e w ith data on fetal and infant biom etric m easures in rhesus m onkeys. M y
thanks too for hosting m e at the center and providing m e w ith countless crucial papers on
grow th and a dem onstration o f ultrasound m easurem ent in her subjects.
Sincere thanks to D r s. K aren Rice and M ichelle Leland at the Southw est Foundation for
Biom edical Research. Drs. R ice and Leland provided m e w ith a w ealth o f ultrasound data
Prim ate C enter w ho shared her ultrasound and anthropom etric data in com m on
marm osets.
I am also very grateful to Dr, M ichael Fishbein o f the D epartm ent o f Pathology at U C LA
(U niversity o f C alifornia Los A ngeles), who granted m e access to the autopsy records
com piled b y the hospital. These data provided the basis for a m ajor analysis in this thesis.
D uring the course o f m y Ph.D ., m any people provided advise and guidance, w hile others
provided m uch needed m oral support. M y thanks go to R obin Dunbar, R oger Gorski,
Steve Gould, M ark H anson, Louise Hum phrey, Elizabeth Isaacs, N athan Jeffrey, Cathy
Key, M argaret Lawson, A lan Lucas, A ndrew Prentice, Jaroslav Stark, Sim on Strickland,
V olker Summer, Peter Thoroughgood, Jane W illiam s and John Wyatt. I am also very
grateful to m y fam ily and friends for their constant encouragem ent and support.
I have been very fortunate in receiving an Overseas R esearch Studentship and a first-year
departm ental bursary from the A nthropology departm ent at UCL. I also received a travel
grant from U niversity College London to support m y data collection at U C LA and the
CNPRC. I m ust express m y sincerest gratitude to m y father who provided a great deal o f
financial support during m y Ph.D. W ithout his help I could not have com pleted a
doctorate.
Finally, thank you to everyone at the M RC C hildhood N utrition Research Center at the
Institute o f Child H ealth and to Jonathan W ells, in particular, for m aking m e so w elcom e
TABLE OF CONTENTS
List of tables 12
List of figures 20
Appendix 407
Tables 407
Endnotes 433
Bibliography 439
CHAPTER 1 Introduction
1.1 Aims of thesis 27
1.2 Brief outline of chapter 1 28
SECTION I: Encephalisation
1.3 The encephalisation quotient 28
1.4 Primate encephalisation relative to other vertebrates 30 1.5 Human encephalisation relative to other primates 34
SECTION II: Metabolic costs of encephalisation
1.6 Energetic costs o f encephalisation 41
1.6a Fetal and infant encephalisation 46
1.7 Implications of encephalisation for this thesis 50
1.8 The first law of thermodynamics 50
1.9 Summary of contents of subsequent chapters 51
CHAPTER 2
Patterns of fetal and infant body growth
2.1 Aims of chapter 53
SECTION I: Fetal and infant growth
2.2 Body growth 53
2.2a Fetal growth 54
2.2b Changes in chemical composition during fetal growth 56
2.2c Infant growth 57
2.2d Changes in chemical composition during infant growth 59
2.3 Sex differences in growth patterns 62
2.4 Influences on growth and body composition in fetal life 63
2.4a Genetic and hormonal factors 63
2.4b Maternal influences on fetal growth 65
2.5 Influences on growth and body composition in infancy 67
2.5a Nutrition 67
2.5b Illness and disease 69
2.5d Environmental factors 70
2.6 Energetic costs of growth 72
2.6a Costs of growth in infancy 72
2.6b Modeling the costs of growth in the fetus 73 2.7 Human growth in comparison to non-human primate growth 76
SECTION U: Quantifying growth
2.8 Previous work quantifying human growth 86
2.8a Fetal growth references 86
2.8b Infant growth references 88
2.9 Methods for measuring size 89
2.9a Fetal size measures 89
2.9b Infant size measures 95
2.10 The data 95
2.10a Human data 95
2.10b Non-human primate data 107
i Rhesus macaque data 107
ii Baboon data 110
iii Common marmoset data 113
2.11 Models for quantifying growth 115
2.11a The LMS method and standard deviation scores 115
SECTION III: Growth and growth velocity curves
2.12 The human fetal and infant growth curve 119
2.12a Human growth velocity 121
2.12b Sex differences in growth curves 124
2.13 Non human primate fetal growth curves 129
2.13a Rhesus macaque 129
2.13b Baboons 132
2.13c Common marmoset 132
2.14 Comparison of human and non-human primate fetal growth curves 135
2.15 Non-human primate growth velocities 138
2.15a Sex differences in non-human primate growth velocities 138
2.16 Variation in growth trajectories 139
2.17 Discussion 139
CHAPTER 3
Patterns of fetal and infant brain growth
3.1 Aims of chapter 147
SECTION I: The brain in early life
3.2 Brain growth 147
3.3 Brain sparing 152
3.4 Fatness and brain size 154
3.5 Changes in brain chemical composition during growth 156
SECTION H: Quantifying and comparing brain growth across species
3.7 Previous work quantifying brain growth 163
3.7a Brain growth in humans 163
3.7b Non-human primate fetal brain growth 165
3.8 Methods for comparing brain growth between species 165
3.9 Fetal head circumference growth curves 167
3.10 Delayed inflection in human head circumference growth curve 176 3.10a Possible hypertrophic brain growth effects 176
3.10b Possible allometric effects 179
3.10c Possible gestation length effects 182
3.11 Discussion 185
CHAPTER 4
Fetal and infant size, growth and encephalisation
4.1 Aims of chapter 187
4.2 Main hypotheses tested in chapter 187
SECTION I: Size, growth, nutritional status and encephalisation
4.3 Methods 188
4.3a Quantifying encephalisation in the fetus and infant 189
i Encephalisation SD scores 191
4.3b Quantifying growth in the fetus and infant 193
i Change in SD score 193
ii Thrive in growth 193
iii ‘Catch up’ and ‘catch down’ growth 194 4.3c Quantifying nutritional status in the neonate 194
i Benn index 195
ii Skinfold thickness 196
iii Nutritional status SD scores 197
4.3d Statistical tests 201
4.4e Tertiles 201
4.4 Results 203
4.4a Size and encephalisation 203
4.4b Growth and encephalisation 211
i Body length growth and encephalisation 211
ii Head circumference growth and encephalisation 211
iii Thrive in growth and encephalisation 212
4.4c Nutritional status and size, growth and encephalisation 218
i Nutritional status and size 218
ii Nutritional status and growth 218
iii Nutritional status and encephalisation 221 4.4d Body length and head circumference effects on encephalisation 223
4.4e Changes in encephalisation during growth 228
4.5 Discussion 236
4.6 Brain size sexual dimorphism 238 4.7 The Fetal/Infant Brain Size Sexual Dimorphism Hypothesis 239 4.8 Methods for quantifying brain size sexual dimorphism in the fetus and infant 240
4,8a Statistical tests 241
4,8b Quantifying the effects of sex on fetal and infant encephalisation 242
4.9 Results 242
4,9a Human head circumference sexual dimorphism 242 4,9b Rhesus macaque head circumference sexual dimorphism 249 4,9c Baboon head circumference sexual dimorphism 253 4,9d Common marmoset head circumference sexual dimorphism 253
4.10 Discussion 257
SECTION III: Energetic costs of encephalisation sexual dimorphism
4.11 Modeling the metabolic costs of encephalisation sexual dimorphism 259
CHAPTER 5
Maternal correlates of fetal and infant size, growth and encephalisation
5.1 Aims of chapter 262
5.2 Hypotheses tested in chapter 262
SECTION I: Maternal adaptations to pregnancy
5.3 Physiological adaptations to pregnancy 263
5,3a Hematologic changes 263
5,3b Cardiovascular changes 264
5,3c Respiratory changes 266
5,3d Renal changes 266
5,3e Gastrointestinal changes 267
5,3f Hepatic changes 267
5,3g Metabolic changes 268
i Carbohydrate metabolism 270
ii Protein metabolism 270
iii Fat metabolism 271
5.4 Maternal influences on offspring size and growth 272
5,4a Maternal Nutrition Hypothesis 274
5,4b Placenta Hypothesis 274
SECTION II: Methodology
5.5 Maternal data 275
5.6 Indices of maternal nutritional status 289
5.7 Quantifying maternal size and nutritional status 289
5.8 Statistical tests 290
SECTION III: Results
5.9 Results of analyses 293
5,9a Relationship between maternal nutritional status and offspring size and
encephalisation 293
5.9c Relationship between placental variables and offspring encephalisation and
growth in encephalisation 316
5.10 Tertiles 322
5.11 Relationship between maternal variables and offspring head circumference and body
length 329
5.12 Combined influences of maternal and neonatal variables on neonatal
encephalisation 332
5.13 Discussion 336
SECTION IV: Martin’s ‘Maternal Energy Hypothesis’
5.14 Maternal Energy Hypothesis 339
5.15 Problems with assumptions of the hypothesis 339
5.15a Maternal BMR 340
5.15b BMR and brain and body weight 340
5.15c Body composition variation in vertebrates 343
5.15d Kleiber and Brody’s equations 343
5.16 Discussion 345
CHAPTER 6
Relationship of encephalisation to the relative size of other organs
6.1 Aims of the chapter 347
6.2 Hypothesis tested in chapter 347
SECTION I: Organ growth
6.3 Patterns of organ growth in humans 348
6.4 Patterns of organ growth in rhesus monkeys 352
6.5 Relative organ size in human fetuses 355
6.6 Sex differences in human fetal organ weights 355
6.7 Relative organ size in rhesus monkey fetuses 358
6.8 Organ phenotypic flexibility 361
6.8a Organ conservation and size decrease during malnutrition 362
6.9 Organ trade-off hypothesis 363
6.10 Aiello and Wheeler’s Expensive Tissue Hypothesis 363
SECTION H: Methodology
6.11 Human fetal autopsy data 364
6.12 Quantifying relative organ weights 369
6.13 Quantifying a trade-off in size between the brain and other organs 374
6.14 Statistical tests 374
SECTION IE: Results
6.15 Results o f analyses 375
6.16 Discussion 381
CHAPTER 7
7.1 Summary of new findings 3 83
1. Fetal growth curve 383
2. Costs of brain growth 385
3. Body fatness and encephalisation 385
4. Fetal and infant encephalisation 386
5. Neonatal nutritional status and encephalisation 387 6. Relative brain size sexual dimorphism in the fetus and infant 388 7. Maternal influences on offspring encephalisation 389 8. Relative size of fetal brain and non-brain organs 391
7.2 Implications for the Trivers-Willard Effect 391
7.3 Male encephalisation as an adaptation 392
7.4 Encephalisation and intelligence 395
7.4a Studies in support of a relationship 395
7.4b Studies negating a relationship 396
7.5 Implications for life-history theory 398
7.5a Fetal programming and malnutrition 402
LIST OF TABLES
1.1 Order-specific least squares regressions calculated from brain weight
and body weight data in vertebrates 33
1.2 Residual brain weight measures and encephalisation quotients (EQ)
calculated from infra-order specific regression equations 40
1.3 Organ metabolic rate and organ size in adult humans: relationship to
basal metabolic rate 43
1.4 Human brain size and energy requirement relative to body weight and BMR
at different stages of growth 43
1.5 Percentage contribution of various organs to the body weight o f man 44
1.6 Contribution of different organs and tissues to body weight and basal metabolic
rate in the reference male, reference female, and an infant 45
1.7 Least squares residuals derived from plotting logio-transformed
brain weight against body weight in primate neonates 49
2.1 Weekly increment in water, lipid, protein and carbohydrates and other
undetermined body constituents 57
2.2 Body composition of the reference male infant 61
2.3 Ratio of protein weight to water weight in a number o f body components 61
2.4 Energy costs of growth during infancy 74
2.5 Estimated costs of fetal growth 75
2.6 Proportion of lifespan spent as an infant, juvenile and adult in primates 79
2.7 Acoustic impedance values 91
2.8 Age at which anatomical landmarks can be detected using ultrasound
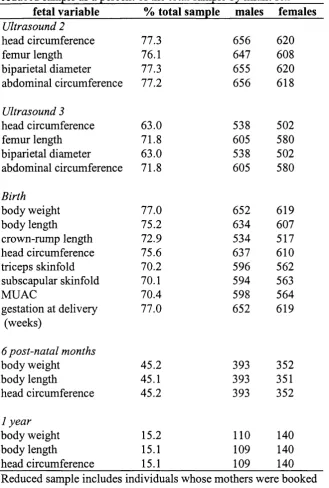
2.9 Percent o f total sample for which prenatal and postnatal measures were taken
and sample sizes for each measure, as a function of fetal sex 98
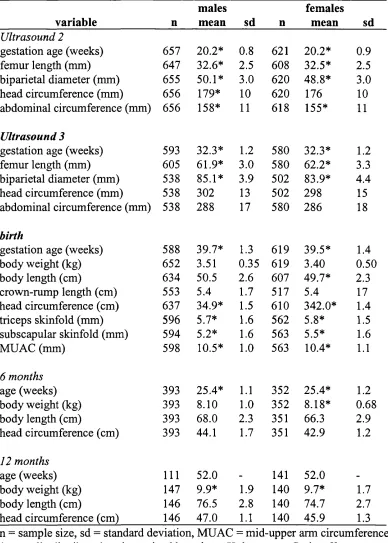
2.10 Descriptive statistics for fetuses in the total sample at ultrasounds 2 and 3 100
2.11 Descriptive statistics for neonates and infants in the total sample 100
2.12 Frequency of measures for fetal and infant variables in the reduced sample
as a percent o f the total sample by infant sex 103
2.13 Descriptive statistics in reduced sample 104
between the sexes in the reduced fetal sample 105
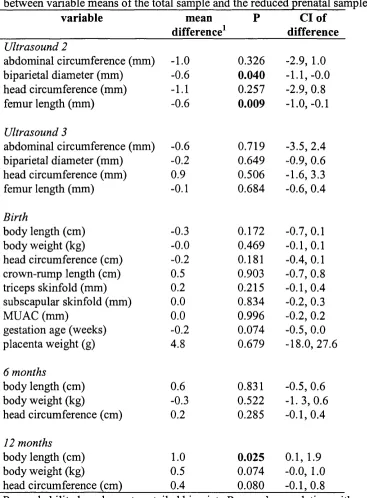
2.15 Independent sample t-tests comparing the difference between
variable means of the total sample and the reduced prenatal sample 106
2.16 Descriptive statistics for rhesus monkey mothers 108
2.17 Descriptive statistics for rhesus monkey fetuses 108
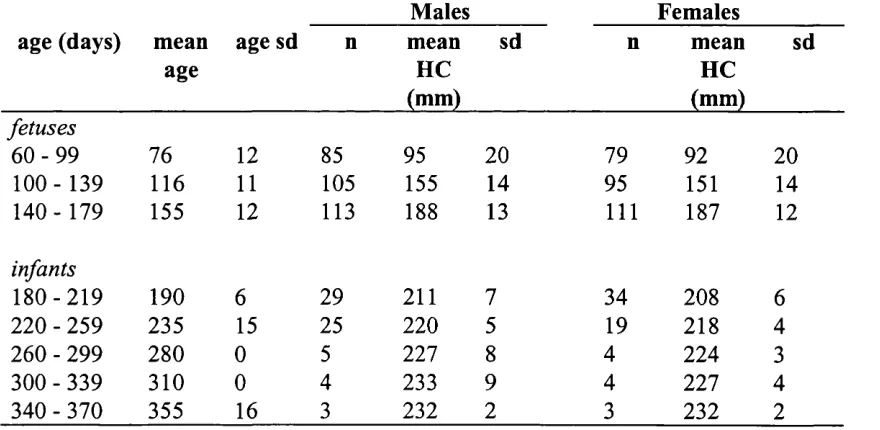
2.18 Means, standard deviations and sample sizes for head circumference
in males and females in the rhesus monkey sample 108
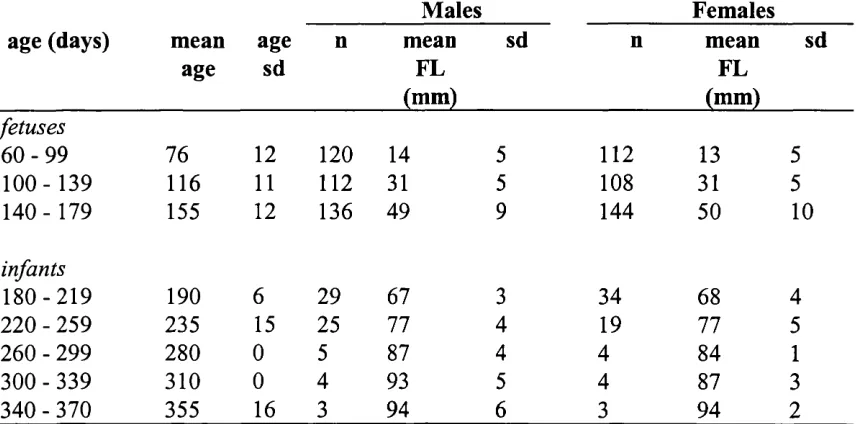
2.19 Means, standard deviations and sample sizes for femur length in males and females
in the rhesus monkey sample 109
2.20 Descriptive statistics for baboon mothers in sample 111
2.21 Descriptive statistics for fetal baboons 111
2.22 Means, standard deviations and sample sizes for head circumference in
males and females in the fetal baboon sample 112
2.23 Means, standard deviations and sample sizes for femur length in males and
females in the fetal baboon sample 112
2.24 Descriptive statistics for marmoset mothers in sample 114
2.25 Descriptive statistics for fetal marmosets 114
2.26 Means, standard deviations and sample sizes for male and female
marmoset neonates 114
2.27 Means, standard deviations and sample sizes for human head circumference
and body length growth velocities (mm/week) 122
2.28 Independent samples t-tests, comparing measurement-specific
growth velocities between the sexes in humans 128
2.29 Independent samples t-tests comparing rhesus monkey male
and female growth velocities 145
2.30 Examples o f studies on prenatal and postnatal longitudinal growth
in non-human primates 146
3.1 Order-specific means for fat as a percent of body weight 157
3.2 Water, cholesterol and deoxyribonucleic acid content in the cerebrum 158
3.3 Estimated weight of water, cholesterol and protein in the cerebrum 161
4.1 Variation in Benn index (at birth) and BMI (at 6 and 12 months) explained
by body length 198
4.2 Descriptive statistics for estimated nutritional indices 199
4.3 Mean and sd for change in body length SD score (between birth and 6 months)
relative to body length and head circumference SD score tertiles at birth 213
4.4 Mean and sd for change in head circumference SD score (between birth and 6
months) relative to body length and head circumference SD score tertiles at birth 213
4.5 Mean and sd for change in encephalisation SD score (between birth and 6 months)
relative to body length and head circumference SD score tertiles at birth 214
4.6 Mean and sd for thrive in body length (between birth and 6 months)
relative to body length and head circumference SD score tertiles at birth 215
4.7 Mean and sd for thrive in head circumference (between birth and 6 months)
relative to body length and head circumference SD score tertiles at birth 215
4.8 Mean change in SD score and subsequent change in SD score as a function of the 90^'’ and 10^'’ centiles (in terms of encephalisation index) at given measurement
periods 217
4.9 Correlations between neonatal nutritional status SD scores and
head circumference and body length SD at birth 219
4.10a Correlations between neonatal nutritional status SD scores and change in head circumference and body length SD between
birth and 6 months 219
4.10b Correlations between neonatal nutritional status SD scores and
thrive in head circumference SD between birth and 6 months 220
4.11 Correlations between neonatal nutritional status SD scores and a) neonatal encephalisation SD b) change in encephalisation SD between birth
and 6 months 222
4.12a Linear multiple regression analyses where neonatal body length SD score, nutritional status variable SD scores and the interaction between these variables
explain the variation in neonatal head circumference SD score 225
4.12b Multiple regression analysis where neonatal nutritional status SD scores are the independent variables and explain 1) the variation in encephalisation SD scores at birth and 2) change in encephalisation SD scores between
birth and 6 months 226
4.12c Linear multiple regression analyses where neonatal body length SD score, head circumference SD score and the interaction between the two explain the
variation in growth index SD scores between birth and 6 months 227
4.13 Bivariate correlations between change in encephalisation index at initial age
4.14 Multiple regression analysis: Human sample 248
4.15 Multiple regression analysis: Rhesus monkey sample 252
4.16 Multiple regression analysis: Baboon sample 255
4.17 Estimates of daily metabolic costs of metabolically active brain tissue 261
5.1 Change in body composition during pregnancy 273
5.2 Percent of maternal sample for which measures were taken and sample
sizes for each measure, as a function of offspring sex 278
5.3 Descriptive statistics for maternal variables 279
5.4 Descriptive maternal variable sample sizes and percent of total sample 280
5.5 Frequency of measures for maternal variables in the reduced sample as a percent
of the total sample by infant sex 283
5.6 Descriptive statistics for mothers included in the reduced sample
and those excluded 284
5.7 Descriptive maternal variable sample sizes and percent of total sample
for the reduced sample 285
5.8 Descriptive maternal variable sample sizes and percent of total sample
for excluded mothers 286
5.9 Results of independent samples t-tests comparing the means of maternal
variables from mothers in the reduced sample with sons and with daughters 287
5.10 Descriptive statistics for estimated maternal variables 288
5.11 Bivariate correlations where maternal variable SD scores at booking are
correlated with fetal size variable SD scores at ultrasounds 2 and 3 294
5.12 Partial correlations where maternal variable SD scores at booking are correlated with fetal size variable SD scores at ultrasounds 2 and 3, controlling for
maternal body length SD score 296
5.13 Bivariate correlations where maternal variable SD scores at booking are correlated with postnatal size variable SD scores at birth, 6 and 12 months 298
5.14 Partial correlations where maternal variable SD scores at booking are correlated with postnatal size variable SD scores at birth, 6 and 12 months, controlling for
maternal body length SD score 299
5.15 Linear multiple regression analyses for the relationship between maternal
height SD score and maternal nutritional status variable SD scores (independent
5.16 Linear multiple regression analyses for the relationship between maternal height
SD score and maternal nutritional status variable SD scores (independent 302 variables) and infant encephalisation SD score (dependent variable)
5.17 Bivariate correlations where maternal variable SD scores at booking are
correlated with prenatal growth variables 304
5.18 Bivariate correlations where maternal variable SD scores at booking are
correlated with postnatal growth variables 305
5.19 Linear multiple regression analyses where maternal height SD scores and maternal nutritional status variable SD scores explain the variation in offspring
change in encephalisation SD score (A) between measurement periods 307
5.20 Bivariate correlations where maternal variable SD scores are correlated
with offspring thrive in growth SD scores 309
5.21 Linear multiple regression analysesdescribing the relationship between maternal height SD score and maternal nutritional status variable SD scores
(independent variables) and offspring thrive in body length growth
(dependent variable) 313
5.22 Linear multiple regression analysesdescribing the relationship between maternal height SD score and maternal nutritional status variable SD scores
(independent variables) and offspring thrive in head circumference growth
(dependent variable) 314
5.23 Linear multiple regression analysesdescribing the relationship between maternal height SD score and maternal nutritional status variable SD scores
(independent variables) and offspring thrive in encephalisation
(dependent variable) 315
5.24 Bivariate correlations between maternal variables and neonatal SD scores for body length, head circumference, encephalisation indices and the change
in those indices between ultrasound 3 and birth 318
5.25 Partial correlations between neonatal variable SD scores and placenta weight at delivery, controlling for maternal body length SD scores and placental notching,
controlling for maternal age 319
5.26 Partial correlations (controlling for maternal age) between maternal variables and neonatal SD scores for body length, head circumference, encephalisation
indices and the change in those indices between ultrasound 3 and birth 322
5.27 Bivariate correlations between maternal parity and offspring variable SD scores
and partial correlations between those variables (controlling for maternal age) 323
5.28 Multiple regression where maternal variables explain the variation
in neonatal encephalisation SD score 324
5.29 Mean and sd for neonatal head circumference SD scores according to tertiles
5.30 Mean and sd for neonatal head circumference SD scores according
to tertiles for (1) neonatal body length and (2) maternal BMI SD scores 326
5.31 Mean and sd for neonatal head circumference SD scores according to tertiles and
(1) neonatal body length and (2) maternal mid-arm muscle area SD scores 327
5.32 Mean and sd for neonatal head circumference SD scores according to tertiles for neonatal body length and (2) maternal subscapular skinfold thickness
SD scores 327
5.33 Mean and sd for neonatal head circumference SD scores according to tertiles for (1) Neonatal body length and (2) maternal triceps skinfold thickness
SD scores 328
5.34 Mean and sd for neonatal head circumference SD scores according to
tertiles for (1) neonatal body length and (2) maternal skinfold ratio 328
5.35 Results of linear multiple regression analyses describing the relationship between neonatal body length SD score and maternal nutritional status variable SD scores and placenta weight (independent variables) and neonatal head circumference SD
score (dependent variable) 331
5.36 Multiple regression describing the relationship between placenta weight, maternal and neonatal SD scores reflecting size and nutritional status (independent variables) and neonatal head circumference SD scores
(dependent variable) 333
5.37 Results of the principal components analysis 335
5.38 Relationship between slopes describing body weight and basal metabolic rate and
body weight and brain weight in mammals 346
6.1 Sample sizes for fetal autopsy organs weights, body lengths and body weights
and numbers from males and females 367
6.2 Sample sizes at each gestation week where fetal body length data are available 368
6.3 Independent samples t-tests comparing the means of organ weights between
males and females 3 71
6.4 Bivariate correlations between brain weight SD scores (controlling for age
and body length SD scores) and those of non-brain organs 380
6.5 Least squares linear regression statistics where ‘conditional’ brain weight SD score is the independent variable and ‘conditional’ non-brain organ weight SD
score is the dependent variable 380
A. la Body weight and fat as percent of body weight values for birds 407
A. 1 c Body weight and fat as percent of body weight values for insectivores 409
A. Id Body weight and fat as percent of body weight values for carnivores 409
A. le Body weight and fat as percent o f body weight values for bats
410 A .lf Body weight and fat as percent of body weight values for lagomorphs 410
A. 1 g Body weight and fat as percent of body weight values for ungulates 411
A .lh Body weight and fat as percent of body weight values for marsupials 412
A. 1 i Body weight and fat as percent of body weight values for cetaceans 413
A. 1 j Body weight and fat as percent of body weight values for pinnipeds 413
A. Ik Body weight and fat as percent of body weight values for primates 414
A.2 L, M and S values derived by plotting head circumference against age,
used to calculate head circumference SD scores 415
A.3a L, M and S values derived by plotting femur length against age,
used to calculate femur length SD scores 416
A.3b L, M and S values derived by plotting body length against age,
used to calculate body length SD scores 417
A.4 L, M and S values derived by plotting body weight against age,
used to calculate body weight SD scores 418
A,5 L, M and S values derived by plotting Benn indices against age,
used to calculate Benn index SD scores 418
A.6 L, M and S values derived by plotting body mass indices against age,
used to calculate BMI SD scores 419
A.7 L, M and S values derived by plotting sub-scapular skinfold thickness against age,
used to calculate subscapular skinfold thickness SD scores 419
A. 8 L, M and S values derived by plotting triceps skinfold thickness against age,
used to calculate triceps skinfold thickness SD scores 420
A.9 L, M and S values derived by plotting estimated mid-arm muscle area against age,
used to calculate mid-arm muscle area SD scores 420
A. 10 L, M and S values derived by plotting estimated mid-arm fat area against age,
used to calculate mid-arm fat area SD scores 420
A .lla Descriptive statistics for fetal autopsy measures at 20 gestation weeks 421
A.11C A .lld Descriptive Descriptive statistics statistics for for fetal fetal autopsy autopsy measures measures at at 23 24 gestation gestation weeks weeks 421 422 A .lle Descriptive statistics for fetal autopsy measures at25gestation weeks 422 A .l l f Descriptive statistics for fetal autopsy measures at26gestation weeks 422 A . l l g Descriptive statistics for fetal autopsy measures at27gestation weeks 423 A . l l h Descriptive statistics for fetal autopsy measures at 28 gestation weeks 423 A . l l i Descriptive statistics for fetal autopsy measures at29gestation weeks 423 A. l lj Descriptive statistics for fetal autopsy measures at 30 gestation weeks 424 A . l l k Descriptive statistics for fetal autopsy measures at31gestation weeks 424 A . l l l Descriptive statistics for fetal autopsy measures at32gestation weeks 424 A.l Im Descriptive statistics for fetal autopsy measures at33gestation weeks 425 A.l In Descriptive statistics for fetal autopsy measures at 34gestation weeks 425 A.l lo Descriptive statistics for fetal autopsy measures at35gestation weeks 425 A . l l p Descriptive statistics for fetal autopsy measures at36gestation weeks 426 A . l l q Descriptive statistics for fetal autopsy measures at40gestation weeks 426 A. 12a L, M, and S values derived by plotting adrenal gland weight (g) against
gestation age, used to calculate fetal adrenal weight SD scores
A. 12b L, M, and S values derived by plotting brain weight (g) against gestation age, used to calculate fetal brain weight SD scores
A. 12c L, M, and S values derived by plotting heart weight (g) against gestation age, used to calculate fetal heart weight SD scores
A.12d L, M, and S values derived by plotting heart and lungs weight (g) against gestation age, used to calculate fetal heart and lungs weight SD scores
A.12e L, M, and S values derived by plotting kidney weight (g) against gestation age, used to calculate fetal kidney weight SD scores
A.12f L, M, and S values derived by plotting lungs weight (g) against gestation age, used to calculate fetal lungs weight SD scores
A.12g L, M, and S values derived by plotting spleen weight (g) against gestation age, used to calculate fetal spleen weight SD scores
A.12h L, M, and S values derived by plotting thymus weight (g) against gestation age, used to calculate fetal thymus weight SD scores
A.12i L, M, and S values derived by plotting body length (mm) against
LIST OF FIGURES
1.1 Logio-transformed brain weight plotted against Log, o-transformed
body weight for species from a variety of vertebrate orders 32
1.2 Scatterplot showing grade-shift between strepsirhine and haplorhine
primates in logio-transformed brain weight plotted against body weight 38
1.3 Logio-transformed brain weight plotted against logio-transformed body weight
for haplorhine primates 39
1.4 Logio-transformed neonatal brain weight plotted against logio-transformed
neonatal body weight for primates 48
2.1 Bar graph of fetal, infancy, juvenile and adulthood periods as a proportion of
total lifespan in prosimians 80
2.2 Bar graph of fetal, infancy, juvenile and adulthood periods as a proportion of
total lifespan in simians 80
2.3 Bar graph o f fetal, infancy, juvenile and adulthood periods as a proportion of
total lifespan in apes, including humans 81
2.4 Scatterplot o f the percent of life spent growing plotted against logio-transformed
adult female body weight 84
2.5 Scatterplot o f the percent of life spent growing plotted against residuals calculated by plotting logio-transformed brain weight against body weight
in strepsirhines and haplorhines 84
2.6 Ultrasound showing fetal head circumference, occipito-ffontal diameter and
biparietal diameter 94
2.7 Ultrasound showing femur length measurement 94
2.8 LMS curve with centiles describing body length for age in male neonates 118
2.9 SD scores derived from LMS curve for body length in male neonates 118
2.10 Human fetal and infant body length and head circumference growth curves 120
2.11 Growth velocity curves for head circumference and for body
length as a function of age 123
2.12 Sex-specific means with error bars illustrating body length growth
velocity at different measurement periods 125
2.13 Sex-specific means with error bars showing sex-specific head
2.14 Sex-specific fetal and infant head circumference growth velocity curves 127
2.15 Sex-specific fetal and infant body length growth velocity curves 127
2.16 Prenatal head circumference and femur length growth curves in rhesus monkeys 130
2.17 Postnatal head circumference and femur length growth curves
in rhesus monkeys 131
2.18 Head circumference and femur length growth curves in fetal baboons 133
2.19 Head circumference growth curve in fetal marmosets 134
2.20 Comparative femur length growth trajectories between humans,
baboons and rhesus monkeys 136
2.21 Comparative head circumference growth trajectories between humans,
baboons, rhesus monkeys and marmosets 137
2.22 Head circumference and femur length growth velocity in fetal and infant
rhesus monkeys 141
2.23 Head circumference growth velocity in male and female rhesus monkeys 142
2.24 Femur length growth velocity in male and female rhesus monkeys 142
2.25 Human head circumference growth trajectories for six randomly
chosen individuals illustrating intra-specific variation 143
2.26 Human body length growth trajectories for six randomly
chosen individuals illustrating intra-specific variation 144
3.1a Scatterplot o f loge-transformed head circumference measures
plotted against percent gestation length for human fetuses 168
3.1b Fetal head circumference growth curve in humans 169
3.2a Scatterplot o f loge-transformed head circumference plotted
against percent gestation length for baboons 170
3.2b Fetal head circumference growth curve in Papio sp. 171
3.3a Scatterplot o f loge-transformed head circumference measures
plotted against percent gestation length for rhesus monkeys 172
3.3b Fetal head circumference growth curve in Macaca mulatta 173
3.4a Scatterplot of loge-transformed head circumference measures
plotted against percent gestation length in marmosets 174
3.4b Fetal head circumference growth curve in yjccAwj' 175
at birth) scaled to standardised gestation length 178
3.6 Percent o f human head circumference size at 1 year plotted against
percent of body length size at 1 year 181
3.7 Loge-transformed gestation length plotted against loge-transformed
female body weight in haplorhine primates 183
4.1 LMS curve o f neonatal head circumference SD scores plotted against
body length SD scores with derived centiles 192
4.2 Encephalisation SD scores plotted against gestation age at delivery in neonates 192
4.3 LMS model and centiles derived from subscapular skinfold thickness
plotted against age for females at birth 200
4.4 SD scores for female subscapular skinfold thickness at birth
plotted against age 200
4.5 Scatterplot of encephalisation SD scores plotted against body
length SD scores at birth 204
4.6 Scatterplot of encephalisation SD scores plotted against body weight
SD scores at birth 205
4.7a Mean SD score with error bars for fetuses at ultrasound 2 who fell
below the 10^*^ percentile in terms of encephalisation SD score 206
4.7b Mean SD score with error bars for fetuses at ultrasound 2 who fell
above the 90‘*’ percentile in terms of encephalisation SD score 206
4.7c Mean SD score with error bars for fetuses at ultrasound 3 who fell
below the 10‘*’ percentile in terms of encephalisation SD score 207
4.7d Mean SD score with error bars for fetuses at ultrasound 3 who fell
above the 90^'’ percentile in terms of encephalisation SD score 207
4.7e Mean SD score with error bars for neonates at birth who fell below
the 10^ percentile in terms of encephalisation SD score 208
4.7f Mean SD score with error bars for neonates at birth who fell above
the 90^ percentile in terms of encephalisation SD score 208
4.7g Mean SD score with error bars for neonates at birth who fell above
the 90^ percentile in terms of encephalisation SD score 209
4.7h Mean SD score with error bars for infants at 6 months who fell above
the 90^’’ percentile in terms of encephalisation SD score 209
4.7i Mean SD score with error bars showing + or - 2 sd for infants at 12 months
4.7j Mean SD score with error bars for infants at 12 months who fell
above the 90* percentile in terms of encephalisation SD score 210
4.8 Individuals below the 10th percentile at ultrasound 2 in terms
o f encephalisation SD score 229
4.9 Individuals above the 90* percentile at ultrasound 2 in terms
o f encephalisation SD score 229
4.10 Individuals below the 10* percentile at ultrasound 3 in terms
o f encephalisation SD score 230
4.11 Individuals above the 90* percentile at ultrasound 3 in terms of
encephalisation SD score 230
4.12 Individuals below the 10* percentile at birth in terms
of encephalisation SD score 231
4.13 Individuals above the 90* percentile at birth in terms
o f encephalisation SD score 231
4.14 Individuals below the 10* percentile at 6 post-natal months in terms
o f encephalisation SD score 232
4.15 Individuals above the 90* percentile at 6 post-natal months in terms
o f encephalisation SD score 232
4.16a Encephalisation SD score plotted against age in post-conception weeks for case
number 12 233
4.16b Encephalisation SD score plotted against age in post-conception weeks for case
number 147 233
4.17a Loge-transformed human fetal head circumference plotted against
femur length at ultrasound 2 (16-28 gestation weeks) 243
4.17b Loge-transformed human fetal head circumference plotted against
femur length at ultrasound 3 (28-37 gestation weeks) 244
4.17c Loge-transformed human neonatal head circumference plotted against
body length at birth 245
4.17d Loge-transformed human head circumference plotted against body
length at 6 postnatal months 246
4.17e Loge-transformed human head circumference plotted against body
length at 6 postnatal months 247
4.18a Loge-transformed head circumference plotted against femur
length in fetal rhesus monkeys 250
4.18b Loge-transformed head circumference plotted against femur
4.19 Head circumference plotted against femur length in fetal baboons 254
4.20 Loge-transformed head circumference plotted against birth
weight in the neonatal Common marmoset 256
5.1 Box plot showing mean maternal weight at booking, with
outliers and extreme cases 281
5.2 Box plot showing mean maternal body mass index at booking, with
outliers and extreme cases 281
5.3 Box plot showing mean maternal sub-scapular skinfold thickness
at booking, with outliers 282
5.4 Encephalisation SD scores at birth plotted against loge-transformed
placenta weight measures at delivery 320
6.1 Organ weight as a function of age from human fetal and infant autopsy data 349
6.2 Organ weight in rhesus monkeys as a function of age relative to birth
from fetal and infant necropsy data 353
6.3 Scatterplot of logio-transformed mean organ weights plotted against
body length 356
6.4 Scatterplot of logio-transformed rhesus monkey organ weights
plotted against body weight 359
6.5 LMS-model and centiles derived from plotting autopsy fetal kidney
weight against gestation age in weeks 372
6.6 LMS-model and centiles derived from plotting autopsy fetal body
length against gestation age in weeks 372
6.7 LMS-model and centiles derived from plotting kidney weight SD scores
against body length SD scores 373
6.8a Scatterplot of fetal human adrenal weight ‘conditional’ SD scores plotted
against brain weight ‘conditional’ SD scores. ‘Conditional’ SD scores control for
age and for body length SD score effects 376
6.8b Scatterplot of fetal human heart weight ‘conditional’ SD scores plotted
against brain weight ‘conditional’ SD scores. ‘Conditional’ SD scores control for
age and for body length SD score effects 376
6.8c Scatterplot of fetal human heart + lungs weight ‘conditional’ SD scores plotted against brain weight ‘conditional’ SD scores. ‘Conditional’ SD scores control for
age and for body length SD score effects 377
against brain weight ‘conditional’ SD scores. ‘Conditional’ SD scores control for
age and for body length SD score effects 377
6.8e Scatterplot o f fetal human liver weight ‘conditional’ SD scores plotted
against brain weight ‘conditional’ SD scores. ‘Conditional’ SD scores control for
age and for body length SD score effects 378
6.8f Scatterplot of fetal human liver weight ‘conditional’ SD scores plotted
against brain weight ‘conditional’ SD scores. ‘Conditional’ SD scores control for
age and for body length SD score effects 378
6.8g Scatterplot of fetal human spleen weight ‘conditional’ SD scores plotted
against brain weight ‘conditional’ SD scores. ‘Conditional’ SD scores control for
age and for body length SD score effects 379
6.8h Scatterplot of fetal human thymus weight ‘conditional’ SD scores plotted
against brain weight ‘conditional’ SD scores. ‘Conditional’ SD scores control for
CHA PTER 1 Introduction
1.1) A im s o f thesis
The purpose o f this thesis is to (1) quantify encephalisation in the living fetus and
infant up to one year-of-age, (2) relate encephalisation to fetal and infant grow th
patterns, (3) relate encephalisation to m aternal factors and (4) relate encephalisation to
differential tissue investm ent w ithin the fetus and infant. M aternal factors include
body size, indices o f nutritional status in early pregnancy, placenta w eight, num ber o f
notches w ithin the placenta, age, parity, socio-econom ic status, alcohol use and
sm oking during pregnancy.
The underlying prem ise o f the thesis is that energy for encephalisation m ay be m et by
the m other or by the fetus or infant itself and that conflict over energy resources
betw een m other, placenta and fetus m ay im pact offspring encephalisation. To this end
estim ates o f m aternal fat and lean tissue deposits provide indirect proxies for energy
availability for the fetus, and placenta weights provide a proxy for efficiency o f energy
transfer to the fetus. The fetus or infant m ay provide additional energy for
encephalisation via trade-offs w ithin its own physiological systems. The relationship
betw een the relative size o f the fetal brain and that o f other m ajor organs is assessed in
order to determ ine w hether energy for encephalisation m ay be m et by reducing energy
availability to other organs. Additionally, the relationship betw een encephalisation
and som atic grow th rate is assessed in order to determ ine w hether additional energy
for encephalisation m ay be m et by reducing growth in the non-brain body, in order to
divert energy to brain tissue.
E ncephalisation w ithin the context o f this thesis has no bearing on ‘intelligence’ but
rather reflects brain size relative to body size.
A lthough m uch w ork has been carried out on encephalisation in m am m als, and
prim ates in particular, the m ajority o f these studies have focused on com parative
encephalisation w ith grow th or the intra-specific variation in encephalisation during
ontogeny. This thesis seeks to provide further insights into the w ay in w hich brains
and bodies grow in encephalised and non-encephalised individuals. To that end, it
undertakes a longitudinal in vivo study o f fetal and infant grow th using ultrasound
sonography and anthropom etry.
A better understanding o f the energetic im plications for encephalisation during grow th
w ould be useful for determ ining the im pact o f grow th faltering and m alnutrition on
relative brain size as w ell as the im pact o f m aternal nutritional stress on offspring
encephalisation. Persistent deficits in encephalised brain grow th m ay also serve as a
useful indicator for severe grow th faltering.
1.2 ) B rie f outline o f chapter 1
C hapter 1 is divided into two m ain sections. The first section deals w ith the
encephalisation quotient - how it is quantified and w hat it m easures. It also com pares
levels o f encephalisation betw een prim ates and vertebrates in general, and betw een
hum ans and non-hum an prim ate species. D ata from the literature are used to describe
the relationships betw een brain w eight and body w eight at different taxonom ic levels
and ages. The author does not im pose her ow n selection criteria to these data, but
uses the m easures com piled in the relevant publications.
The second section o f the chapter explores the energetic costs o f encephalisation in
the adult and neonate and follows w ith a b rie f description o f the content o f the thesis.
SECTIO N I: Encephalisation
1.3) The encephalisation quotient
It has long been recognised that large bodied animals have large brains but that a large
first defined the degree to w hich observed and expected brain size (scaled to body
size) differs as the encephalisation quotient (EQ): the ratio o f actual brain size to
expected brain size for living m am m als using the formula:
(1) E Q = 0 .1 2 * ( B o W ) " “ ''
w here EQ = encephalisation quotient and B oW = body w eight in gram s given by
Jerison (1973) based on m am m alian data.
A lthough Jerison established the basis for this work, m ore recent analyses using larger
samples, better distributions o f species and arguably m ore appropriate line fitting
techniques have show n that a scaling coefficient o f 0.75 better describes the allom etric
relationship betw een brain w eight and body w eight in m am m als (Bauchot 1978,
Eisenberg 1981, A rm strong 1982, H ofinan 1982, M artin 1982, 1983). For exam ple,
M artin’s (1983) equation states that:
(2) Logio (BrW ) = 0.76 Logio (BoW ) +1.77
w here B rW = brain w eight in m illigram s and B oW = body w eight in grams.
Traditionally, residual brain w eight (a reflection o f EQ ) is calculated by subtracting
observed brain w eight m easures from estim ated brain w eight m easures (calculated
from a predictive equation). The residual values for a given species vary according to
the taxonom ic level o f analysis and the nature o f the sam ple since exponent values
determ ined at low er taxonom ic levels, tend to be low er largely as a result o f reduced
variation around the expected regression line (H ollow ay and Post 1982). Likewise,
the nature o f the species included in the sam ple affects the best-fit regression line
through the data, and hence, the equation describing the regression. As a result, the
deviation o f a species from the ‘average’ line (its residual value) is largely a function
o f the sam ple to w hich it is compared.
W here evolutionary trends in encephalisation are o f interest, phylogenetic relatedness
o f ‘independent contrasts’. This m ethod differentiates betw een traits passed from a
com m on ancestor to descendent species, as opposed to those that have evolved
independently in a species. The m ethods produce contrasts controlling for
phylogenetic relatedness of, for exam ple, brain and body w eights, w hich m ay be
entered into regression analysis m uch the same as absolute data w ould be. The slope
o f the m odel would, how ever, differ from that derived from absolute brain and body
sizes. B ecause differences in encephalisation betw een hum ans and extant species are
o f interest here, rather than evolutionary trends, independent contrasts are not utilised.
B y considering brain size after controlling for body size, it becom es possible to assess
brain size m ore accurately in sexually dim orphic species as w ell as across species.
For exam ple, using data on brain and body w eights collected by Q uirling (1950),
prim ate encephalisation can be assessed relative to that o f other vertebrate orders.
1.4) Prim ate encephalisation relative to other vertebrates
In Figure 1.1, logio-transformed vertebrate brain w eights are plotted against body
w eights across eight orders including birds, bony fish, elasm obranch fish, reptiles,
rodents, ungulates, cetaceans and prim ates. Table 1.1 lists the order-specific least
squares slopes derived from these data, using linear regression. Least squares linear
regression is used to determ ine the slopes and corresponding residuals. The residuals
represent the degree to w hich a data point deviates from the m ean regression line (see
Sokal and R o h lf 1997).
The Q uirling (1950) data show that prim ates and cetaceans have the largest brains for
their b od y size relative to the vertebrates in the sample, and the hum an (m arked w ith
an asterix) has a significantly larger brain than expected for a prim ate o f its body
w eight. The hum an in this sam ple w as large, w ith a body w eight o f 78.5kg. B ased on
the prim ate predictive equation (slope and intercepts taken from Table 1.1), this
hum an has a predicted brain w eight o f 774g, w hile its actual brain w eight is 1540g.
B ased on the prim ates in this sample, the hum an has a brain alm ost tw ice as large as
This study is based on general methods em ployed in sim ilar studies in m am m als.
Jerison (1973), M artin (1982, 1983) and H arvey (1988), for exam ple, show ed sim ilar
4
3
2
O)
1
0
ooo
O)
2
0
1
2
3
log(10) body weight
ungulate
^ rodent
° reptile
• primate
^ pinneped
* human
^ elasmotxanch fish
■ cetaean
° cam!V ore
^ bony fish
^ bird
8
Figure 1.1 D ata taken from Q uirling (1950). Logio-transformed brain w eight in grams plotted against Logio-transform ed body w eight in grams for species from a variety o f vertebrate orders.
Table 1.1 O rder-specific least squares regressions calculated from brain w eight
O rder n Intercept Slope SE r: P
ungulate 24 0.141 0.458 0.145 0.836 0.000
bird 52 -0.685 0.500 0.173 0.869 0.000
bony fish 40 -1.484 0.511 0.204 0.833 0.000
reptile 19 -1.914 0.570 0.182 0.937 0.000
carnivore 35 -0.557 0.579 0.149 0.917 0.000
rodent 14 -1.056 0.686 0.179 0.939 0.000
primate^ 10 -0.884 0.748 0.149 0.942 0.000
primate^ 11 -1.121 0.820 0.180 0.935 0.000
1.5) H um an encephalisation relative to other prim ates
H ow ever, as noted, a predictive equation is largely a function o f the species included
in the sample. In a larger database o f prim ate brain and body w eights, com piled by
Stephan et al. (1985), hum an brain w eight and body w eight can be assessed relative to
26 other anthropoid (haplorhine) prim ates, including hum ans, and 17 prosim ian
(strepsirhine) prim ates. It should be noted that in this database, a species is often
represented by m ultiple individuals and no reference to sex is given. Tarsius syrichta
is excluded from this analysis as it is debatable w hether or not its taxonom ic affinity
lies w ith the haplorhines or strepsirhines (D ene et al. 1976, Stephan 1984, Joffe and
D unbar 1998).
Figure 1.2 is a scatterplot o f logio-transform ed brain w eight plotted against body
w eight in prim ates and shows that there is a clear grade-shift betw een these tw o infra
orders in term s o f their relationship betw een brain and body w eight, as docum ented by
other w orkers (M artin and H arvey 1985, M artin 1989a,b). A lthough haplorhine and
strepsirhine slopes are very sim ilar, the intercepts for those slopes differ, w ith the
strepsirhine intercept below that o f the haplorhines (see equations 3 and 4). The two
slopes differ significantly. These grade-shifts have clear im plications for the
calculation o f residuals. W hen fitting a haplorhine-speciflc and strepsirhine-speciflc
regression to the prim ates in the Stephan et al. (1985) database, it is possible to
calculate brain size residuals from the infra-order-speciflc regression line. Table 1.2
lists the infra-order specific residuals calculated from these data. H um an relative
brain size is assessed relative to haplorhine prim ates alone as our species clearly falls
m ost closely w ithin this grade.
Figure 1.3 shows logio-transform ed brain w eights plotted against body w eights for the
haplorhine prim ates m easured by Stephan et al (1985). H um ans and a num ber o f
other species are labeled. The least squares linear regression equations (including and
excluding hum ans) are also given (see equations 5 and 6).
There is som e debate as to w hich regression technique should be applied to data for
reduced m ajor axis regression be used, w hile M artin (1983) recom m ends the m ajor
axis regression. Falk et al. (1999) on the other hand, used least squares linear
regression to describe the relationship betw een brain size and body w eight, and
Trinkaus and H ilton (1996) argue for its use w hen predicting one variable from
another. Follow ing D ean et al. (1999) and Trinkaus and H ilton (1996), least squares
linear regression is used here.
A ccording to Sokal and R o h lf (1997) least squares regression allows for the
calculation o f residuals from a m ean regression line, w here the sum o f the squared
deviations (calculated as a vertical line from the data point to the line) is as sm all as
possible, and w here m easurem ent error associated w ith the independent variable is
relatively low. In contrast, the m ajor axis model assum es that m easurem ent error is
greater on the x-axis, w hile the reduced m ajor axis m odel assum es that the error is
even on both axes, and o f a very low order (Ricker 1973, R ayner 1985).
Figure 1.3 shows that hum ans have a m arkedly positive residual (+0.39) relative to the
other anthropoid prim ates in the sample. Table 1.2 lists the species-specific residuals
calculated from strepsirhine and haplorhine regressions, and shows that M iopithecus
talapoin, Saim iri sciurus, Cebus sp. and Lagothrix lagothricha are also notably
encephalised for prim ates o f their body size. C orresponding EQ values based on the
m am m alian regression given by M artin (1983) are also listed. R esulting
encephalisation values differ depending on the regression used.
In this regression analysis, the chim panzee is not encephalised relative to the other
anthropoids in the sample. Rather, its brain w eight lies on the regression line. This
contradicts other studies (Jerison 1973, M artin 1983) and is likely an artifact o f the
individual used in the Stephan et al. (1985) sample rather than the species as a w hole.
The above regressions show that there is variation in relative brain size am ong both
haplorhine prim ates (sd = 0.13, n = 26) and strepsirhine prim ates (sd = 0.12, n = 17) .
A num ber o f w orkers have attributed this variation in relative brain size to adaptations
arising from variation in social dem ands (Byrne and W hiten 1988, D unbar 1992,
ecological/foraging dem ands (M ilton 1979, 1988; Parker and G ibson 1979, Clutton-
B rock and H arvey 1980, G ibson 1986, M acN ab and Eisenberg 1989, Barton and
Purvis 1994, Barton 1996, Barton and D unbar 1997). These authors argue that
varying levels o f social com plexity and/or foraging com plexity have placed
differential selection pressures on species for encephalisation. R eader and Laland
(2002), in contrast argue that increased brain size has evolved in response to
innovation, social intelligence and tool use.
For exam ple, D unbar (1992) argued that neocortex size and group size are correlated
in prim ates, w ith highly social prim ates having relatively large neocortices - the part
o f the brain associated w ith abstract thought, foreplanning and association formation.
H e suggested that the com plex nature o f prim ate social interactions w as the selection
pressure for increased neocortex size, largely in response to the cognitive dem ands o f
m aintaining social cohesion in large groups in w hich individuals m ust m onitor
com plex triadic relationships.
K evem e et al. (1996) found that the neocortex is under the control o f the m aternal
genom e and the authors suggested that increased neocortex size, therefore, evolved in
m atrilinial prim ate societies, associated w ith com plex hierarchical relationships.
In contrast, Clutton-Brock and H arvey (1980) show ed that brain w eight is correlated
w ith diet and hom e range in prim ates. The authors argued that increased relative brain
w eight in frugivores, over folivores, is associated w ith increased cognitive dem ands o f
m onitoring a w idely dispersed and ephem eral food resources (i.e. fruit). Barton
(1996) showed sim ilar findings in assessing the relationship betw een neocortex size
and behavioral ecology in prim ates.
Parker and G ibson (1977) and G ibson (1986) have argued that ecological selection
pressures, particularly the cognitively com plex task o f extractive foraging o f
em bedded food resources, has been the driving force behind increased brain w eight in
R eader and Laland (2002), rather than arguing for a social versus ecological
intelligence model, have suggested that these social and ecological cognitive
processes are not m utually exclusive but interact to produce innovative behaviors, the
basis for increased brain size selection in prim ates, w ith both social and ecological
benefits. The authors cite tool use as an outcome o f these cognitive processes.
M uch o f the w ork on the social intelligence hypothesis and the ecological intelligence
hypothesis, how ever, is based on cross-sectional data and indirect m easures o f social
and ecological intelligence. M oreover, there is disagreem ent as to the functional
correlates o f relative brain size. For example. D eacon (1997) has argued that in non
hum an prim ates, encephalisation does not reflect increased brain size, but rather
reduced body size (dwarfism) over evolutionary time.
In summary, encephalisation is a m easure o f brain size relative to body size. There
m ay be som e disagreem ent as to w hether encephalisation in non-hum an prim ates has
evolved in réponse to increased brain size or decreased body size, but m ost authors
agree that a com bination o f social and ecological selection pressures have favored
4.0'
■2
3.0
O c i m isimians
" prosimians
2.5
3.0
3.5
4.0
4.5
5.0
5.5
log(10) body weight (g)
Figure 1.2 Scatterplot showing grade-shift betw een strepsirhine and haplorhine prim ates in logio-transformed brain w eight plotted against body weight. D ata taken from Stephan et al. (1985).
The least squares linear regression equation for prosim ians is:
(3) logic brain weight (grams) = 0.664 * logic body w eight (gram s) + 2.1 (r^ = 0.916, SE = 0.120, n = 17, P = <0.0001)
for simians:
6.5'
2
O)6.0'
-4—»
_c
D)5.5'
%
5.0'
C
2
JD4.5'
O
4.0'
D)
O 3.5
• itiesus monkey
* human
^ gorilla
■ gibbon
^ chimpanzee
▼ cebus
° baboon
O other
.0
2.5
3.0
3.5
4.0
4.5
5.0
5
log(10) body weight (grams)
Figure 1.3 D ata taken from Stephan et al. (1985). Logio-transformed brain w eight plotted against logio-transform ed body weight for haplorhine prim ates. A least squares linear regression is fitted to the data and a predictive equation is calculated. The predictive equation is based on non-hum an prim ates. B rain size residuals are then calculated by subtracting observed brain w eights from predicted brain weights.
The least squares linear regression equation including hum ans is:
(5) logio brain w eight (grams) = 0.749 * logio body w eight (grams) -f 2.1 (i^ = 0.945, SE = 0.138, N = 27, P = <0.0001)
excluding humans: