Performance Evaluation of Maximum Power
Point Tracking Algorithm with Buck-Boost
Dc-Dc Converter for Solar PV System
Ahteshamul Haque
Department ofElectricalEngineering Jamia Millia Islamia University, New Delhi-25
Abstract
Maximum power point tracking is used in solar PV energy conversion system to extract maximum power from solar PV (Photovoltaic). MPPT algorithm is implemented in the control circuit of Power electronics DC-DC converters. The behavior of MPPT depends upon the type of the type of DC – DC converter used. The objective of this paper is to analyze the working of MPPT with buck-boost DC – DC converter. The simulation is study is done by using PSIM simulation software.
Keywords: MPPT, Solar PV, Power Electronics, Buck-Boost Converter, PSIM
________________________________________________________________________________________________________
I. INTRODUCTION
Global Energy Crisis and climate change threats leads the researchers to look for alternate sources of energy [1-2]. Solar Energy is considered as the most reliable source among all renewable energy sources (RES) [3-8]. Solar PV is used to convert solar energy into electrical energy. Solar PV exhibits nonlinear characteristics and its efficiency is also low. It becomes essential to extract maximum power from solar PV under all ambient conditions. MPPT (Maximum Power Point Tracking) algorithm is used to extract maximum power from solar PV [9-10]. The MPPT is implemented in the control circuit of Power electronics converters. A converter without MPPT system only regulates the output voltage of PV module, but it does not ensure that PV system is operating at the maximum power point MPP [11]. The operation of MPPT depends on the type of converter used [12-14]. In this paper a buck-boost dc-dc converter is used and the performance of MPPT is evaluated.
II. SOLAR PV CHARACTERISTIC
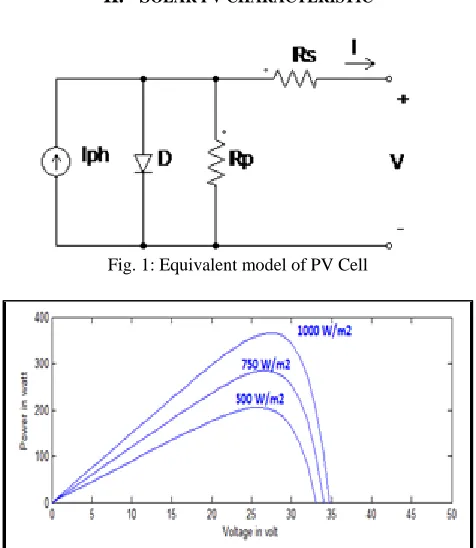
Fig. 1: Equivalent model of PV Cell
The basic element of solar PV system is PV cells. These cells are connected to form modules. It is further expanded in the form of arrays as per the power requirements. These PV cells exhibit nonlinear characteristics. The output of the PV cell varies with solar irradiation and with ambient temperature. The equivalent circuit model of PV cell given in Fig (1). The characteristic equation of PV cell based on this model is given by equation 1, 2 and 3 [3].
I = Iph – Ios {exp [(q/AKT) (V + I Rs)] – 1} - (V +I*Rs)/Rp (1) Ios = Ior exp [q EGO/ Bk ((1/Tr) – (1/T))] [T/Tr] 3 (2) Iph = S [Isc + KI (T- 25)]/100 (3)
Where I am the PV module output current, V is the PV cell output voltage, Rp is the parallel resistor, Rs is the series resistor.
Ios is the PV module reversal saturation current, A, B are ideality factors, T is temperature (oC), k is boltzmann’s constant, Iph is
the light-generated current, q is electronic charge, KI is short-circuiting current temperature coefficient at ISC. S is solar
irradiation (W/m2), I
SC is short-circuit current at 25oC and 1000 W/m2, EGO is bandgap energy for silicon, Tr is reference
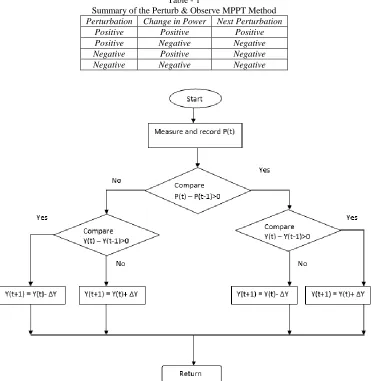
temperature and Ior is saturation current at temperature Tr. The plot of solar PV output power is shown in Fig (2). It can be seen
that the power and current varies non-linearly with the variation in solar irradiation and with ambient temperature.
III. P&O MPPT TECHNIQUE
Perturb and observe (P&O) method is a MPPT scheme proposed by researchers. In perturb and observe method the perturbation is applied either in the reference voltage or in the reference current signal of the solar PV. The flow chart of the P&O method is shown in Fig 3. In this chart Y is shown as the reference signal. It could be either solar PV voltage or current. The main aim is to reach to the MPP. To achieve it the system operating point is changed by applying a small perturbation (∆Y) in solar PV reference signal. After each perturbation the power output is measured. If the value of power measured is more than the previous value then the perturbation in reference signal is continued in the same direction. At any point if the new value of solar PV power is measured less than the previous one then perturbation is to apply in the opposite direction. This process is continued till MPP is reached. In [8] the P&O method uses the solar PV panel current as a reference signal. The issue with this method is it becomes oscillatory around MPP. Table 1 gives the summary of P&O MPPT method.
Table - 1
Summary of the Perturb & Observe MPPT Method Perturbation Change in Power Next Perturbation
Positive Positive Positive Positive Negative Negative
Negative Positive Negative
Negative Negative Negative
IV. BOOST DC –DC CONVERTER
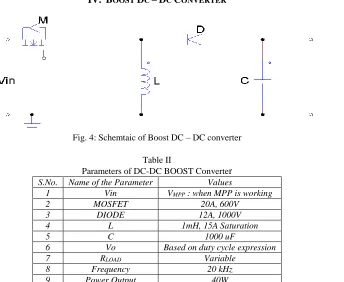
Fig. 4: Schemtaic of Boost DC – DC converter
Table II
Parameters of DC-DC BOOST Converter S.No. Name of the Parameter Values
1 Vin VMPP : when MPP is working
2 MOSFET 20A, 600V
3 DIODE 12A, 1000V
4 L 1mH, 15A Saturation
5 C 1000 uF
6 Vo Based on duty cycle expression
7 RLOAD Variable
8 Frequency 20 kHz
9 Power Output 40W
The schematic of boost converter is shown in Fig. 4. The specifications of components are shown in Table I. The boost converter is designed to work in continuous conduction mode. The relationship between boost converter input and output is given by:
Vo = D Vin/ (1-D) (4)
V. MPPT WITH BOOST DC-DC CONVERTER
Fig. 5: Block Diagram of Buck -Boost DC – DC converter
Fig. 7: Rin Vs Duty Cycle
The block diagram of buck - boost dc-dc converter with MPPT is shown in Fig. 5. The MPP zone for buck -boost converter is shown in Fig. 6. The variation of input impedance with duty cycle is shown in Fig. 7. Equation 5 is the relationship between input and out impedances with duty cycle. The MPPT will be working with buck -boost converter between B and C in Fig. 6, where Rload >> RMPP. The MPPT will be working between A and B. The MPPT will be working for the entire range on solar PV
characteristic.
VI. RESULT AND DISCUSSION
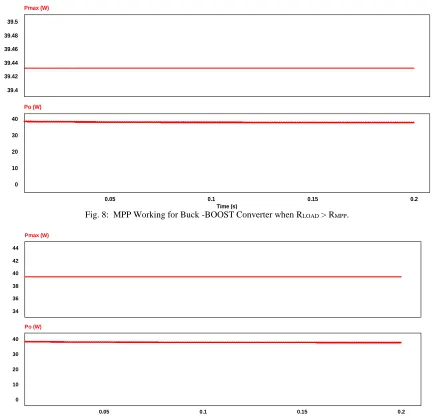
Fig. 8: MPP Working for Buck -BOOST Converter when RLOAD > RMPP.
Fig. 9: MPP Failed for Buck -BOOST Converter when RLOAD < RMPP.
39.4 39.42 39.44 39.46 39.48 39.5
Pmax (W)
0.05 0.1 0.15 0.2
Time (s) 0
10 20 30 40
Po (W)
34 36 38 40 42 44
Pmax (W)
0.05 0.1 0.15 0.2
Time (s) 0
10 20 30 40
Fig. 8 and 9 are simulation results. Fig. 8 shows that MPPT is working RLOAD > RMPP. The maximum PV power and Load
power is almost same. Fig. 9 shows that MPPT is working when RLOAD < RMPP. The power is same as MPP power of solar PV.
These results shows that entire PV characteristic is MPPT working zone with buck - boost DC – DC converter.
VII.CONCLUSION
The main objective of the paper is to evaluate the performance of MPPT with buck- boost DC – DC converter in terms of MPPT working zone. The MPPT with buck -boost dc-dc converter is analysed and simulation results are presented. It is evident that MPPT is functional in the entire zone of PV characteristic curve.
ACKNOWLEDGEMENT
The research work of this paper is done by using the instruments purchased under MNRE R&D project sanctioned.
REFERENCES
[1] Godfrey Boyle, “Renewable energy power for a sustainable future,” Oxford University Press, 2014.
[2] Sathish Kumar Kollimalla and Mahesh Kumar Mishra, “Variable perturbation size adaptive P&O MPPT algorithm for sudden Changes in Irradiance,” IEEE Trans. Sustainable Energy, vol. 5, no. 3, pp.1949-3029, Jul. 2014.
[3] Dezso Sera Laszlo Mathe, Tamas Kerekes, Sergiu Viorel Spataru, and Remus Teodorescu, “On the perturb-and-observe and incremental conductance MPPT Methods for PV Systems,” IEEE Journal. Photovoltaics, vol. 3, no. 3, pp. 2156-3381, Jul. 2013.
[4] Andrea Montecucco and Andrew R. Knox, “Maximum power point tracking converter based on the open-circuit voltage method for thermoelectric generators,” IEEE Trans. Power Electronics, vol. 30, no. 2, Feb.2015.
[5] Ian Laird and Dylan Dah-Chuan Lu, “High step-up DC/DC topology and MPPT algorithm for use with a thermoelectric Generator,” IEEE Trans. Power Electronics, vol. 28, no. 7, pp.0885-8993, Jul. 2013.
[6] Kashif Ishaque, Zainal Salam,Muhammad Amjad, and Saad Mekhilef, “An improved particle Swarm optimization (PSO)–based MPPT for PV with reduced steady-state oscillation,” IEEE Trans. Power Electronics, vol. 27, no. 8, pp. 0885-8993,Aug. 2012.
[7] Moacyr Aureliano Gomes de Brito, Luigi Galotto Jr., Leonardo Poltronieri Sampaio, Guilherme de Azevedo e Melo, and Carlos Alberto Canesin, “Evaluation of the main MPPT techniques for photovoltaic applications,” IEEE Trans. Industrial Electronics, vol. 60, no. 3,pp.0278-0046,Mar.2013. [8] Tey Kok Soon and Saad Mekhilef, “A fast-converging MPPT technique for photovoltaic system under fast-varying solar irradiation and load Resistance”,
IEEE Trans. Industrial Informatics, vol. 11, no. 1,pp. 1551-3203, Feb. 2015.
[9] Carl Ngai-Man Ho, Hannes Breuninger, SamiPettersson, Gerardo Escobar, Leonardo Augusto Serpa, and Antonio Coccia, “Practical design and implementation procedure of an interleaved boost converter using SiC diodes for PV applications,” IEEE Trans. Power Electronics, vol.27, no. 6,pp.0885-8993, Jun. 2012.
[10] Zaheeruddin, SK Mishra, Ahteshamul Haque, “Performance evaluation of modified perturb & observe maximum power point tracker for Solar PV system”, Springer Internat. Journal, System assutance engg. & manag., pp. 1-10, Jun. 2015.
[11] R. Seyezhai and B.L. Mathur, “Design and implementation of interleaved boost converter for fuel cell systems,” internat. Journal, hydrogen energy 37(2012) 3897-3903.
[12] Po-Wa Lee, Yim-Shu Lee, David K. W. Cheng, and Xiu-Cheng Liu, “Steady-state Analysis of an interleaved boost converter with coupled inductors,” IEEE Trans.Indust. Electronics, vol. 47, no. 4, pp. 0278-0046, Aug. 2000.
[13] G.J. Kish, J.J. Lee, and P.W. Lehn, “Modelling and control of photovoltaic panels utilising the incremental conductance method for maximum power point tracking,” IET Renew. Power Gener., 2012, Vol. 6, Iss. 4, pp. 259–266.