Research Article
CODEN: IJPNL6
DEVELOPMENT AND VALIDATION OF RP-HPLC METHOD FOR SIMULTANEOUS
ESTIMATION OF LISINOPRIL AND AMLODIPINE BESYLATE IN TABLET
DOSAGE FORM
B. Prathap*
1, Akalanka Dey
2, G.H. Srinivasa Rao
11
Department of Pharmaceutical Analysis, Saastra College of Pharmaceutical Education &
Research, Nellore, Andhra Pradesh, India – 524311
2
Faculty of Pharmacy, Annamalai University, Annamalai Nagar, Tamilnadu, India - 608002
*Corresponding author e-mail:
[email protected]
ABSTRACT
A simple, specific, precise, and accurate reversed-phase HPLC method was developed and validated for simultaneous estimation of lisinopril and amlodipine besylate in tablet dosage forms. The separation was achieved by Hypersil ODS-BP C18 column (250 mm × 4.6 mm; 5.0 µm) using methanol: phosphate buffer at pH 6 adjusted
with orthophosphoric acid (30: 70, v/v) as eluent, at a flow rate of 1 mL/min. Detection was carried out at wavelength 212 nm. The retention times of lisinopril and amlodipine besylate were 3.88 min and 2.716 min, respectively. The linearity was established over the concentration ranges of 20–80 µg/mL and 20–80 µg/mL with correlation coefficients (r2) 0.9999 and 0.9993 for lisinopril and amlodipine besylate respectively. The mean recoveries were found to be in the ranges of 98.33–101.37% and 98.90–100.70% for lisinopril and amlodipine besylate respectively. The proposed method has been validated as per ICH guidelines and successfully applied to the estimation of lisinopril and amlodipine besylate in their combined tablet dosage form.
Key words: Lisinopril, Amlodipine Besylate, ICH Validation, RP-HPLC
INTRODUCTION
Lisinopril (LSNP) is a potent, competitive inhibitor of angiotensin-converting enzyme (ACE), the enzyme responsible for the conversion of angiotensin I (ATI) to angiotensin II (ATII).ATII regulates blood pressure and is a key component of the renin-angiotensin-aldosterone-system (RAAS). Lisinopril may be used to treat hypertension and symptomatic congestive heart failure, to improve survival in certain individuals following myocardialinfarction and to prevent progression of renal disease in hypertensive patients with diabetes mellitus and microalbuminuria or overt nephropathy.
Lisinopril is chemically (2S)-1-[(2S)-6-amino-2-{[(1S)-1-carboxy-3- phenylpropyl]amino}hexanoyl] pyrrolidine- 2-carboxylic acid[1,2] (Figure 1).
Amlodipine ( AMD) is a longacting 1,4-dihydropyridine calcium channel blocker. It acts
primarily on vascular smooth muscle cells by stabilizing voltage-gated L-type calcium channels in their inactive conformation. By inhibiting the influx of calcium in smooth muscle cells, amlodipine prevents calcium-dependent myocyte contraction and vasoconstriction. A second proposed mechanism for the drug’s vasodilatory effects involves pH-dependent inhibition of calcium influx via inhibition of smooth muscle carbonic anhydrase. Some studies have shown that amlodipine also exerts inhibitory effects on voltage-gated type calcium channels. N-type calcium channels located in the central nervous system may be involved in nociceptive signaling and pain sensation. Amlodipine is used to treat hypertension and chronic stable angina. Amlodipine is chemically 3-ethyl-5- methyl-2-[(2-aminoethoxy) methyl]-4-(2-chlorophenyl)-6-methyl-1,4-dihydro pyridine-3,5-dicarboxylate[1,2] (Figure 2). The review of literature revealed that a few spectroscopic [3-5], HPLC [6-9], HPTLC[10], LC-MS[11,12] and CE[13]
International Journal of Pharmacy
methods have been reported earlier for the individual determination of amlodipine and lisinopril in pharmaceutical dosage forms. But no method is developed so far for the combination of amlodipine and lisinopril. A successful attempt is made to estimate the two drugs simultaneously. Therefore it was thought worthwhile to develop an accurate and rapid RP-HPLC method for simultaneous estimation of amlodipine and lisinopril from tablet formulations
[14].
EXPERIMENTAL
Materials and Reagents: The reference sample of lisinopril and amlodipine besylate was supplied by Cipla Pharmaceutical Ltd., Mumbai, India. HPLC grade water and methanol were purchased from E. Merck (India) Ltd., Mumbai, India. Potassium dihydrogen phosphate and orthophosphoric acid of AR Grade were obtained from S.D. Fine Chemicals Ltd.,Mumbai, India. Tablet of LSNP and AMD in combined dosage form, AMLOPRESS-L, with 5mg LSNP and 5mg AMD lable claim manufactured by Cipla Pharmaceutical Ltd.
Instrumentation: An isocratic HPLC system
(Analytical Technologies Limited) consisted of P2230 plus HPLC pump, variable wavelength programmable UV 2230 plus detector system, Rhenodyne valve with 20µL fixed loop and Analchrom 2006 as operating software. The chromatographic column used was Hypersil ODS-BP C18 column (250 mm × 4.6 mm; 5.0 µm). Analytical
balance (wensar) was used for weighing purpose.
Chromatographic Condition: A mixture of
Methanol: Phosphate Buffer at pH 6 adjusted with orthophosphoric acid (30:70v/v) was used as mobile phase and was filtered through 0.45µ membrane filter prior to use. The flow rate of mobile phase was maintained at 1mL/min. Detection was carried out at 212nm at the ambient temperature. Total run time 7min was used with injection volume of 20 µL.
Preparation of mobile phase and Standard Stock
Solution: Accurately weighed potassium dihydrogen
phosphate (13.6gm) into 1000mL beaker, dissolved and diluted to 1000mL with HPLC water and pH adjusted to 6.0 with orthophosporic acid. 700mL of this solution mixed with 300mL of methanol. The solution was sonicated for 10minand filtered through 0.45µ membrane filter. 100mg of standard LSNP and AMD were accurately weighed and transferred separately to a 50 mL volumetric flask and dissolved with mobile phase. The flask was sonicated for 10min. The flask was shaken and volume was made
up to the mark with mobile phase to give a solution containing 1000µg/mL LSNP and AMD respectively. Appropriate volume of aliquot from LSNP and AMD standard stock solution was further diluted with mobile phase to obtain final concentration of 100µg/mL respectively.
Determination of LSNP and AMD from
Combined Dosage Form: A powder quantity
equivalent to 100 mg LSNP and AMD was accurately weighed and transferred to volumetric flask of 100 mL capacity. 50mL of solvent (methanol: phosphate buffer (30:70)) was transferred to this volumetric flask and sonicated for 10min. The flask was shaken and volume was made up to the mark with mobile phase. The above solution was filtered through membrane filter (0.45µ). From this solution 10mL was transferred to volumetric flask of 100mL capacity. Volume was made up to the mark to give a solution containing 100µg/mL. From this solution 4mL was transferred to volumetric flask of 100mL capacity. Volume was made up to the mark to give a solution containing 40µg/mL. The resulting solution was analyzed by proposed method. The prepared sample solution was chromatographed for 7 minutes using mobile phase at a flow rate of 1.0mL/min. From the peak area obtained in the chromatogram the amounts of both drugs were calculated.
Method Validation [15]
The proposed method has been extensively validated in terms of specificity, linearity, accuracy, precision, limits of detection (LOD) and quantification (LOQ), robustness and system suitability. The accuracy was expressed in terms of percent recovery of the known amount of the standard drugs added to the known amount of the pharmaceutical dosage forms. The precision (% RSD) was expressed with respect to the repeatability, intraday, and interday variation in the expected drug concentrations. After validation, the developed methods have been applied to pharmaceutical dosage form.
Specificity: Commonly used excipients (starch,
microcrystalline cellulose and magnesium stearate) were spiked into a preweighed quantity of drugs. The chromatogram was taken by appropriate dilutions and the quantities of drugs were determined.
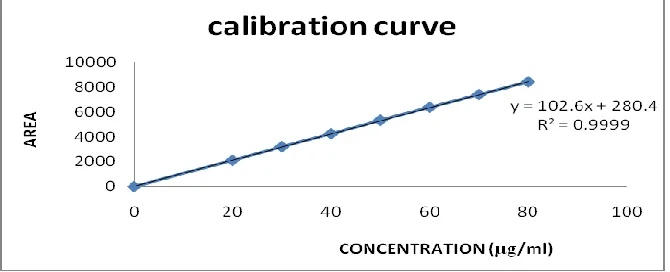
Linearity: Appropriate volume of aliquot form
40, 50, 60, 70 and 80µg/mL). The mixed standard solution was chromatographed using above chromatographic condition (n=6). All solutions were filtered through 0.45µm filter prior to use. Calibration curve were constructed by plotting average peak area versus concentrations for both drugs. Straight line equations were obtained from these calibration curves.
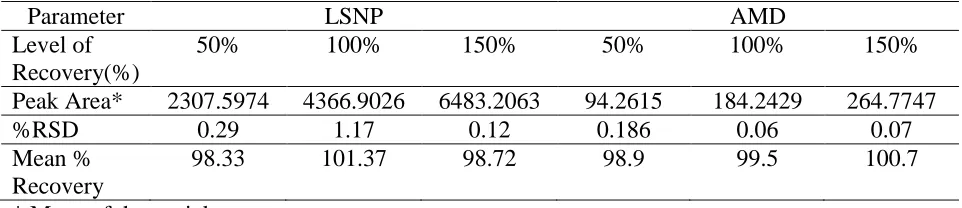
Accuracy: Accuracy was assessed by determination of the recovery of the method by addition of standard drug to pre-analyzed test sample preparation at three different levels 50, 100 and 150% taking into consideration percentage purity of added bulk drug samples. Each concentration was chromatographed 3 times and average recoveries were measured.
Precision: The repeatability was evaluated by
assaying 6 times of test samples prepared for assay determination. The intraday and interday precision study of LSNP and AMD was carried out by estimating different concentrations of LSNP and AMD 3 times on the same days and on 3 different days and the results are reported in terms of % RSD.
Detection Limit and Quantitation Limit: ICH
guideline describes several approaches to determine the detection and quantitation limits. These include visual evaluation signal-to-noise ratio and use of standard deviation of the response and the slope of the calibration curve. In the present study the LOD and LOQ were based on the third approach and were calculated according to the 3.3σ/s and 10σ/s criterions respectively, where σ is the standard deviation of y-intercepts of regression lines and s is the slope of the calibration curve.
Robustness: The robustness of the method was
evaluated by assaying test solutions after slight but deliberate changes in the analytical conditions. For the proposed method it was done by changing the column temperature and variation of flow rate. There was no significant impact on the retention time and tailing factor.
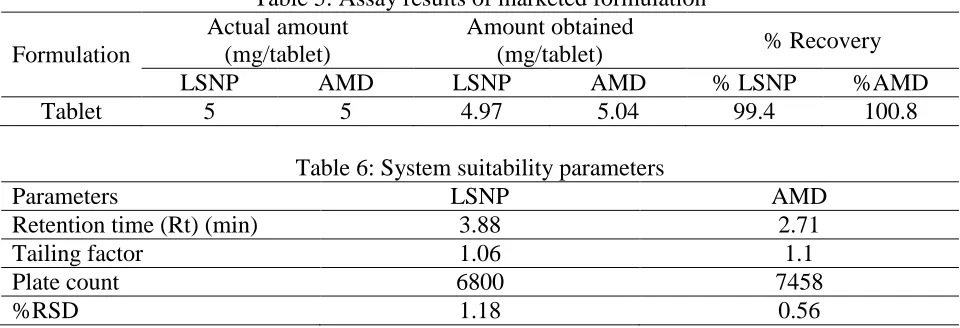
System Suitability: The suitability of the
chromatographic system was tested before each stage of validation. Five replicate injections of standard preparation were injected and tailing factor, USP plate count and %RSD (Relative Standard Deviation) of peak area were determined.
Determination of LSNP and AMD from combined
Dosage Form: Sample solution was injected six
times at above chromatographic conditions. An average peak area was measured from
chromatograms. The quantitation was carried out by keeping these values to the straight line equation of calibration curve.
RESULT AND DISCUSSION
Optimizations of chromatographic conditions were performed to obtain the best peak and parameter (asymmetry, theoretical plates). For the selection of mobile phase initially methanol-water, acetonitrile – water and acetonitrile – phosphate buffer have been tried in different ratio which gave poor peak shape. Then methanol: phosphate buffer adjusted to pH 6.0 in different ratio have been tried. Finally methanol: phosphate buffer at pH 6 adjusted with orthophosphoric acid (30:70v/v) was found to be satisfactory and gave two symmetrical peaks for LSNP and AMD at flow rate of 1mL/min. The average retention times for LSNP and AMD were 3.8833 and 2.716 minutes respectively. The tailing factors for LSNP and AMD 1.06 and 1.17 respectively. For the selection of detection wavelength overlain UV spectrum of LSNP and AMD was taken which revealed that at 212nm both the drugs possess significant absorbance (Figure 3 and 4; Table 6). Summary of validation parameters for proposed method was given in Table 1.
The developed HPLC method was validated. The linear range, correlation coefficient, detection limit and standard deviation for LSNP and AMD by HPLC method are shown in Table 2 and Figure 5 and 6). Accuracy was determined by calculating the recovery. The method was found to be accurate with % recovery 98.33 – 101.37% for LSNP and 98.90 – 100.70 for AMD respectively in Table 4).
CONCLUSION
The proposed HPLC method provide simple, specific, precise, accurate and reproducible quantitative analysis for simultaneous analysis of LSNP and AMD in combined dosage form. The
method was validated as per ICH guidelines in terms of specificity, linearity, accuracy, precision, limits of detection (LOD) and limits of quantification (LOQ), robustness and reproducibility. The proposed method can be used for routine analysis and quality control assay of LSNP and AMD in combined dosage form.
Figure 1: Structure of Lisinopril
Figure 2: Structure of Amlodipine besylate
Figure 4: Chromatogram of Sample formulation
Figure 5: Linearity plot of lisinopril
Table 1: Summary of Validation parameters
Parameters
Lisinopril
Amlodipine Besylate
Recovery %
98.33 – 101.37
98.90 – 100.70
Precision- Intraday (%RSD)
0.12 – 1.17
0.06 – 0.18
Precision- Interday (%RSD)
0.26 – 0.58
0.34 – 1.36
Limit of detection (µg/ml)
0.012
0.027
Limit of quantification
(µg/ml)
0.037
0.083
Specificity
Specific
Specific
Robustness
Robust
Robust
Solvent stability
Solvent stable for 24 hrs
Solvent stable for 24 hrs
Table 2: Calibration data for LSNP and AMD
Parameter
LSNP
AMD
Detection Wavelength (nm)
212
212
Linear range (µg/ml)
20 – 80
20 – 80
Intercept
280.4
9.521
Slop
102.6X
4.309X
Correlation co-efficient (r
2)
0.9999
0.999
Linearity Regression equation
(y=mx+c)
Y=102.6x+280.4
Y=4.309x+9.521
Table 3: Robustness study for LSNP and AMD
Condition varied
Changed
condition
Area (n=6)
% Assay
LSNP±S.D
AMD±S.D
LSNP
AMD
Flow rate
(ml/min)
0.8
4393.0335±0.007 184.79±0.035
100.19
101.68
1.0
4393.1357±0.013 184.60±0.041
100.21
101.57
1.2
4392.9927±0.018 184.18±0.037
100.20
101.38
Temperature (ͦ C)
20
4393.3025±0.004 184.25±0.167
100.21
101.37
25
4393.1032±0.008 184.39±0.105
100.21
101.37
30
4393.3396±0.005 184.19±0.096
100.21
101.33
Table 4: Recovery studies of LSNP and AMD
Parameter
LSNP
AMD
Level of
Recovery(%)
50%
100%
150%
50%
100%
150%
Peak Area*
2307.5974
4366.9026
6483.2063
94.2615
184.2429
264.7747
%RSD
0.29
1.17
0.12
0.186
0.06
0.07
Mean %
Recovery
98.33
101.37
98.72
98.9
99.5
100.7
Table 5: Assay results of marketed formulation
Formulation
Actual amount
(mg/tablet)
Amount obtained
(mg/tablet)
% Recovery
LSNP
AMD
LSNP
AMD
% LSNP
%AMD
Tablet
5
5
4.97
5.04
99.4
100.8
Table 6: System suitability parameters
Parameters
LSNP
AMD
Retention time (Rt) (min)
3.88
2.71
Tailing factor
1.06
1.1
Plate count
6800
7458
%RSD
1.18
0.56
REFERENCES
1. Budawari S, editors. The Merck Index. In: 13 th ed., Whitehouse Station, NJ; Merck and Co Inc: 2001. 2. Sweetman SC, editors. Martindale: The complete drug reference. In: 33 rd ed., London; The
Pharmaceutical Press: 2002.
3. Gohil K, Trivedi P, Molvi KI. Indian J Pharma Sci, 2005; 67: 376-378. 4. Ragno G, Garofalo A, Vetuschi C. J Pharm Biomed Anal, 2002; 27: 19-24. 5. Avadhanulu AB, Pantulu ARR. Indian Drugs, 1993; 30(12): 646-649.
6. Naidu KR, Kale UN, Shingare MS. J Pharma Biomed Anal, 2005; 39:147-155.
7. Ravi SS, Nanjan MJ, Vasudevan M, Shaat N, Suresh B, Sankar SR. Indian J Pharm Sci, 1997; 59:171-173. 8. El-Yazbi FA, Abdine HH, Shaalan RA. J Pharm Biomed Anal, 1999; 19(6): 819-827.
9. Christopher AB, Jessica Shaw, Zack Zhao, Robert A Reed, J Pharm Biomed Anal, 2005; 37(3): 559-567. 10. Meyyanathan SN, Suresh B, J Chromatogr Sci, 2005; 45: 73-75.
11. Bhatt J, Singh S, Subbaiah G, Shah B, Kambli S, Ameta S, J Biomed Chromatogr Sci Appl, 2007; 21: 169-175.
12. Feng Y, Shen L, Pan F, Zhang Z, J Chromatogr Sci Appl, 2002; 40: 49-53. 13. Qin XZ, Nguyen DS, Ip DP, J Liq Chromatog, 1993; 16(17): 3713-3734.
14. ICH Harmonized Tripartite Guidelines, validation of Analytical Procedures: Text and Methodology, Q2 (R1), Geneva, Switzerland, 2005.